At $420, Microsoft (NASDAQ:MSFT | MSFT Price Prediction) screens as compelling for research. The stock has slid 12.22% year to date even as the AI business surged past a $37 billion annualized run rate, up 123% year over year, creating an unusual gap between price action and fundamentals.
Microsoft sits at the center of the enterprise AI buildout. Azure has held 40% growth across four consecutive quarters, while Microsoft 365, Dynamics, and the OpenAI partnership extend its reach across productivity, data, and frontier models. The stock filed Q1 at $517.85, Q2 at $451.01, and Q3 at $428, a steady de-rating despite escalating beats.
Why the de-rating creates an entry point
Q3 FY26 delivered $4.27 EPS against $4.07 expected, the fourth straight beat, on revenue of $82.89 billion, up 18.3% year over year. Operating income climbed 20% and net income 23%.
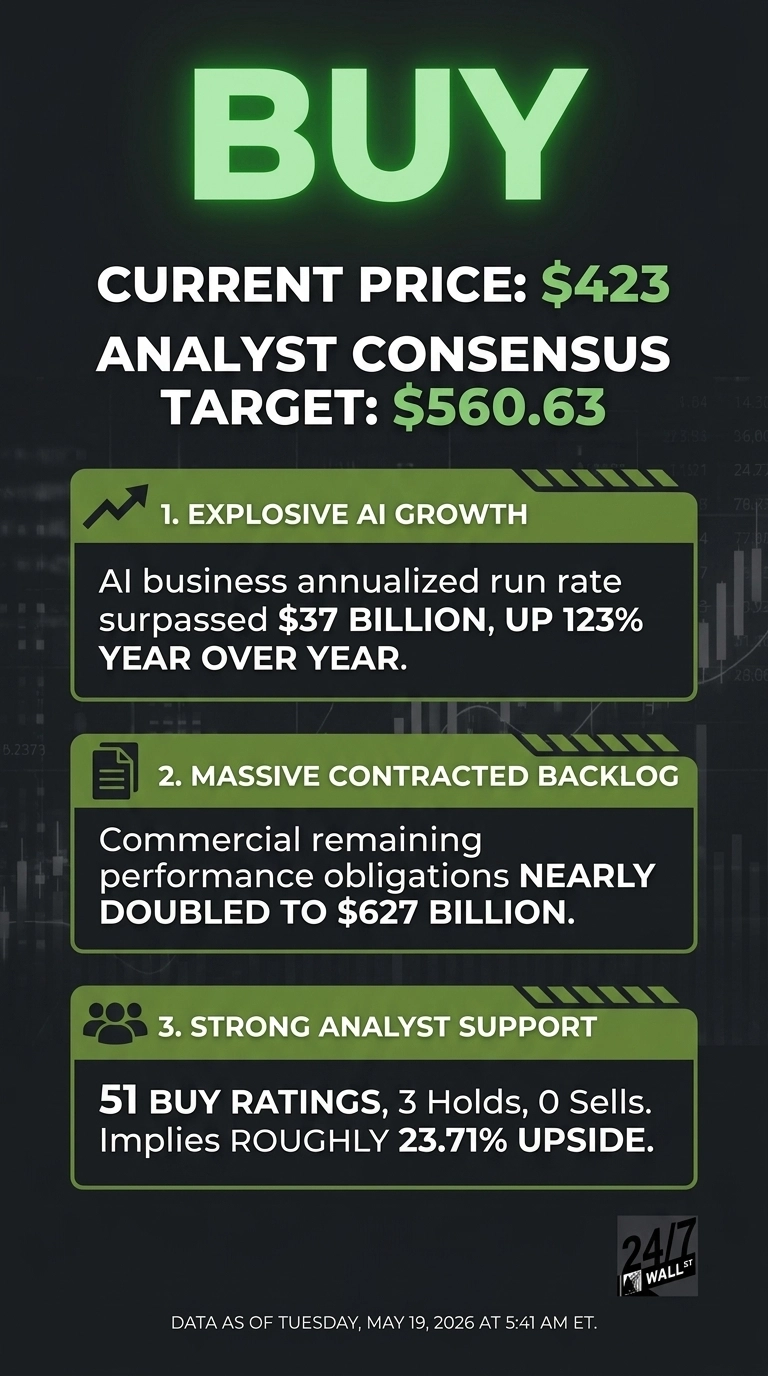
The forward indicator is the backlog. Commercial remaining performance obligations nearly doubled to $627 billion, reinforced by OpenAI’s $250 billion Azure commitment and Microsoft’s IP rights extended through 2032. At a 31 trailing and 21 forward P/E, the market is paying a reasonable multiple for 46.3% operating margins and 34% ROE.
Why the capex bill is scaring investors
Capital expenditures hit $30.88 billion in the quarter, up 84.39% year over year, and free cash flow already fell 3.32% in FY25. OpenAI investment losses widened to $3.1 billion in Q1 FY26 versus $523 million a year earlier, and OpenAI is no longer exclusive to Azure for non-API products.
Rates are not helping. The 10-year Treasury sits at 4.59%, its 99.6 percentile over the past year, pressuring premium multiples. Insiders agree something is off: CFO Amy Hood, Vice Chair Brad Smith, and Commercial CEO Judson Althoff all sold on March 2 at $392.74.
Why patience could win the argument
The Hold case rests on timing. Composite prediction-market sentiment reads 44.67, neutral, and Polymarket traders peg the most likely May close at $435 with 58.5% probability, hardly a breakout. With the next earnings report not due until July 29, 2026, investors have 71 days to see whether Azure growth holds and capex begins translating to monetization.
What the price action and the Street are actually saying
Microsoft trades at $423.54, down 6.22% over the past year while the broader market trend has been more constructive, leaving MSFT trailing the S&P 500 over the same period. The Street is unmoved by the slide: 51 buy ratings, 3 holds, and 0 sells sit behind an average target of $560.63, implying roughly 23.71% upside. Targets are one input, not a guarantee.

Why $423 looks like an interesting level for research
At $423, the setup for Microsoft looks constructive. Here is why. The path to appreciation is straightforward: Azure compounds at 40%, the $627 billion backlog converts to revenue, and AI run-rate growth at 123% begins to dwarf the capex bill that is currently weighing on sentiment.
The risk/reward skew looks favorable at this level. The bear scenario in our model still produces a 9.31% one-year return, while the base case targets $523.95. Trading 2% off the 52-week high in a stock down meaningfully YTD is the kind of asymmetry value-oriented growth investors look for.
The thesis fails if Azure growth breaks below 35%, if capex keeps climbing without backlog conversion, or if the OpenAI relationship deteriorates further. The July 29 earnings report is the catalyst to watch. Until those signals flash red, paying 21x forward earnings for the dominant cloud-and-AI franchise looks reasonable on the fundamentals.

Contact [email protected] for any questions or corrections.