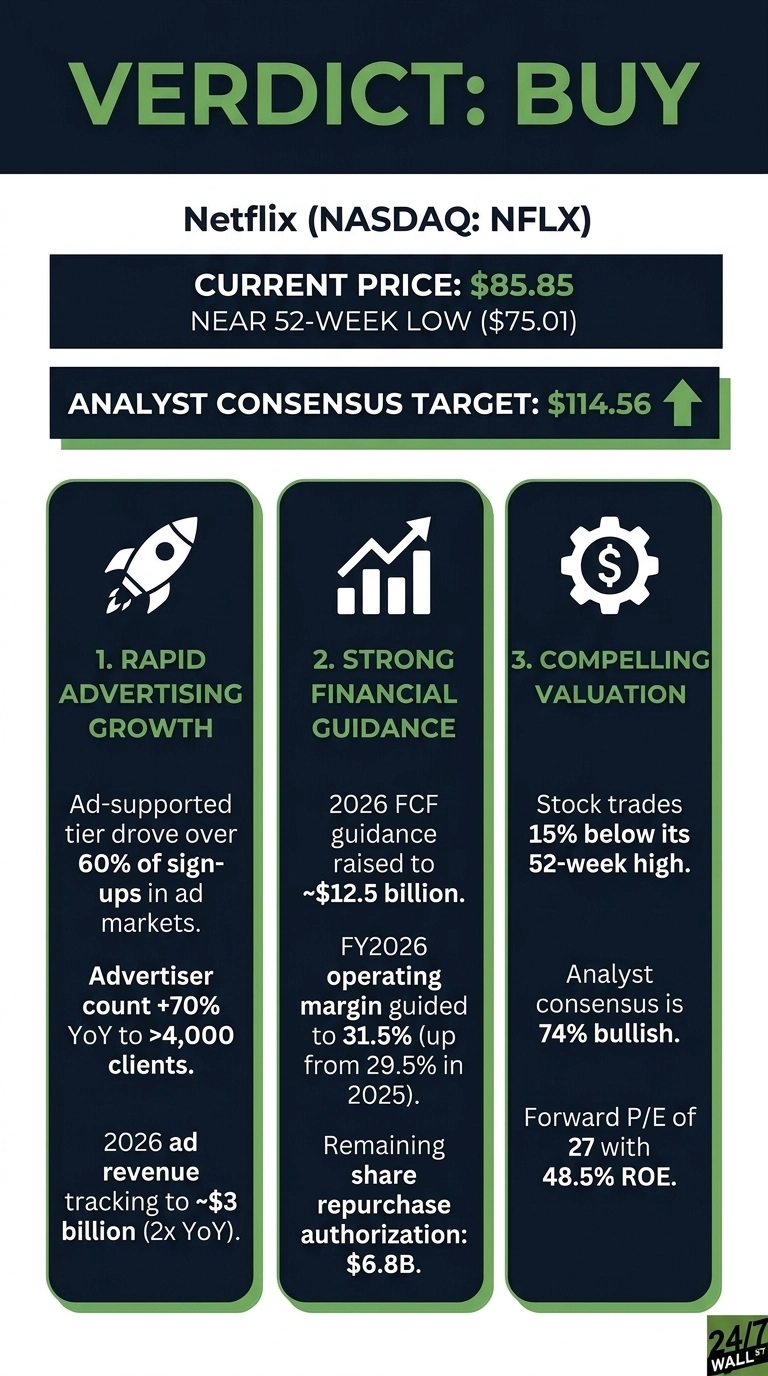
At $85.85, Netflix (NASDAQ:NFLX | NFLX Price Prediction) looks attractively positioned. The streaming giant trades 15% below its 52-week high and just above its $75.01 52-week low, even as the company raised free cash flow guidance and accelerated its advertising ramp.
Netflix is the dominant subscription streaming platform with more than 325 million paid memberships and a rapidly scaling ad business. The decline traces to a peak near $122.54 in June 2025, followed by sentiment unwind through the Warner Bros. acquisition saga and a Brazilian tax charge that bruised Q3.
The company walked away from the Warner deal, pocketed a $2.80 billion termination fee, and resumed buybacks with $6.8B in authorization remaining.

The Bull Case: An Ad-Tier Inflection at a Discounted Multiple
Q1 2026 revenue grew 16.2% year over year to $12.25 billion, beating consensus. Free cash flow surged 91.4%, and management raised 2026 FCF guidance to roughly $12.5 billion from $11 billion. Operating margin is now guided to 31.5%, up from 29.5% in 2025.
The advertising business is the inflection. Ad-supported tiers drove over 60% of sign-ups in ad markets, advertiser count rose 70% YoY to more than 4,000 clients, and 2026 ad revenue is tracking to roughly $3 billion, double last year. At a forward P/E of 27 with 48.5% ROE and quarterly earnings growth of 86.4%, the entry point looks compelling for a category leader.
The Bear Case: Heavy Insider Selling and Premium Multiples
C-suite insiders have been unloading aggressively. On May 4, 2026, Co-CEOs Greg Peters and Ted Sarandos, CFO Spencer Neumann, and other officers sold coordinated blocks at $92.06. Additional disposals followed on May 5 and May 7 between $87.97 and $88.95. No executive outside founder Reed Hastings has been buying common stock at depressed levels.
The Q1 EPS of $1.23 missed the $1.345 estimate by 8.55%, though net income was inflated by the Warner termination fee. Strip that out and the operational picture is more pedestrian. Competition from Disney, Amazon, Apple, and YouTube remains brutal, and the declined Warner deal removes a content-acceleration lever.
The Hold Case: Wait for Margin Confirmation
Content amortization growth is first-half weighted in 2026, which could pressure margins before the guided H2 expansion materializes. The Brazilian tax overhang shifted $700 million in deposits into 2026, and FX volatility remains a wildcard. Patient investors might wait for Q2 to confirm the 32.6% operating margin guide and prove the ad ramp is durable.
What the Numbers Say
Netflix currently trades at $85.85, down 8.44% year to date and 28.89% over the past year. The S&P 500 is up roughly 11% YTD over the same stretch, making Netflix a sharp underperformer. The Wall Street consensus price target sits at $114.56, implying meaningful upside from current levels.
The analyst ratings breakdown:
- Strong Buy: 8
- Buy: 29
- Hold: 12
- Sell: 0
- Strong Sell: 1
That works out to 74% bullish coverage.

The Verdict: A Sentiment-Driven Drawdown Worth Watching
At $85.85, the setup for Netflix skews favorable. The price action reflects sentiment rather than fundamental deterioration. Revenue is compounding mid-teens, operating margin is guided higher, and free cash flow was just raised. The ad business has crossed from experiment into a measurable growth engine adding roughly $1.5 billion of incremental revenue this year.
The most likely path to appreciation runs through Q2 and Q3 prints that validate the 31.5% operating margin guide as content amortization decelerates in the back half. A resumed buyback against $6.8B of authorization provides a floor.
The thesis breaks if engagement falters, ad pricing stalls, or margins miss the 31.5% bar. Watch member growth in Japan and Latin America, the ad upfront, and content amortization commentary each quarter. A category leader with accelerating cash flow trading at a forward multiple in the high 20s, just above a 52-week low, offers a setup that rewards patience.
Contact [email protected] for any questions or corrections.