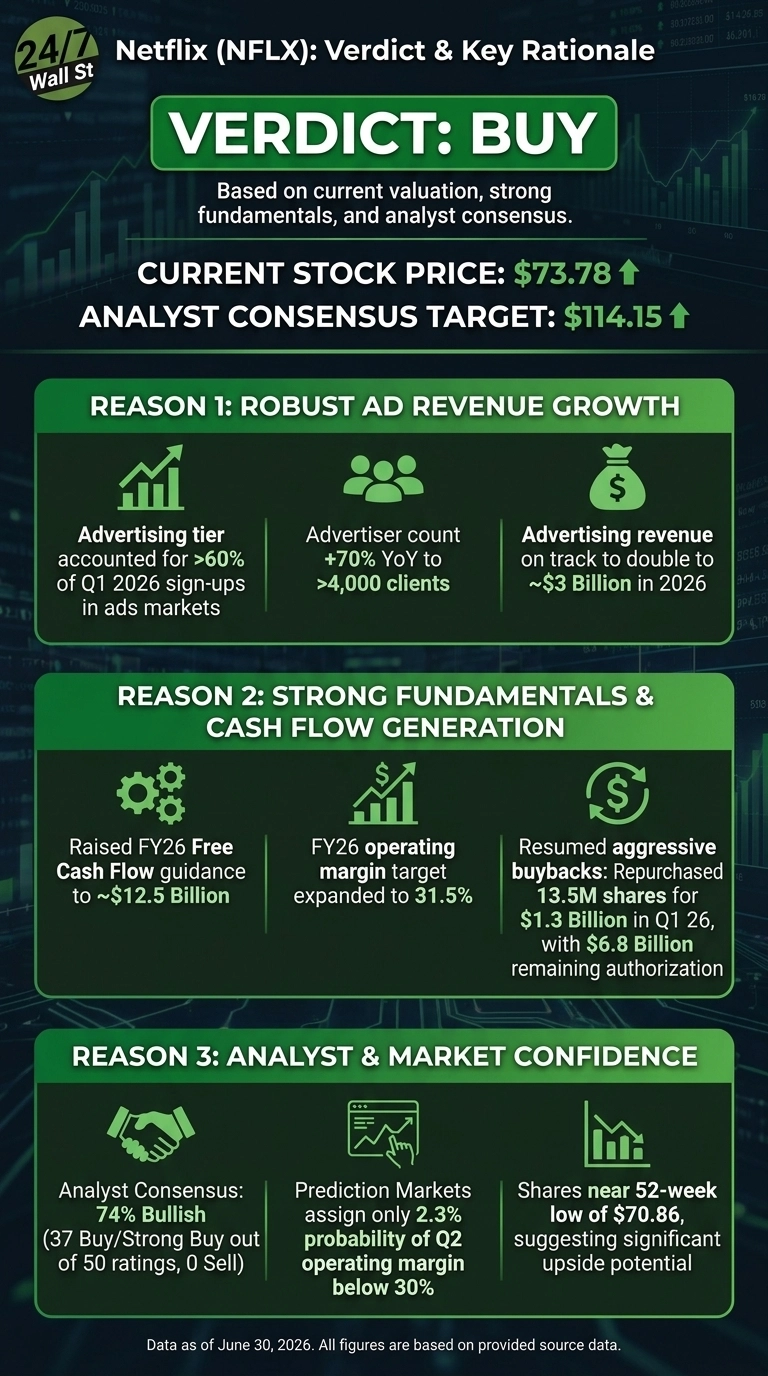
At $73.78, Netflix (NASDAQ:NFLX | NFLX Price Prediction) looks compelling at current levels. Shares sit barely above the $70.86 52-week low after shedding 44.24% of its value while the broader market rallied.
Netflix dominates global subscription video with more than 325 million paid memberships, an advertising tier scaling toward $3 billion in 2026 revenue, and operating margins approaching 31.5%. The selloff traces to a Q1 EPS miss, the abandoned Warner Bros. deal, and content-amortization fears, yet the operating engine has measurably accelerated.
A Pullback That Looks Disconnected From Fundamentals

Buyers see a rare valuation reset in a category-defining business. Netflix trades at a trailing P/E of 24x and a forward P/E of 23x, modest for a company guiding to 12% to 14% revenue growth and FY26 free cash flow of $12.5 billion, raised from $11 billion.
The ad-supported tier captured over 60% of Q1 sign-ups in ads markets, with advertiser count up 70% year over year to more than 4,000 clients. Management resumed buybacks aggressively, repurchasing 13.5 million shares for $1.3 billion in Q1 with $6.8 billion remaining. Wall Street backs the case: 37 of 50 analysts rate NFLX Buy or Strong Buy, zero rate it Sell.
The Bear Argument: Competition Is Outrunning the Story

Bears note the Q1 EPS print of $1.23 missed expectations by 8.55%, and reported net income of $5.28 billion was inflated by a $2.80 billion Warner Bros. termination fee. Strip that out and operating performance looks far less explosive.
Competition from Disney, Amazon, Apple, YouTube, and TikTok intensifies for attention and ad dollars. Content amortization growth is first-half weighted in 2026, premium pricing has been implemented in major markets, and walking away from Warner Bros. caps Netflix’s IP acceleration. A beta of 1.49 means further drawdowns are plausible if guidance slips again.
The Hold Argument: Wait for One More Quarter

The patient view: Netflix missed earnings in two of the last three quarters, including a 15.71% miss in Q3 2025, and the next print arrives within weeks. An in-line Q2 with operating margin in the 32% to 36% band would likely re-rate the stock; another shortfall could puncture the 52-week low.
The Numbers Tell a Pricing-In Story
NFLX trades at $73.78, down 21.31% year to date versus the S&P 500’s 8.66% gain. The consensus analyst target of $114.15, drawn from 50 analysts, implies substantial upside.
The ratings breakdown:
- Strong Buy: 8
- Buy: 29
- Hold: 13
- Sell: 0
- Strong Sell: 0
Netflix carries an EV/EBITDA of 9x, operating margin of 32.3%, and ROE of 48.5%. The 200-day moving average of $97.04 sits well above current levels, underscoring how much pessimism is already in the price.
At $73.78, the Setup for Netflix
The market is punishing one EPS miss and lost Warner Bros. optionality while the underlying business is putting up its best free cash flow guide ever at $12.5 billion, stepping operating margin to 31.5%, and doubling advertising revenue toward $3 billion.
The path to appreciation has three legs. First, the July earnings report against a 32.6% operating-margin guide should reset the narrative; prediction markets assign just a 2.3% probability of margins printing below 30%. Second, the content slate carrying Denzel Washington, Greta Gerwig’s Narnia, and David Fincher de-risks engagement through 2026. Third, the resumed buyback at depressed prices compounds per-share value with $6.8 billion authorized.

Risk/reward asymmetry has shifted at these levels. With shares within $3 of the 52-week low, the bear scenario now requires fundamentals to deteriorate outright. The thesis breaks if Q2 operating margin lands below 30% or FY26 free cash flow guidance is cut.
Netflix is trading near a 52-week low while management is raising free cash flow guidance and repurchasing stock, a notable divergence between price and fundamentals.
Contact [email protected] for any questions or corrections.