EEM’s 0.69% Fee Quietly Costs You $690 a Year, but Your Cheaper Alternative Charges $90
If you hold iShares MSCI Emerging Markets ETF (NYSEARCA:EEM), BlackRock skims 0.69% of your account every year before you see a single dividend. That is roughly $69 a year on every $10,000 you have parked in the fund. It sounds…


If you hold iShares MSCI Emerging Markets ETF (NYSEARCA:EEM), BlackRock skims 0.69% of your account every year before you see a single dividend. That is roughly $69 a year on every $10,000 you have parked in the fund. It sounds small. Compounded across a working life, it is the price of a used car you never bought.
What You Are Actually Paying
EEM’s net expense ratio sits at 0.69% as of April 22, 2026. The cheaper iShares sibling, iShares Core MSCI Emerging Markets ETF (NYSEARCA:IEMG), charges 0.09% as of March 18, 2026. That is the same issuer, broadly the same exposure, at roughly one-eighth the fee.
In plain dollars: $69 a year per $10,000 in EEM versus about $9 a year in IEMG. On a $100,000 position, that is the difference between paying $690 and $90 every single year, for what is effectively the same emerging markets basket. Hold either fund for 20 years and the gap compounds into a meaningful slice of your terminal balance, transferred quietly from your account to the issuer’s revenue line.
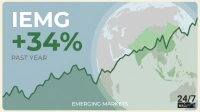
And the receipts back this up. Over the past ten years, EEM has returned 158.73% on a price basis. IEMG, over the same window, returned 171.13%. Same issuer. Same emerging markets story. The cheaper fund won. The expense line did most of the work.
The Part the Factsheet Does Not Highlight
EEM markets itself as “diversified emerging markets.” Open the hood and the diversification claim gets thin fast. The top three holdings, Taiwan Semiconductor at 14.09%, Samsung Electronics at 5.98%, and SK Hynix at 4.01%, are all Asian semiconductor names. That is roughly a quarter of the fund concentrated in one industry, in one corner of one continent. Add Tencent at 3.24% and Alibaba at 2.34%, and a single sleeve of Asian tech runs the show.
That concentration is not unique to EEM. IEMG’s top holdings look nearly identical, led by Taiwan Semiconductor at 11.49% and Samsung at 4.39%. Which is the point. You are paying 0.69% for a portfolio that overlaps massively with a 0.09% portfolio sitting on the same issuer’s shelf. The premium fee mostly buys older share-class plumbing and a ticker that institutions still trade for liquidity, with little incremental exposure to show for it. Retail holders inherit the cost without getting the institutional benefit.
The Cheaper Mirror
The obvious alternative is IEMG, which has tracked the same emerging markets opportunity at a sliver of the cost and, over a decade, has outpaced EEM on total price return. Vanguard FTSE Emerging Markets ETF (NYSEARCA:VWO) is the other contender, with a different index methodology that excludes South Korea. That methodology difference matters: VWO returned 27.31% over the past year, while EEM returned 49.96%, largely because EEM held the Korean semiconductor names that ripped higher. The trade-off is real. The fee gap, however, runs in VWO’s favor too.
What This Means for You
The real question is whether you are paying 0.69% for an exposure you can get from the same issuer for 0.09%. If you are sitting in EEM out of habit, in a taxable account where a switch would trigger gains, the cost calculus is more complicated. In a tax-advantaged account, the math is simpler than the marketing wants it to look. Let your statement, rather than the factsheet, settle the question.
Contact [email protected] for any questions or corrections.
I am a long time investor and student of business, and believe finding good companies that can become great investments is the best game on earth. After 20 years of writing and researching the public markets it is clear that individuals have never had more tools and information to take control of their financial lives. From ETFs and $0 commissions to cryptos and prediction markets there has never been a greater democratization of access to investing.
I write to help people understand the investments available to them so they can make the best choice for their portfolio, whether they're starting out or looking for income in retirement.