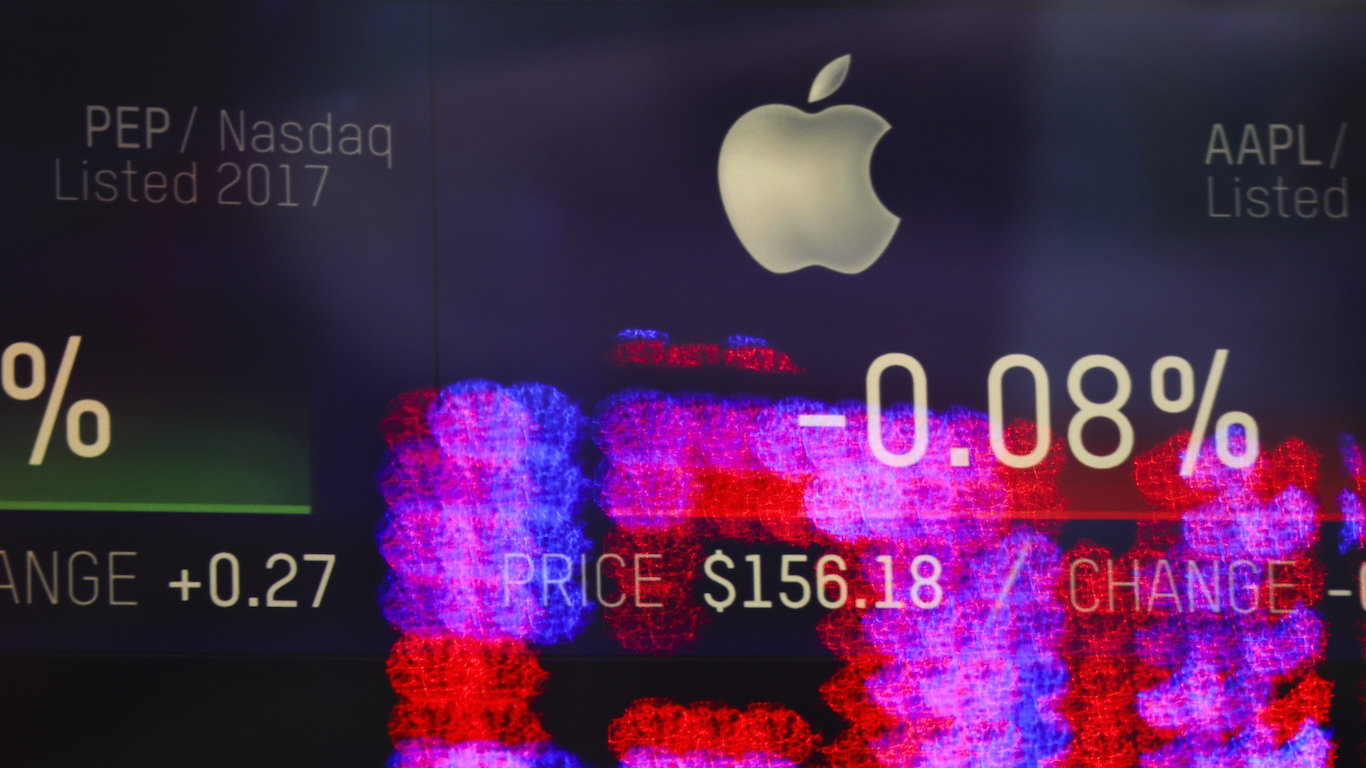
Apple (NASDAQ:AAPL | AAPL Price Prediction) became the focal point of a CNBC investment-committee debate after the company raised prices across its Mac, iPad, HomePod, and Vision Pro lines to offset surging memory and storage chip costs. The move sent the stock down 6.2% on Thursday, June 25. Now, some investors are wondering whether this marks a good entry point for the stock.

The Catalyst: A “Hundred-Year Flood” in Memory
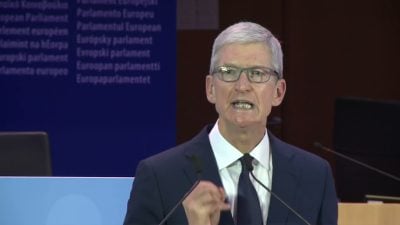
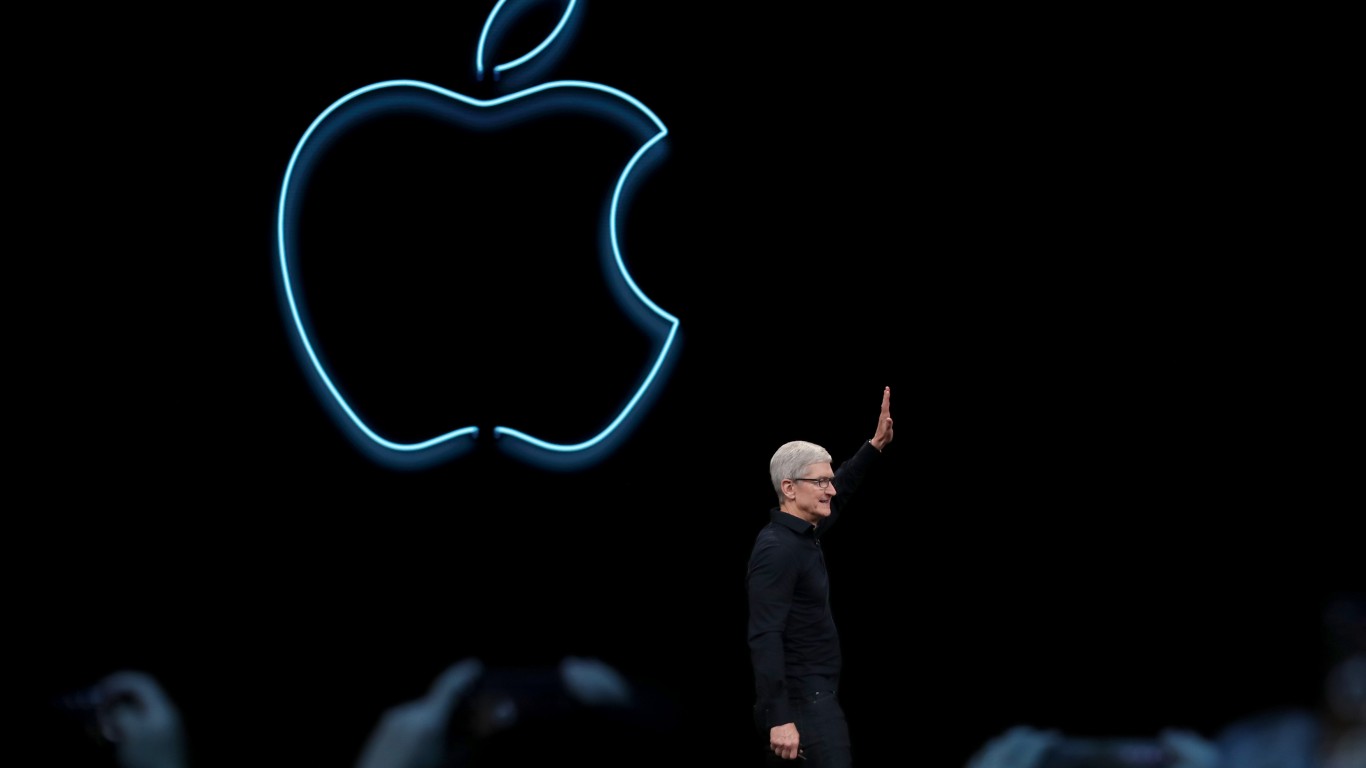
CEO Tim Cook described the supply backdrop as a “hundred-year flood” for memory and storage costs, with AI data-center demand driving component prices sharply higher. Apple pre-announced Mac price increases of 15-20% and iPad increases of 15-25%, with dollar hikes ranging from $100 to $300 on affected SKUs. iPhone, Apple Watch, and AirPods pricing was left unchanged, though the company flagged the potential for further adjustments.
The Committee’s Split View
The segment framed the central risk as “demand destruction,” with the concern being that raising prices could lower consumers’ appetite for new products. One committee member countered that the stock found support near its April low, coinciding with a rising 200-day moving average around $269. That technical reference lines up with Apple’s 200-day SMA at $268.6338 on June 24, 2026, up from roughly $248.28 in early April.
Another panelist offered the bull case directly: “If I’m a trader, I’m standing back, but if I’m an investor, I think it’s a great opportunity,” arguing Apple has more pricing power than any other company in the market. Wedbush maintained an Outperform rating through the drop, viewing the price increases as the first formal pass-through of rising component costs and expressing confidence in Apple’s ability to navigate the “memory storm.”
What the Fundamentals Say
In Q2 FY26, Apple posted revenue of $111.18 billion, up 16.6% year over year, with diluted EPS of $2.01 beating the $1.94 consensus, the eighth consecutive EPS beat. Cook called it Apple’s “best March quarter ever,” citing iPhone revenue of $56.99 billion on iPhone 17 demand and record Services revenue of $30.98 billion. The board also authorized a new $100 billion buyback and lifted the dividend 4% to $0.27 per share.

Margins have been expanding faster than the top line. Gross profit grew 22.1% year over year against 16.6% revenue growth, a sign of pricing leverage that supports the “pricing power” argument.
Where Traders and Markets See the Stock
Technical indicators help explain why the CNBC panel was divided. As of June 24, 2026, Apple’s 14-day RSI stood at 45.84, putting the stock in neutral territory rather than oversold. Meanwhile, Polymarket traders assigned a 93.6% probability that Apple would finish the week above $270, but only a 45.0% chance it would close above $280, suggesting expectations for further near-term upside remain mixed.
Wall Street is more optimistic over the longer term. The consensus analyst price target is $314.42, supported by 30 Buy ratings, 15 Holds, and just 3 Sells. However, Arthur D. Levinson, Apple’s Chairman of the Board of Directors, sold more than 270,000 shares during May, and recent insider activity has been skewed toward selling rather than buying. However, much of that selling appears to be tied to scheduled vesting and prearranged Rule 10b5-1 trading plans.
What to Watch Next
The key question is whether Apple’s higher prices will hurt demand. If Mac and iPad sales remain strong despite the price increases, it would reinforce the company’s pricing power and ease concerns about margin pressure. If demand weakens during the back-to-school and holiday shopping seasons, it would support the argument that higher prices are beginning to discourage buyers.
For now, both sides have evidence to support their case. Apple trades at roughly 36 times earnings, while its 200-day moving average continues to provide an important technical support level. Traders are staying cautious in the near term, while longer-term investors see the recent pullback as a potential buying opportunity.
Contact [email protected] for any questions or corrections.