NVIDIA (NASDAQ:NVDA | NVDA Price Prediction) and Micron Technology (NASDAQ:MU) both delivered blockbuster earnings tied to the same AI capex wave, yet the businesses behind the tickers look nothing alike.
NVIDIA sells the compute platform. Micron sells the memory that feeds it. With $10,000 to allocate, the question is whether you want the ecosystem owner or the picks-and-shovels supplier catching a once-in-a-decade pricing cycle.

Blackwell Prints Cash. HBM4 Rewrites Micron’s P&L.
NVIDIA’s Q1 FY2027 landed with revenue of $81.61 billion, up 85.23% YoY, and non-GAAP EPS of $1.87. Data Center did the heavy lifting at $75.25 billion (+92% YoY), with networking (InfiniBand, Spectrum-X, NVLink) growing 199%.
Jensen Huang called it “the largest infrastructure expansion in human history.” The Blackwell 300 ramp, Vera Rubin roadmap, and hyperscaler commitments from OpenAI, Anthropic, and Meta suggest the pipeline is booked well into 2027.
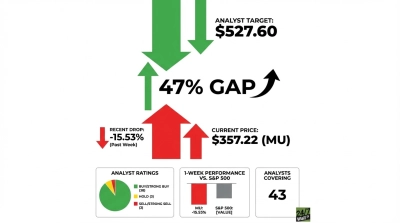
Micron’s fiscal Q3 2026 was arguably wilder. Revenue hit $41.46 billion, up 345.72% YoY, EPS came in at $25.11 against a $20.28 estimate, and GAAP gross margin exploded to 84.6% from 37.7% a year earlier.
HBM4 in high-volume shipments to a lead AI accelerator customer is doing what pricing power looks like on paper. CEO Sanjay Mehrotra pointed to “multi-year Strategic Customer Agreements” as the mechanism designed to tame the historical cyclicality that has burned Micron shareholders before.
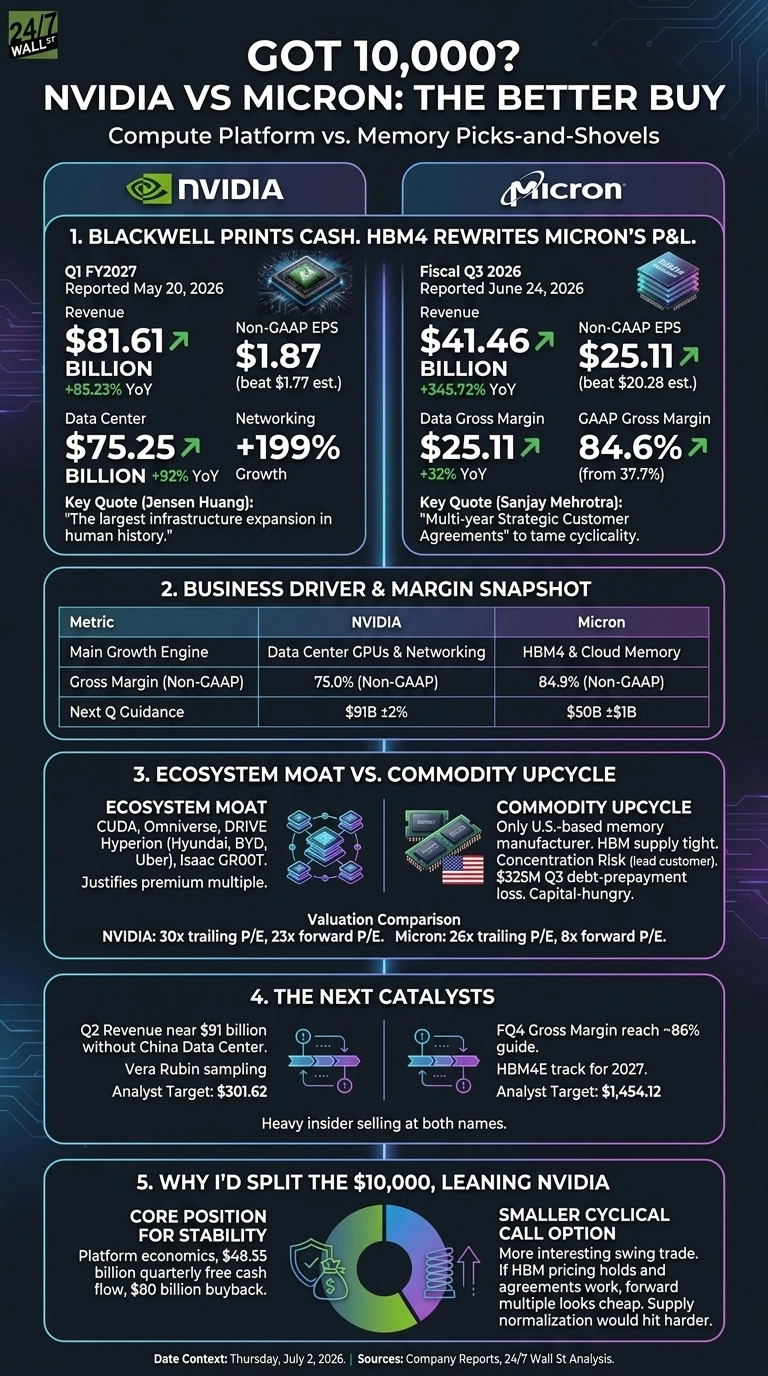
| Business Driver | NVIDIA | Micron |
| Main Growth Engine | Data Center GPUs and networking | HBM4 and cloud memory |
| Gross Margin | 75.0% non-GAAP | 84.9% non-GAAP |
| Guidance | $91B ±2% | $50B ±$1B |
Ecosystem Moat vs. Commodity Upcycle
NVIDIA’s advantage is CUDA, the software layer nobody has cloned, plus a platform that stretches from Omniverse to DRIVE Hyperion (Hyundai, BYD, Uber) to Isaac GR00T robotics. That breadth justifies the premium multiple.
Micron’s advantage is scarcer: it is the only U.S.-based memory manufacturer, and HBM supply is tight. The catch is concentration. HBM4 volume hinges heavily on a single lead customer, and a $325M Q3 debt-prepayment loss reminds you Micron still runs a capital-hungry, cyclical business.
Valuation tells the story. NVIDIA trades at a 30x trailing P/E and 23x forward. Micron sits at 26x trailing and a startling 8x forward, which either signals deep skepticism about margin durability or a genuine mispricing.
The Next Catalysts I’m Tracking
For NVIDIA, the tell will be whether Q2 revenue lands near the $91 billion guide without any China Data Center contribution, and how quickly Vera Rubin sampling firms up.
For Micron, I want to see FQ4 gross margin actually reach the 86% guide and confirmation that HBM4E stays on track for 2027. Analyst targets sit at $301.62 for NVDA and $1,454.12 for MU, though heavy insider selling at both names deserves a raised eyebrow.
Why I’d Split the $10,000, Leaning NVIDIA
If I had to pick one, I’d lean NVIDIA for the core of the position. The platform economics, $48.55 billion in quarterly free cash flow, and the $80 billion buyback give me a stability profile Micron structurally cannot match.
That said, Micron is the more interesting swing trade. If HBM pricing holds through 2027 and the Strategic Customer Agreements do what Mehrotra claims, the forward multiple looks too cheap.
I’d size Micron smaller, treat it as a cyclical call option on AI memory, and acknowledge that a supply normalization would hit it harder than NVIDIA. If you prefer to sleep at night, tilt heavier to NVIDIA. If you want the higher-variance rebound trade, Micron earns a slot.
Contact [email protected] for any questions or corrections.