Over 60 Analysts Recommend Buying This Stock. Here’s Why We Agree.
With 62 analysts already piling into Buy ratings and AWS posting its fastest growth in 15 quarters, the real question is whether a looming $200 billion CapEx bill and collapsing free cash flow change the math before Q2 earnings hit…

This post may contain links from our sponsors and affiliates, and Flywheel Publishing may receive compensation for actions taken through them.

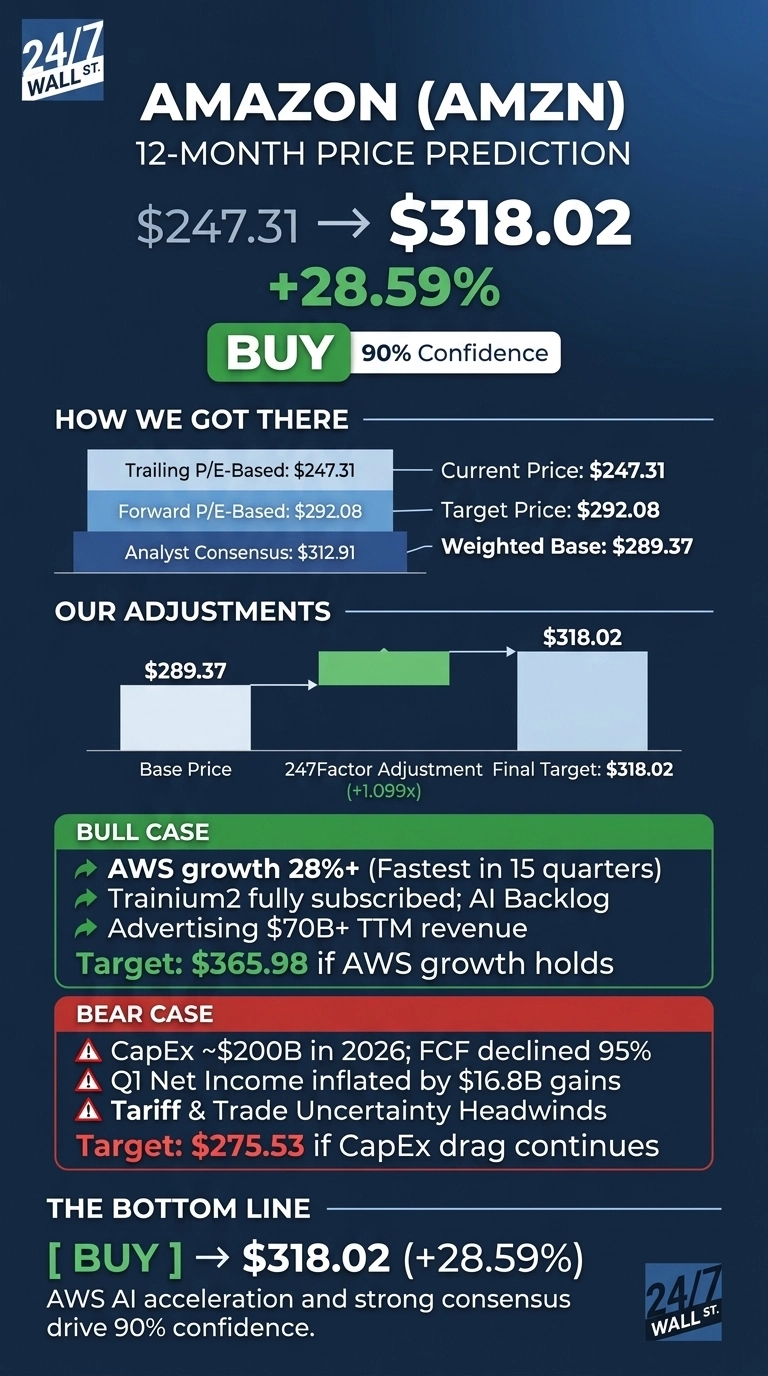
Amazon (NASDAQ:AMZN | AMZN Price Prediction) heads into its July 30, 2026 Q2 earnings report with the stock trading at $247.31 and Wall Street increasingly bullish on AWS re-acceleration. Our 24/7 Wall St. price target for Amazon is $318.02, implying 28.59% upside over the next 12 months. The recommendation is buy at 90% confidence.
24/7 Wall St. Price Target Summary
| Metric | Value |
|---|---|
| Current Price | $247.31 |
| 24/7 Wall St. Price Target | $318.02 |
| Upside | 28.59% |
| Recommendation | BUY |
| Confidence Level | 90% |
The Setup Heading Into Q2 Earnings
Amazon is up 7.14% year to date and 9.91% over the trailing year, trading roughly 11% below the $278.56 52-week high.
Q1 2026 was strong: EPS of $2.78 crushed the $1.73 estimate, and revenue rose 16.6% to $181.52 billion. AWS grew 28% to $37.59 billion, the fastest pace in 15 quarters, powered by Trainium commitments from OpenAI and Anthropic. Advertising climbed 24% and now runs above $70 billion TTM. Management guided Q2 revenue to $194 billion to $199 billion.

Why Bulls See A Breakout Ahead
The bull case rests on AWS. CEO Andy Jassy highlighted “our fastest growth in 15 quarters” and a chips business topped a $20 billion revenue run rate growing triple digits. Trainium2 is fully subscribed, OpenAI committed to 2 GW of Trainium capacity beginning 2027, and Anthropic secured up to 5 GW.
Advertising, AWS, and subscriptions drive margin mix higher. The analyst consensus target of $312.91 across 62 Buy, 4 Hold, and 0 Sell ratings aligns with our model. Our bull case points to $365.98 if AWS holds 28%+ growth and CapEx returns materialize faster.

What Could Go Wrong
The bear thesis centers on capital intensity. Amazon guided $200 billion in 2026 CapEx, and TTM free cash flow collapsed 95% to $1.2 billion. Long-term debt jumped to $119.1 billion from $65.6 billion YoY.
Q1 net income was inflated by $16.8 billion in pre-tax Anthropic gains, and AWS operating margin ticked down from 39.5% to 37.7%. Bulls counter that adjusted operating income grew 30% and OCF rose 53%, meaning the cash drag reflects investment spending. Our bear case scenario is $275.53.
How Amazon Compares To Microsoft And Alphabet
Microsoft (NASDAQ:MSFT) trades at a P/E of 29x with operating margin near 46% and Azure growing 40%. Microsoft’s richer margins make Amazon’s 11% consolidated operating margin look like a margin-expansion story.
Alphabet (NASDAQ:GOOGL) trades at a P/E of just 16x, roughly half Amazon’s multiple, with Google Cloud growing 63% in Q1 2026. Alphabet is the cheapest comp, but Amazon’s dominant retail flywheel plus AWS scale justifies the premium.
| Company | P/E | Operating Margin |
|---|---|---|
| Amazon | 34x | 11% |
| Microsoft | 29x | 46% |
| Alphabet | 16x | 32% |
I’d Buy It Here
I’d be a buyer if Q2 earnings on July 30 confirm AWS growth holding above 25% and Q3 revenue guidance clears consensus. I would stay on the sidelines if AWS decelerates below 24% or if management flags margin compression from tariff and energy costs.
The 24/7 Wall St. price target of $318.02 reflects a buy at 90% confidence, and the AWS AI backlog tips the scale. For readers hunting more names tied to this infrastructure wave, our 7 Stocks Powering the AI Boom report is worth reviewing.
| Year | 24/7 Wall St. Price Target |
|---|---|
| 2026 | $275 |
| 2027 | $318 |
| 2028 | $358 |
| 2029 | $403 |
| 2030 | $454 |
These projections assume Amazon executes on AWS AI monetization and CapEx converts to free cash flow by 2028. Significant upside could come from Trainium share gains against Nvidia, while recession or extended tariff war would compress the trajectory closer to our $345.19 five-year bear case.
Contact [email protected] for any questions or corrections.
Vandita Jadeja is a financial publisher with over a decade of experience writing about financial topics, including investment, savings, retirement, insurance and banking. Vandita is a Chartered Accountant who loves to debunk financial concepts for readers.
Her work has appeared on sites that include The Motley Fool, InvestorPlace, and Benzinga. She covers investing and focuses on stock picks and price prediction for 24/7 Wall St.
When not looking for the next stock investment opportunity, she can be found traveling, reading, chasing sunsets and enjoying her iced latte.