FDVV’s 2.8% yield hides tech mega-cap risk in dividend portfolio
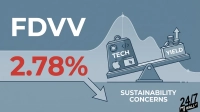
FDVV markets itself as a dividend ETF, but a quarter of its portfolio sits in tech giants that barely yield anything. Whether that tradeoff quietly undermines your income strategy depends on what is actually holding the distribution together.


The Fidelity High Dividend ETF (NYSEARCA:FDVV) pays a 2.8% trailing yield on $10.03 billion in assets, and the title’s 3.3% figure refers to the sector-tilt overlay Fidelity applies to reweight the portfolio toward higher-yielding equities. FDVV distributed $1.729 per share over the trailing twelve months across four quarterly payments, most recently $0.519 on June 23, 2026. The question for holders is whether that income stream is durable given how much of FDVV now sits in mega-cap tech rather than traditional yield sectors.
How FDVV Generates Its Income
This dividend-focused ETF tracks the Fidelity High Dividend Index, which starts with large- and mid-cap US stocks that pay above-average dividends and then applies a sector reweighting so that no single sector dominates purely because it yields the most. Rather than letting utilities and REITs swell to 30% of the fund, the index caps sector drift and redeploys capital into dividend payers inside technology, financials, and consumer staples. FDVV’s sector-balanced approach aims to provide diversified dividend exposure without overconcentration in traditional high-yield sectors.
The result is a portfolio of 112 holdings with an expense ratio of 0.15%. Technology sits at 26% and financials at 21%, with real estate contributing 9%. Income safety depends less on structural yield mechanics and more on the fundamentals of a concentrated set of large positions.
The Holdings That Drive the Distribution
Apple (NASDAQ:AAPL | AAPL Price Prediction) is FDVV’s largest single position at 6%. Apple sits in the fund for reasons beyond its yield of 0.31%. Coverage is the relevant metric: Apple pays $1.04 annually against $8.24 in diluted trailing EPS, leaving a payout ratio near 13%. Q2 FY26 operating cash flow of $53.92 billion and a fresh $100 billion buyback authorization mean the dividend is effectively an afterthought against Apple’s cash generation.
Broadcom at 3% shows similar coverage. The $0.65 quarterly dividend is trivial against Q2 FY26 free cash flow of $10.26 billion, roughly 60% of revenue. AI semiconductor revenue grew 143% year over year in the quarter, and management guided Q3 FY26 revenue to $29.4 billion. The dividend is safe; the risk is valuation, with the stock down 8% in the past month.
Coca-Cola at 2% is the classic dividend anchor. The quarterly payment rose from $0.51 in 2025 to $0.53 in 2026, extending a streak of annual increases back to 1999. A yield of 2.5%, net margin of 28%, and 2026 free cash flow guided near $12.2 billion mean the payout is covered several times over.
Duke Energy at 1% is the regulated-utility ballast. The quarterly dividend of $1.065 is supported by regulated cash flow, and 2026 adjusted EPS guidance of $6.55 to $6.80 comfortably covers the $4.24 annual dividend. Operating cash flow fell 31% in Q1 on higher interest expense, and utility leverage remains elevated. The dividend is safe within a normal rate-case environment.
Total Return and Distribution Trend
Weighing FDVV’s Income Durability
Contact [email protected] for any questions or corrections.
David Beren has been a Flywheel Publishing contributor since 2022. Writing for 24/7 Wall St. since 2023, David loves to write about topics of all shapes and sizes. As a technology expert, David focuses heavily on consumer electronics brands, automobiles, and general technology. He has previously written for LifeWire, formerly About.com. As a part-time freelance writer, David’s “day job” has been working on and leading social media for multiple Fortune 100 brands. David loves the flexibility of this field and its ability to reach customers exactly where they like to spend their time. Additionally, David previously published his own blog, TmoNews.com, which reached 3 million readers in its first year. In addition to freelance and social media work, David loves to spend time with his family and children and relive the glory days of video game consoles by playing any retro game console he can get his hands on.