Can Amazon Continue Its Rally? Analysts Weigh In
Amazon has shed 6% in a week while sitting on the most aggressive capital spending in its history, yet Wall Street still sees a breakout coming. Here is what makes or breaks that case before July 30.


After a choppy summer, Amazon (NASDAQ:AMZN | AMZN Price Prediction) is trading at $232.11, down 6.12% over the past week yet still holding a razor-thin 0.56% year-to-date gain. The rally that carried shares to $278.56 earlier this year has cooled. Our proprietary model says the next leg is up.
The 24/7 Wall St. price target for Amazon is $307.53, implying 32.49% upside over the next 12 months. Our recommendation is buy, with a confidence level of 90%.
AWS reacceleration, a $70 billion advertising business, and a custom silicon franchise running at a $20 billion clip make the risk/reward attractive.

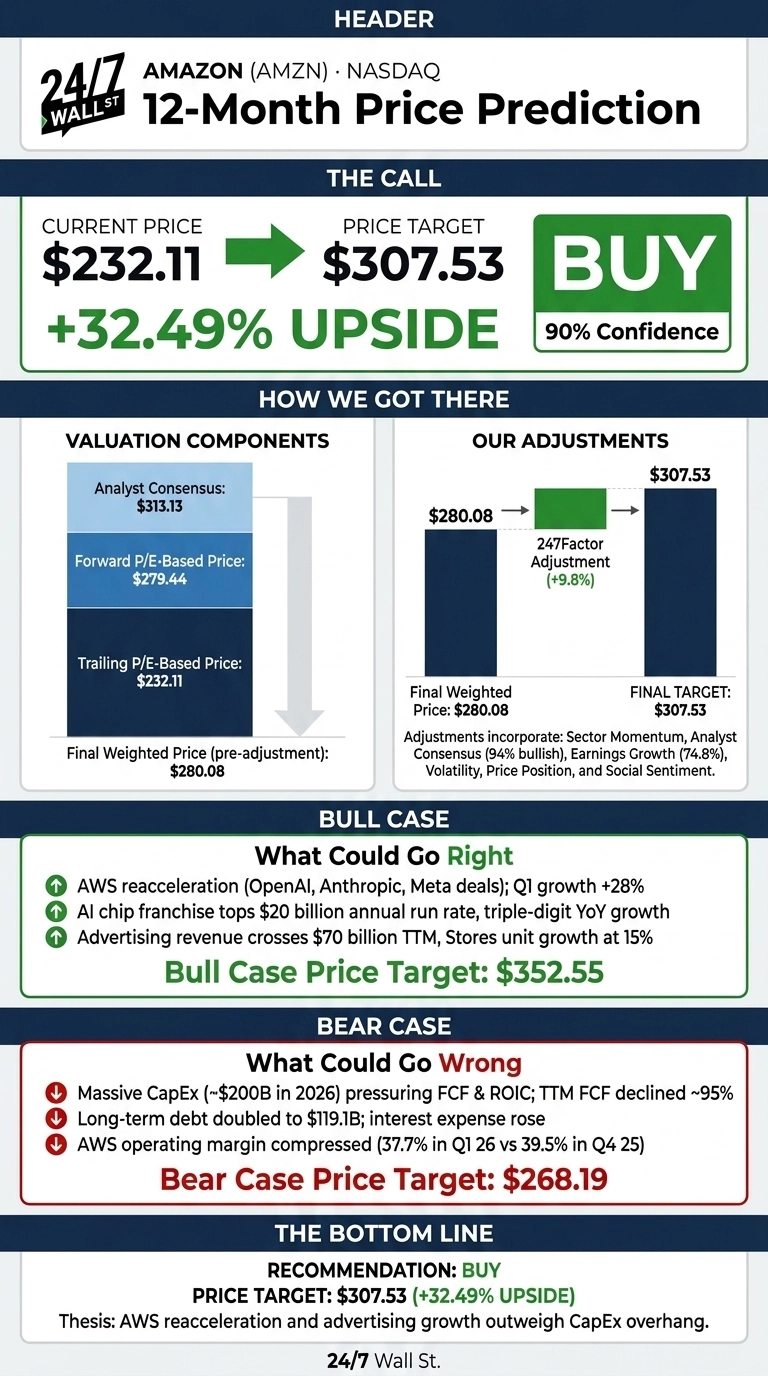
24/7 Wall St. Price Target Summary
| Metric | Value |
|---|---|
| Current Price | $232.11 |
| 24/7 Wall St. Price Target | $307.53 |
| Upside | 32.49% |
| Recommendation | BUY |
| Confidence Level | 90% |
A Summer Pullback Inside a Bigger Rally
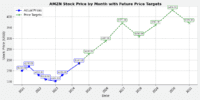
Amazon is roughly flat over one year (-0.05%) and down 0.92% over the past month, sitting about 12% off the 52-week high of $278.56 and well above the low of $196.
The pullback follows a blowout Q1 FY26 report where EPS of $2.78 beat the $1.73 consensus by 60.69%, revenue climbed 16.6% to $181.52 billion, and AWS grew 28%, its fastest pace in 15 quarters. Prediction markets on Polymarket assign a 91.5% probability that Amazon beats when it reports on July 30.
Why Bulls See a Breakout Ahead
The bull case rests on AWS converting AI hype into contracted revenue. OpenAI committed to roughly 2 GW of Trainium capacity beginning 2027, Anthropic secured up to 5 GW, and Amazon’s chips business is now a $20 billion annualized franchise growing triple digits.
Advertising crossed $70 billion TTM, and unit growth in Stores hit 15%, the highest since COVID. CEO Andy Jassy noted “We’re in the middle of some of the biggest inflections of our lifetime, we’re well positioned to lead.” If AWS holds 28% growth and margins stabilize, the bull-case path to $352.55 is achievable.
What Could Go Wrong
The bear case centers on capital intensity. Amazon has guided to roughly $200 billion of CapEx in 2026, with Q1 alone consuming $44.2 billion, up 76.68% YoY. TTM free cash flow collapsed roughly 95% to $1.2 billion, long-term debt doubled to $119.1 billion, and AWS margin slipped to 37.7% from 39.5%.
Q1 net income was also flattered by a $16.80 billion Anthropic mark-to-market. Bulls counter that this spend funds Trainium2, Project Rainier, and 1 million-plus NVIDIA GPUs, all converting to contracted AWS revenue. A bear-case rerating gets us to $268.19.
How Amazon Compares to Microsoft and Walmart
Microsoft (NASDAQ:MSFT) is the natural cloud comp. Azure grew 40% last quarter versus AWS at 28%, but Microsoft trades at a trailing P/E of 28, on top of Amazon’s 28. Similar multiples for slower AWS growth make our target reasonable.
Walmart (NYSE:WMT) anchors the retail side. Walmart trades at a trailing P/E of 40 on FY26 revenue of $713 billion and mid-single-digit growth, while Amazon grows retail units at 15% and has AWS and advertising on top. Amazon at 28x forward looks cheap next to Walmart at 40x.
| Company | Trailing P/E | Latest Revenue Growth |
|---|---|---|
| Amazon | 28 | 16.6% |
| Microsoft | 28 | 18.3% |
| Walmart | 40 | 6.1% |
I’d Buy It Here
The 24/7 Wall St. price target of $307.53 and buy rating reflect a 90% confidence read that AWS reacceleration and the ad flywheel outweigh the CapEx overhang.
I’d add here if the July 30 earnings report confirms AWS growth in the high-20s and Q3 guidance lands near the high end. I’d stay patient if AWS growth decelerates below 25% or operating income guidance falls short of $22 billion.
| Year | 24/7 Wall St. Price Target |
|---|---|
| 2026 | $276 |
| 2027 | $307 |
| 2028 | $377 |
| 2029 | $427 |
| 2030 | $486 |
These projections assume Amazon executes on its AI infrastructure buildout and preserves AWS margins near 35%. Significant upside or downside could come from AWS margin trajectory, tariff policy, and how quickly OpenAI and Anthropic capacity ramps.
Contact [email protected] for any questions or corrections.
Vandita Jadeja is a financial publisher with over a decade of experience writing about financial topics, including investment, savings, retirement, insurance and banking. Vandita is a Chartered Accountant who loves to debunk financial concepts for readers.
Her work has appeared on sites that include The Motley Fool, InvestorPlace, and Benzinga. She covers investing and focuses on stock picks and price prediction for 24/7 Wall St.
When not looking for the next stock investment opportunity, she can be found traveling, reading, chasing sunsets and enjoying her iced latte.