Johnson & Johnson Is Near a Record High. Is There Still Room to Run?
Johnson and Johnson has surged over 54% in a year, cleared a major FDA hurdle, and raised its guidance, yet something about the current setup gives pause before hitting buy.


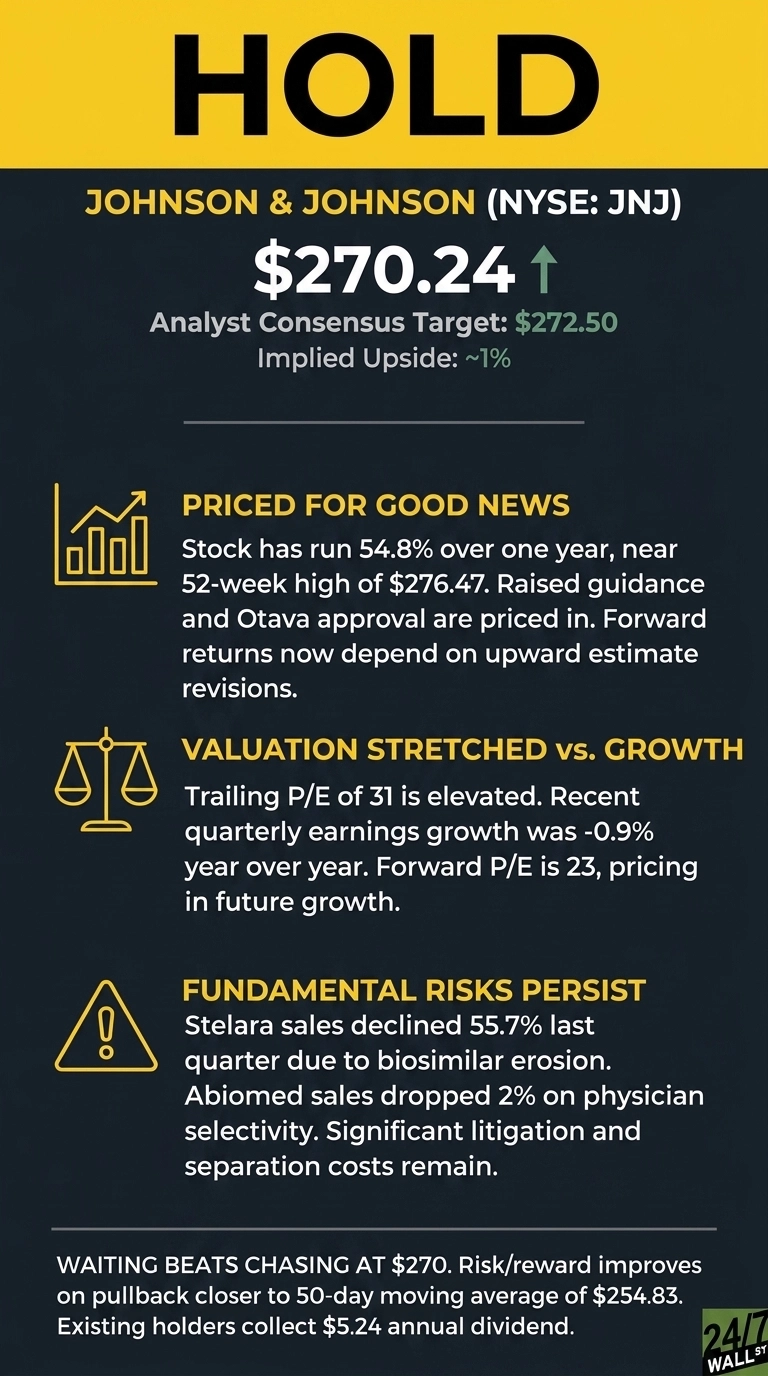
At $270.24, Johnson & Johnson (NYSE:JNJ | JNJ Price Prediction) is a hold. The stock has run to within striking distance of its 52-week high of $276.47 after a raised guide and robotics approval, and the setup at this price deserves careful consideration rather than a reflexive chase.
Johnson & Johnson is a diversified healthcare giant split across Innovative Medicine and MedTech, with 28 products and platforms each generating more than $1 billion in annual sales. The stock has gained 32.04% year to date, driven by oncology strength, immunology launches, and defensive rotation into large-cap pharma.

Why JNJ Broke Out in 2026
Two forces drove the stock here. Management raised full-year guidance to operational sales growth of 6.5% to 7.1% and adjusted operational EPS of $11.50 to $11.65.
The FDA cleared the Otava robotic surgical system, giving MedTech a new growth engine alongside the DePuy Synthes separation slated for mid-2027.
Bull Case: A Post-Stelara Growth Story With Real Catalysts
Ex-Stelara, the business is growing double digits. Q2 delivered worldwide sales of $25.3 billion, up 5.6% operationally, absorbing a 460 basis point headwind from Stelara. Darzalex sales exceeded $4 billion, Tremfya grew 71%, and Carvykti expanded 47.7%.
Valuation looks full in absolute terms, yet the forward P/E of 23 is reasonable for a company targeting double-digit growth by the end of the decade. Add 64 consecutive years of dividend increases, a 1.96% yield, and a beta of 0.231, and JNJ is a rare defensive compounder in an expensive market.
Bear Case: The Easy Money Has Been Made
JNJ has already returned 54.8% over one year, and shares now trade essentially at analyst consensus. The trailing P/E of 31 is elevated for a company that just posted quarterly earnings growth of -0.9% year over year.
Fundamental risks remain. Stelara declined 55.7% last quarter, Abiomed dropped 2% on physician selectivity, and litigation and separation costs contributed to a net expense of $331 million in other income. Talc overhang and tariff exposure persist.
Hold Case: Priced for the Good News
The bull thesis is intact, but the entry point is not. With the stock at analyst consensus, upside compression is the base case until the second-half acceleration management promised materializes. Q1 free cash flow of $1.5B, down 55.42%, is worth watching against the full-year target approaching $21 billion.
Numbers Behind the Verdict
JNJ currently trades at $270.24 against an analyst target of $272.50, implying roughly 1% upside from a consensus of 23 analysts. Targets are one data point, not a guarantee.
The ratings breakdown skews constructive:
- 5 Strong Buy
- 11 Buy
- 6 Hold
- 1 Sell
Performance tells the tension: JNJ has gained 32.04% year to date versus 12.29% for the S&P 500, on a trailing P/E of 31 and forward P/E of 23.

Why Waiting Beats Chasing at $270
At $270.24, Johnson & Johnson is a hold.
The stock has priced in the raised guide, Otava approval, and ex-Stelara growth story. With shares at consensus targets after a 54.8% one-year run, forward returns depend on upward estimate revisions rather than further multiple expansion. That is a higher bar than the market usually pays for.

The buy trigger is straightforward: a clean Q3 with MedTech reacceleration, continued Tremfya and oncology momentum, and evidence that Stelara erosion is stabilizing. The sell trigger is equally clear: a litigation shock, a MedTech miss, or a delayed DePuy Synthes separation that raises execution risk.
Existing holders continue to collect the $5.24 annual dividend. Risk/reward improves on a pullback closer to the 50-day moving average of $254.83. At record highs with 1% implied upside, patience is the edge.
Contact [email protected] for any questions or corrections.
Vandita Jadeja is a financial publisher with over a decade of experience writing about financial topics, including investment, savings, retirement, insurance and banking. Vandita is a Chartered Accountant who loves to debunk financial concepts for readers.
Her work has appeared on sites that include The Motley Fool, InvestorPlace, and Benzinga. She covers investing and focuses on stock picks and price prediction for 24/7 Wall St.
When not looking for the next stock investment opportunity, she can be found traveling, reading, chasing sunsets and enjoying her iced latte.