This post may contain links from our sponsors and affiliates, and Flywheel Publishing may receive compensation for actions taken through them.
Live coverage has ended. The full story is below.
Salesforce (NYSE:CRM | CRM Price Prediction) is expected to report Q2 FY27 earnings today at 4:00 PM ET after the market closes. With shares at $205.06 and down 21.95% year to date, the report will shed light on whether Agentforce can drive the promised second-half reacceleration.
Rally Meets a Reacceleration Test
Last quarter, Salesforce delivered $11.13 billion in revenue, up 13.27% year over year, and EPS of $3.88, a 24.08% beat. Non-GAAP operating margin reached 34.8%, up 250 basis points, and cRPO climbed to $33.6 billion.
The stock fell 16.31% over the past year and has traded flat today. CFO Robin Washington told investors first-half net new AOV growth would outpace AOV growth and drive organic revenue reacceleration in the second half of FY27.
Consensus Estimates
| Metric |
Q2 FY27 Guide |
YoY Change |
FY27 Guide |
FY30 Target |
| Revenue |
$11.27B-$11.35B |
+10%-11% |
$45.9B-$46.2B |
$63B |
| EPS (Non-GAAP) |
$3.25-$3.27 |
Flat to slight |
$14.06-$14.12 |
n/a |
Growth includes slightly above 4 points from Informatica, meaning organic growth remains mid-single digits. Non-GAAP operating margin is guided at 34.3%, a discipline metric investors will scrutinize alongside AI spend.
Agentforce, Margins, and Backlog Take Center Stage
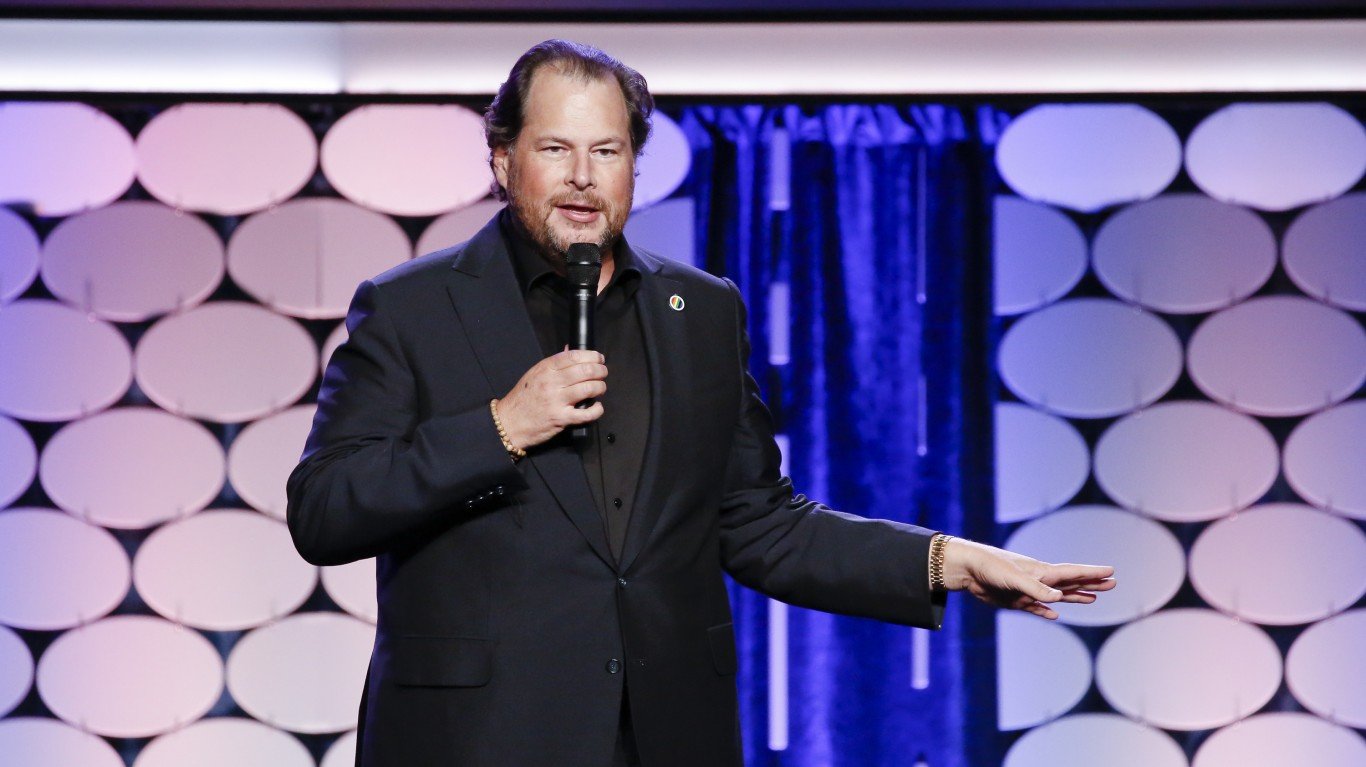
Tonight, I’ll be watching Agentforce ARR closely. It hit $1.2 billion, up 205% year over year, with combined AI and data ARR at $3.4 billion. Sustaining triple-digit growth here validates Marc Benioff’s claim that “Agentic AI is the biggest growth opportunity for our customers, and for Salesforce.”
Analysts will also be watching cRPO. Management guided for Q2 growth of approximately 13% in constant currency, the cleanest leading indicator of the second-half reacceleration story. I’ll also track Informatica’s contribution after its $444 million Q1 haul, and whether weakness in marketing, commerce, and Tableau deepens.
Tonight, free cash flow matters more than usual. The $25 billion accelerated share repurchase lifted noncurrent debt to $39.3 billion from $10.4 billion, pressuring interest expense. Management guided FCF growth of just 4-5%. Any slippage narrows the payoff from the buyback. Polymarket traders assign a 94.5% probability of an EPS beat, so the setup favors bulls but leaves little room for a subscription miss.
Earnings History
| Quarter |
EPS Surprise |
Day-of Move |
1-Day Move |
1-Week Move |
| Q1 FY27 |
+24.08% |
-0.75% |
+8.47% |
+7.14% |
| Q4 FY26 |
+24.91% |
+4.03% |
-2.35% |
+0.96% |
| Q3 FY26 |
+13.57% |
+3.66% |
+5.30% |
+6.02% |
| Q2 FY26 |
+4.71% |
-4.85% |
+2.77% |
+0.93% |
On average, shares moved 1.23% seven days after earnings over the past year.
Contact [email protected] for any questions or corrections.