Prediction: Intel Stock Could Have a Major Catalyst Ahead
Intel has staged one of the most dramatic reversals in semiconductor history, but the real question is whether the forces driving its comeback can hold long enough to justify where the stock sits today.


Intel (NASDAQ:INTC | INTC Price Prediction) closed at $89.51 on August 31, 2026, up 267.6% over the past year on the back of an Intel 18A ramp, an NVIDIA equity investment, and a data center business with AI momentum.
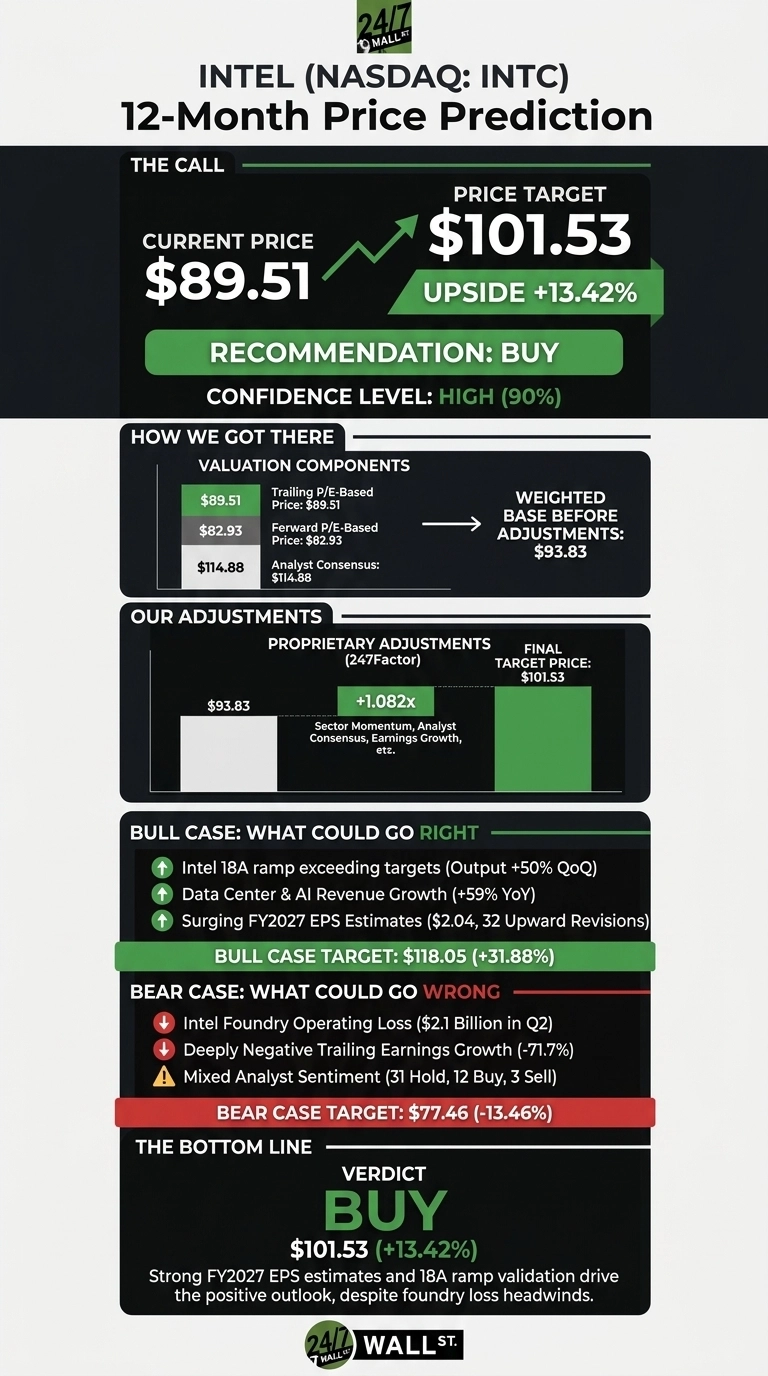
Our 24/7 Wall St. price target for Intel is $101.53, pointing to upside from here, with a buy recommendation and high model confidence.

24/7 Wall St. Price Target Summary
| Metric | Value |
|---|---|
| Current Price | $89.51 |
| 24/7 Wall St. Price Target | $101.53 |
| Upside | 13.42% |
| Recommendation | BUY |
| Confidence Level | 90% |
A Comeback Story Backed by Real Numbers
Intel has surged in 2026, up 142.57% year to date and trading roughly 19% off its 52-week high of $142.35. Q2 2026 was the inflection point.
Revenue of $16.13 billion grew 25.42% year over year and beat consensus by 11.64%, while non-GAAP EPS of $0.42 exceeded the $0.22 estimate. CEO Lip-Bu Tan called it “the strongest revenue growth in more than 15 years.” Data Center and AI revenue jumped 59% to $6.26 billion. The next earnings report is scheduled for October 26, 2026, a near-term catalyst.

Bull Case for Intel
Intel Foundry revenue grew 31% in Q2 with 18A output at “approximately 25% above target and up more than 50% quarter-over-quarter.” Panther Lake SKU costs are down roughly 50% year to date.
Tan said “Strong demand for our products continue to outpace our growing supply” and pegged the ASIC opportunity at over $100 billion (the same buildout thesis behind the power, cooling, and networking suppliers we profiled in a free AI infrastructure report).
FY2027 EPS consensus has surged to $2.04 from $1.51 ninety days ago, with 32 upward revisions in the trailing 30 days. Our bull case scenario lands at $118.05, a 31.88% return.

What Could Go Wrong
Intel Foundry posted a Q2 operating loss of $2.1 billion. Trailing earnings growth is deeply negative at -71.7% year over year, and the forward P/E of 72 leaves no margin for error. Analyst sentiment remains mixed: 31 Hold, 12 Buy, and 3 Sell or Strong Sell ratings.
A CHIPS Act escrow mark-to-market produced an $11 billion reported net loss in Q2. Bulls note this is a non-cash charge tied to government equity mechanics, with non-GAAP operating margin expanding to 17.2%. Our bear case is $77.46.

How Intel Compares to NVIDIA and AMD
NVIDIA (NASDAQ:NVDA) is the AI compute benchmark and Intel’s largest partner via a $5 billion equity investment. NVIDIA’s Q2 FY27 revenue of $96.22 billion grew 105.8% with operating margin near 60%, versus Intel’s low single-digit non-GAAP operating margin. NVIDIA trades at a P/E of 44, meaningfully lower than Intel’s forward P/E of 72.
AMD (NASDAQ:AMD) is the direct x86 competitor. AMD posted Q2 2026 revenue of $11.54 billion, up 50.1%, with gross margins of 56% and a P/E of 177. Against that pair, Intel’s turnaround optionality plus a lower relative multiple on 2027 estimates makes our $101.53 target reasonable.
| Company | P/E | Gross Margin |
|---|---|---|
| Intel | 72 (fwd) | 34.8% |
| NVIDIA | 44 | 71.1% |
| AMD | 177 | 49.5% |
Verdict Heading Into October Earnings
Buy, with the 24/7 Wall St. price target at $101.53 and 90% model confidence. The surge in FY2027 EPS estimates paired with 18A ramp validation tips the scale.
The bull thesis rests on foundry losses narrowing meaningfully by mid-2027, while skeptics may argue the forward multiple already prices in perfection.
| Year | 24/7 Wall St. Price Target |
|---|---|
| 2026 | $101.53 |
| 2027 | $110 |
| 2028 | $120 |
| 2029 | $128 |
| 2030 | $136.81 |
These projections assume Intel continues executing on 18A and foundry customer wins. Significant upside or downside could come from an external foundry breakthrough or a pause of the 14A roadmap.
Contact [email protected] for any questions or corrections.
Vandita Jadeja is a financial publisher with over a decade of experience writing about financial topics, including investment, savings, retirement, insurance and banking. Vandita is a Chartered Accountant who loves to debunk financial concepts for readers.
Her work has appeared on sites that include The Motley Fool, InvestorPlace, and Benzinga. She covers investing and focuses on stock picks and price prediction for 24/7 Wall St.
When not looking for the next stock investment opportunity, she can be found traveling, reading, chasing sunsets and enjoying her iced latte.