Intel’s Best Growth in 15 Years: 25% Revenue Surge and Our New Price Target
Intel just posted its strongest revenue growth in over 15 years, yet shares sit more than 30% below their recent peak after a massive stock offering rattled investors. Whether that gap is a buying opportunity or a warning sign depends…


Intel (NASDAQ: INTC | INTC Price Prediction) posted 25.42% year-over-year revenue growth in Q2 2026, its strongest top-line result in more than 15 years, powered by a 59% surge in Data Center and AI revenue. With shares at $97.71 after a sharp pullback from June highs, the setup for the next 12 months is constructive but not spectacular.
Our 24/7 Wall St. price target for Intel is $107.66, implying 10.19% upside from current levels. The recommendation is buy at 90% confidence.

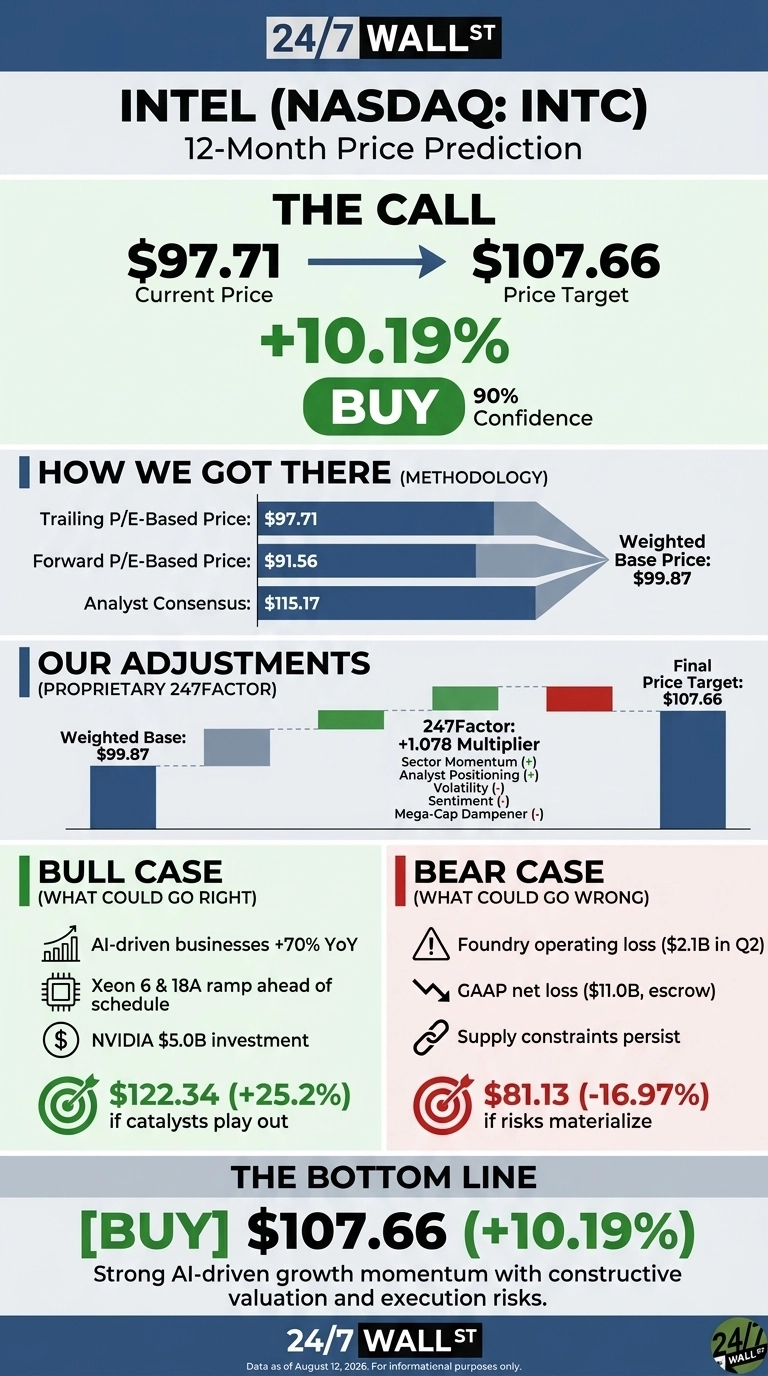
24/7 Wall St. Price Target Summary
| Metric | Value |
|---|---|
| Current Price | $97.71 |
| 24/7 Wall St. Price Target | $107.66 |
| Upside | 10.19% |
| Recommendation | BUY |
| Confidence Level | 90% |
A Vertical Rally, Then a Cooling Off
INTC is up 164.8% year to date and 373.17% over the past year, moving from $20.65 last August to a 52-week high of $142.35 before cooling. Shares are down 11.04% over the past month, weighed on by a proposed $15 billion common stock offering announced in August. That capital raise funds a CapEx plan CFO David Zinsner said is being pushed above “more than $20 billion” for 2026.
Q2 was the seventh consecutive earnings beat. Revenue of $16.128 billion topped the $14.446 billion consensus, and non-GAAP EPS of $0.42 nearly doubled the $0.2166 estimate. AI-driven businesses collectively grew more than 70% year over year.
The Bull Case
Our bull scenario points to $122.34, a 25.2% gain. Xeon 6 is one of the fastest-ramping products in Intel history, Intel 18A yields are running ahead of schedule, and CEO Lip-Bu Tan said “strong demand for our products continues to outpace our growing supply.”
Purpose-built silicon and design services are approaching a $2 billion run rate against what management frames as a $100 billion TAM. NVIDIA (NASDAQ: NVDA) made a $5 billion equity investment and the DGX Rubin NVL8 CPU win validate the roadmap. Consensus target from 45 analysts sits at $115.17, with 14 Buy ratings against 3 Sells.
The Risks Worth Watching
Our bear case lands at $81.13, a 16.97% drawdown. Intel Foundry burned a $2.1 billion operating loss in Q2 despite 31% revenue growth, and the GAAP net loss of $11.033 billion was driven by a $12.5 billion mark-to-market on CHIPS Act escrow shares.
The loss is non-cash, and operating cash flow of $7.006 billion shows the underlying business is throwing off real money. The forward P/E of 80 leaves little room for execution slips at 18A-P or 14A.
How Intel Compares to AMD and Taiwan Semiconductor
AMD (NASDAQ: AMD) is the sharpest read on Intel’s core CPU market. It posted Q2 2026 revenue of $11.54 billion, up 50.1%, with Data Center more than doubling. AMD trades at a TTM P/E of roughly 176. Intel’s forward multiple of 80 looks reasonable next to that, particularly given INTC’s foundry optionality.
Taiwan Semiconductor (NYSE: TSM) is the foundry benchmark. TSMC’s Q2 revenue rose 36% at 67.7% gross margins, dwarfing Intel Foundry’s external revenue of $293 million. The gap explains why our target does not credit a full foundry re-rating yet. If Intel 14A lands an anchor customer, the peer comparison shifts materially in INTC’s favor.
Intel Price Prediction 2026-2030
The recent weakness sets up a path toward the 24/7 Wall St. price target of $107.66, with the analyst consensus of $115.17 as a stretch level.
The risk/reward tilts less favorable if shares revisit the June peak of $127.86 without a 14A anchor customer announcement, and the thesis weakens materially if foundry losses widen.
| Year | 24/7 Wall St. Price Target |
|---|---|
| 2026 | $107.66 |
| 2027 | $118.00 |
| 2028 | $127.00 |
| 2029 | $134.00 |
| 2030 | $139.48 |
These projections assume Intel executes on its 18A ramp and secures external 14A customers by 2028. Significant upside could come from a foundry re-rating, while a stalled 14A program would push the trajectory toward our $80.73 five-year bear case.
Contact [email protected] for any questions or corrections.
Vandita Jadeja is a financial publisher with over a decade of experience writing about financial topics, including investment, savings, retirement, insurance and banking. Vandita is a Chartered Accountant who loves to debunk financial concepts for readers.
Her work has appeared on sites that include The Motley Fool, InvestorPlace, and Benzinga. She covers investing and focuses on stock picks and price prediction for 24/7 Wall St.
When not looking for the next stock investment opportunity, she can be found traveling, reading, chasing sunsets and enjoying her iced latte.