Intel’s Price Targets Reveal Just How Much Is Riding on Its Turnaround
Intel has staged one of the most dramatic stock reversals in recent memory, but our proprietary model says the rally has outrun reality. Here is what needs to happen for the thesis to actually work.


Few large-cap turnarounds carry as much weight for the U.S. semiconductor industry as Intel’s. Intel (NASDAQ:INTC | INTC Price Prediction) has rallied on a custom NVLink product partnership with NVIDIA, a fresh SoftBank stake, and a U.S. government equity position, layered onto execution progress under CEO Lip-Bu Tan. Our proprietary model says the rally has run ahead of fundamentals.
Our 24/7 Wall St. price target for Intel is $96.79, which implies roughly 10.9% downside from a current price of $123.33. The recommendation is hold, with a confidence level of 90%.
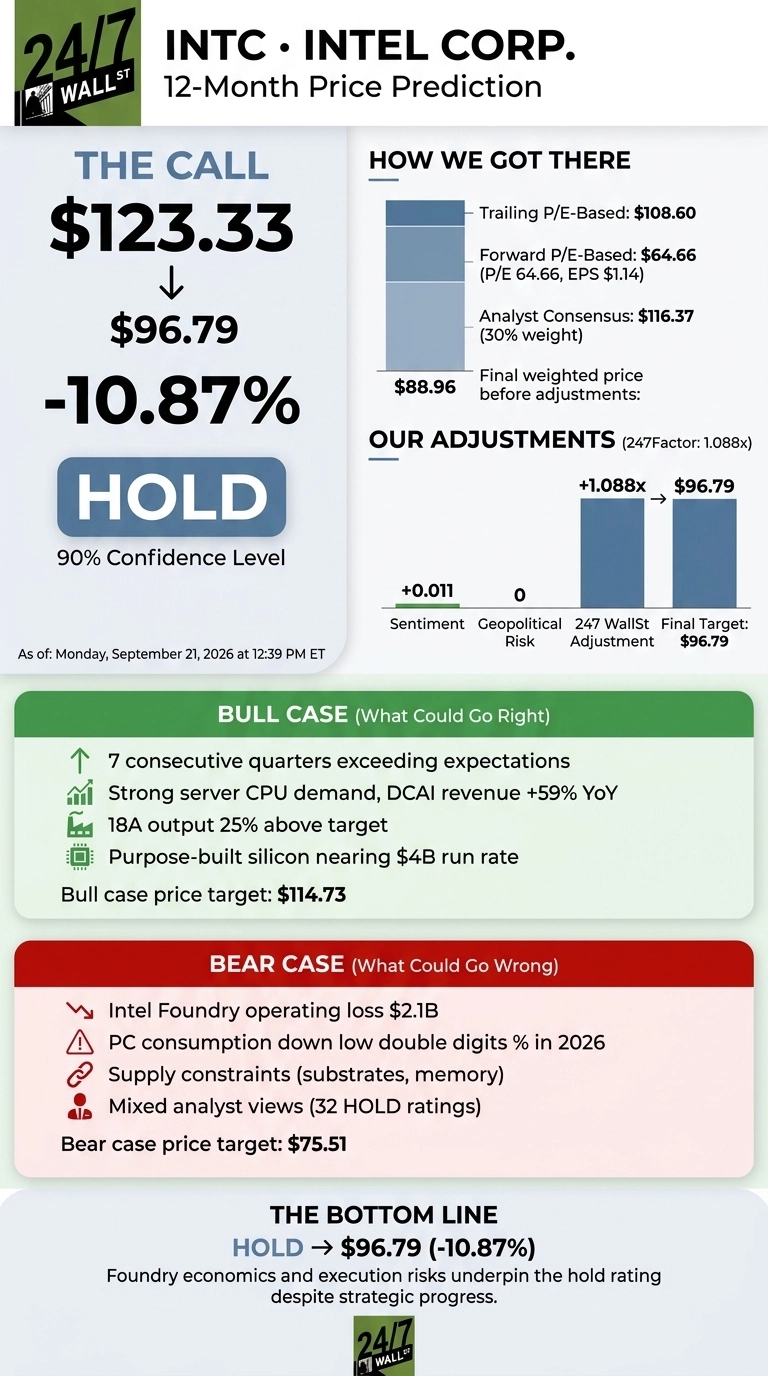

24/7 Wall St. Price Target Summary
| Metric | Value |
|---|---|
| Current Price | $123.33 |
| 24/7 Wall St. Price Target | $96.79 |
| Upside/Downside | -10.87% |
| Recommendation | HOLD |
| Confidence Level | 90% |
Why We Could Be Wrong
Our 24/7 Wall St. price target sits below where Intel trades today. INTC is one of the most divisive names in the market, and real value could come from an accelerated Intel 14A external customer signing or a step-function ramp in the nearly $2 billion run-rate ASIC business. A detailed bull case follows outlining why Intel could outperform the model.
A 300% Rally Meets an AI Compute Story
Intel has been one of the year’s most dramatic reversals. Shares are up 19.81% in the past week, 32.9% in the past month, and 234.23% year-to-date, with the one-year gain now at 303.43%.
Monday’s move was fueled by a chip rally triggered by Meta’s Muse AI agent. Fundamentals are cooperating too: Q2 revenue of $16.13 billion grew 25.4% year over year, beating consensus by 11.64%, and non-GAAP EPS of $0.42 came in 93.10% ahead of the $0.2175 estimate. Data Center and AI revenue grew 59%.

Why Bulls See a Breakout to $140+
The bull case leans on Tan’s assertion that Q2 was “the seventh consecutive quarter of exceeding our financial expectations” and that 18A output ran 25% above target. Bulls point to a bull-case scenario price of $114.73 over one year and $137.13 over five, plus a five-year path high of $140.74.
The purpose-built silicon franchise is targeting a $4 billion run rate, and Tan flagged an ASIC opportunity “over 100 billion”. A single blue-chip 14A foundry win could reprice the equity.
What Could Go Wrong
The bear case is straightforward: Intel Foundry posted a $2.1 billion operating loss in Q2, GAAP results absorbed a $12.53 billion non-cash CHIPS Act escrow charge, and management guided PC consumption down low double digits percent for all of 2026.
The bear-case scenario price is $75.51. Bulls counter that the escrow charge is non-cash and foundry loss narrowed by $348 million quarter over quarter. Of 48 analysts tracked, 32 rate INTC Hold.

How Intel Compares to AMD, NVIDIA, and TSMC
Advanced Micro Devices (NASDAQ:AMD) trades at a P/E of 211 with a $997.85 billion market cap. Data Center revenue grew 107% year over year. AMD’s 56% non-GAAP gross margin towers over Intel’s, making the 24/7 Wall St. price target look reasonable.
NVIDIA (NASDAQ:NVDA) is Intel’s AI compute benchmark and new $5 billion equity partner. NVIDIA carries a P/E of 45 on 60% operating margins. Intel’s economics are nowhere near.
Taiwan Semiconductor (NYSE:TSM) sets the foundry bar. Q2 gross margin was 67.7% and August revenue grew 53.3% year over year. Intel Foundry is still losing billions per quarter, reinforcing the model’s discount.
Intel Price Prediction 2026 to 2030
My 24/7 Wall St. price target for Intel is $96.79, the recommendation is hold, and confidence is 90%.
The tipping factor is foundry economics: the strategic story is real, but the P&L is not there yet. I’d be a buyer if Intel announces a marquee 14A external customer with volume commitments. I’d stay on the sidelines if the next earnings report shows foundry losses widening.
| Year | 24/7 Wall St. Price Target |
|---|---|
| 2026 | $104 |
| 2027 | $97 |
| 2028 | $89 |
| 2029 | $96 |
| 2030 | $97 |
Contact [email protected] for any questions or corrections.
Vandita Jadeja is a financial publisher with over a decade of experience writing about financial topics, including investment, savings, retirement, insurance and banking. Vandita is a Chartered Accountant who loves to debunk financial concepts for readers.
Her work has appeared on sites that include The Motley Fool, InvestorPlace, and Benzinga. She covers investing and focuses on stock picks and price prediction for 24/7 Wall St.
When not looking for the next stock investment opportunity, she can be found traveling, reading, chasing sunsets and enjoying her iced latte.