Everyone Is Watching $100 Oil While Copper Miners Are Getting Crushed
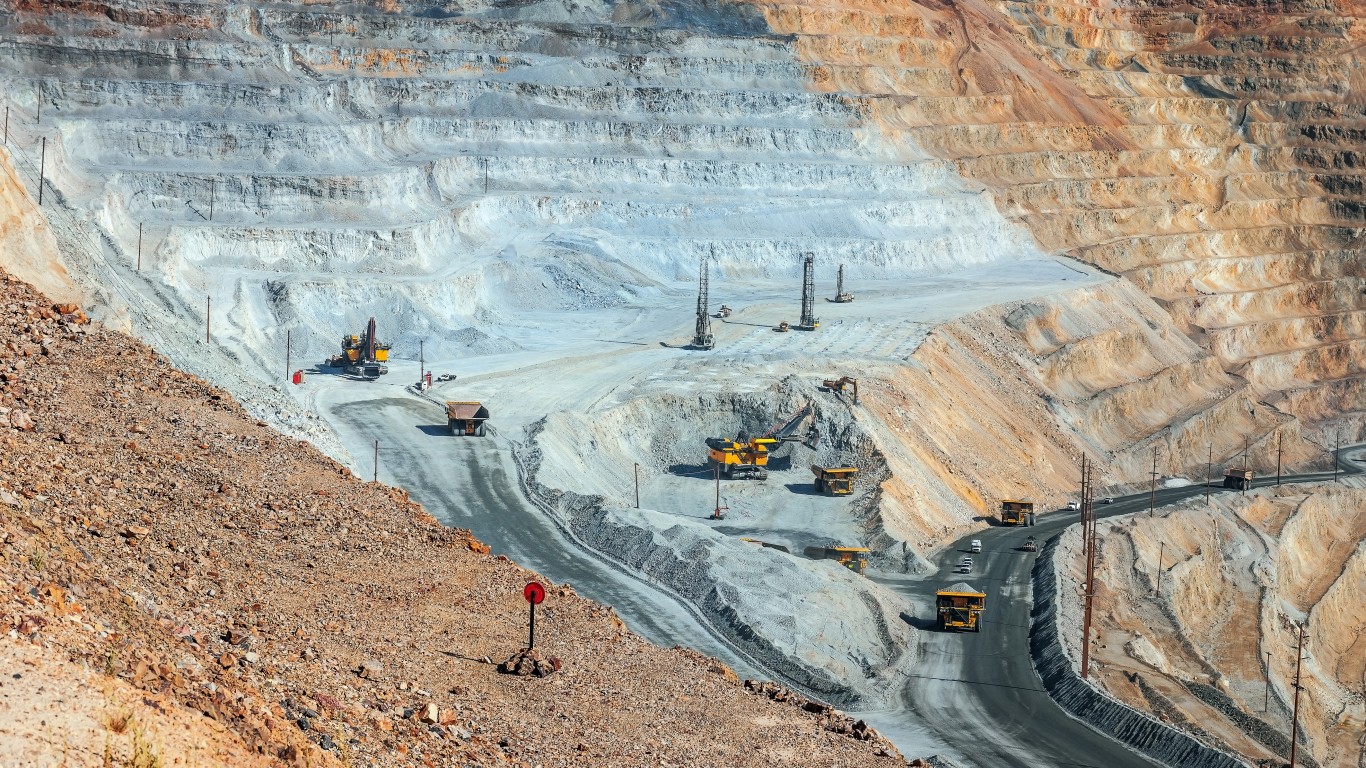
Copper miners are quietly getting crushed while traders fixate on oil, and the selloff spreading across the entire complex may be signaling something far more consequential for the real economy than crude ever could.

While oil headlines dominate trading, copper miners are quietly taking a beating. Freeport-McMoRan (NYSE:FCX | FCX Price Prediction) is off over 6% in Thursday’s session to just over $71, extending a 4% slide over the past week. The rest of the copper complex is bleeding in sympathy, and it is happening on a day when investors are watching crude, not concentrate.
Copper Selloff Runs Deep as the Metal Rolls Over
Copper prices are pulling back, and copper equities are geared to that price. Every 10 cents per pound swing at the metal level roughly translates to $390 million in annual EBITDA for Freeport in the 2027 to 2028 window, per management’s own sensitivity math. That is the leverage. When the underlying commodity moves a few percent, producer earnings estimates and the equities that discount them can move several multiples of that.
LME copper had been on a tear, averaging $6.05 per pound in the second quarter, up roughly 40% year over year, with Freeport realizing $5.78 per pound in the first quarter of 2026 versus $4.44 a year earlier. On the July call, Freeport’s chief executive Kathleen Quirk noted copper had closed at $6.30 per pound on the LME, an increase of about 12% since the start of the year, with visible inventories in China continuing to draw to multi-year lows. When the setup is that tight and positioning is that long, a give-back in the metal hits the equities hard.
Today looks like exactly that. It is one session, and the broader trend is still intact. Freeport is up 39.83% year to date and up 62.39% over the past year. Calling this a regime change would be premature. Calling it a warning shot for anyone who thought the copper trade was a one-way bet is fair.

Selloff Sweeps the Copper Complex
The pain is broad. Southern Copper (NYSE:SCCO), the largest name in the group at roughly $166 billion in market cap, is down 6% today and more than 3.5% over the past week. Teck Resources (NYSE:TECK) is off nearly 7% in the session. Hudbay Minerals (NYSE:HBM) has dropped over 7%, and Brazil-focused Ero Copper (NYSE:ERO) is down closer to 8%, giving back a week that had otherwise been positive.
Meanwhile the crude tape is telling a different story. WTI has climbed from $76.78 on August 5 to $91.48 on September 1. That is where the financial press is looking. The copper move is arguably the more consequential signal for the real economy.
Why? Because copper is a physical input to grid buildout, data center construction, EVs, and housing. Freeport’s own commentary describes “robust copper demand and order books associated with AI data centers and related energy infrastructure“. Federal research on data centers similarly identifies them as the largest driver of U.S. electricity demand growth (the copper miners are one slice of that buildout; we mapped seven other non-chip AI infrastructure suppliers in a free report here). When copper wobbles, it can be signaling softness in one of those inputs, or it can be positioning unwind after a huge run. The candid read is we do not yet know which.
What to Watch Next
Two markers matter over the coming weeks. First, whether copper stabilizes or the pullback extends. Second, Freeport’s next earnings report; the Street currently models $0.7250 in EPS for the September quarter, with revisions running three up and six down over the trailing 30 days. FCX’s 50-day moving average of $66.72 is the level bulls will want to defend.

Contact [email protected] for any questions or corrections.
Chris Lange is a financial and geopolitical writer with more than a decade of experience covering a myriad of topics. He has published thousands of articles for 24/7 Wall St., with past coverage focused heavily on stocks, IPOs, healthcare, defense, global affairs, and technology.
His work has been quoted, or referenced by a number of outlets including Business Insider, USA Today, Yahoo Finance, MSN, The Motley Fool, and many other publications. A graduate of Southwestern University, he studied business with a focus on investments and has previous experience in banking and startups.
When not reading or writing the news, he is following his passion for Lacrosse, playing chess, or building solar projects with his dad.