Stocks Just Had Their Worst Second Day After a Midterm in Nearly a Century
A post-election rally vanished in a single session, and the market's fear gauge jumped almost 70%. Three theories claim to explain the rout, but each one leaves a gap that the bond market and analysts' earnings forecasts refuse to fill.

This post may contain links from our sponsors and affiliates, and Flywheel Publishing may receive compensation for actions taken through them.

Two sessions after Democrats won the November 3 midterm elections, the S&P 500 fell 334.89 points, or 4.36%, to 7,353.73 on November 5, 2026. That was the worst second day after a midterm in nearly a century of data, and the drop was close to twice the roughly 2.3% decline that set the previous mark in 2002.
The Dow lost 1,833.06 points, or 3.44%, to 51,523.06. On Wednesday it had gained 1,569.40 points to close at 53,356.12, so the selloff wiped out the post-election rally. The Nasdaq Composite fell 5.52% to 24,315.00, and the Russell 2000 dropped 4.45% to 2,729.89.
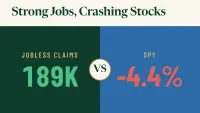
The State Street SPDR S&P 500 ETF Trust (NYSEARCA:SPY) fell 4.41% to close at $733.00. The State Street SPDR Dow Jones Industrial Average ETF Trust (NYSEARCA:DIA) lost 3.53% to $514.27. In evening trading, the two funds were quoted at $734.39 and $513.37.
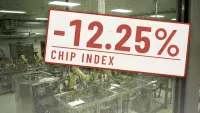
All 11 S&P 500 sectors finished lower. Tech fell 7.3%, and the Philadelphia chip index lost 12%, the second-biggest drop in its history.
The VIX, Wall Street’s measure of expected volatility, rose 69.66% to 28.18. By 2:58 p.m. ET, retail investors had sold a net $358 million of individual stocks. That count was incomplete, but it was on pace to be the largest since the $502 million sold on March 17, 2020.
Three Explanations, With Gaps in Each
The first explanation is that a Democratic Congress could slow the build-out of AI data centers. On Election Day, voters backed limits in 40 of 41 local data center ballot measures. However, those were local zoning votes, and no company has yet reported a delayed/blocked project because of them.
Second, rate traders moved their expected date for the Fed’s next rate hike to March, while the target rate is unchanged at 4.00%. When investors expect a hike, they apply a higher discount rate to future profits, and expensive growth stocks lose the most value. Bonds tell a different story, because the 2-year Treasury yield fell to 4.46% from 4.58%.
The third comes from Nomura strategist Charlie McElligott, who described hedge funds racing to lock in this year’s gains before year-end. That suggests traders are cutting positions, even as company earnings expectations have held up.
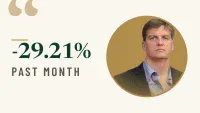
SPY fell 5.92% through November 5, while DIA was nearly flat at -0.06%. SPY weights holdings by market value, which puts NVIDIA (NASDAQ:NVDA | NVDA Price Prediction) at 7.58% of the fund. The Dow weights its 30 stocks by share price, so it carries less AI exposure.
The S&P 500 fell 3% for the week through November 5. For the year, it is still up 7.4%, and the Dow is up 7.2%.
What a Lower Forward P/E Means for SPY Holders
Analysts’ earnings estimates hit a new high just as prices fell, pushing the S&P 500’s forward P/E under 18x. The evidence points to traders cutting positions, while analysts’ profit estimates have kept rising.
For investors researching how much tech exposure they carry, DIA offers a different weighting approach. Its flat month shows that it held up in this selloff because it owns less AI. For readers thinking about the other side of that trade, we featured seven suppliers supporting the data-center expansion, from electricity to cooling to networking, in a free report you can grab here.
There are two ways to check this view. It holds up if the VIX closes back below 20 and SPY stays above its $733.00 close through November 30, 2026. It is wrong if the VIX closes above 30 and companies start reporting set-off data center projects.
Contact [email protected] for any questions or corrections.
Omor Ibne Ehsan is a writer at 24/7 Wall St. He is a self-taught investor with a focus on growth, cyclical, and dividend equities that have strong fundamentals, value, and long-term potential. He also has an interest in high-risk, high-reward investments such as penny stocks.