The U.S. Economy Just Sent 2 Completely Different Signals — a Fed President Says More Rate Hikes Are Needed
Builders are pulling back for the third straight month while shoppers and employers keep spending and hiring. Fed officials see that split as a reason to tighten again, and your monthly mortgage payment could pay for it.

This post may contain links from our sponsors and affiliates, and Flywheel Publishing may receive compensation for actions taken through them.
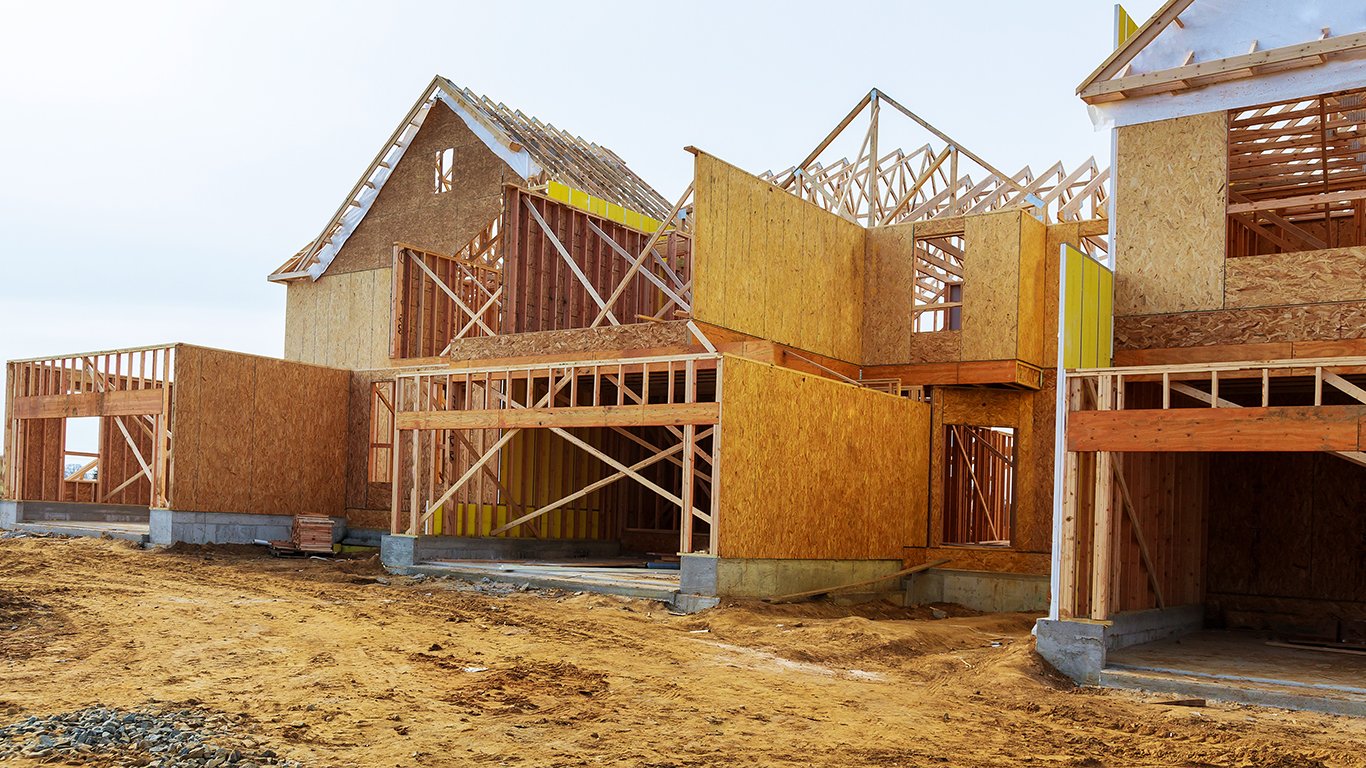
U.S. housing starts fell to a seasonally adjusted annual rate of 1,221,000 units in September 2026, down from 1,288,000 in August. The fall totaled to 67,000 units, or 5.2%. The Census Bureau collects the series, and the September reading was last updated on October 20, 2026. It was the third straight monthly fall, and it came while consumer spending and hiring kept running hot.
That split is the core of the policy debate. On October 30, St. Louis Fed President Alberto Musalem noted that housing faces high mortgage rates, building costs, and supply shortages. He still said that strong demand and persistent inflation mean further interest-rate increases will likely be necessary. Since then, Fed presidents Beth Hammack and Tom Barkin have also favored a gradual rate-hike path to lower inflation.
Housing Starts Slide Toward the Bottom of Their 12-Month Range
| Month | Housing Starts (thousands, SAAR) |
|---|---|
| November 2025 | 1,319 |
| December 2025 | 1,378 |
| January 2026 | 1,385 |
| February 2026 | 1,346 |
| March 2026 | 1,522 |
| April 2026 | 1,414 |
| May 2026 | 1,182 |
| June 2026 | 1,439 |
| July 2026 | 1,369 |
| August 2026 | 1,288 |
| September 2026 | 1,221 |
September’s figure ranks in the 9.1 percentile of the past year. It is well below the 1,522,000 high in March 2026 and the 1,351,182 average, but still above the 1,182,000 low in May 2026. A range of 1.2M to 1.5M is generally considered healthy, so builders are sitting just above the floor of that band.
Strong Consumers, Weak Builders: Two Signals Side by Side
| Indicator | Latest | Prior |
|---|---|---|
| Housing starts | 1,221K (Sept.) | 1,288K (Aug.) |
| Retail sales | $745.0B (Sept.) | $739.3B (Aug.) |
| Unemployment rate | 4.1% (Oct.) | 4.2% (Sept.) |
| Core PCE price index | 130.902 (Sept.) | 130.489 (Aug.) |
| The national Case-Shiller index | 336.741 (Aug.) | 337.262 (July) |
| Fed funds upper bound | 4.00% | 3.75% (through Sept. 16, 2026) |
Retail sales rose 0.8% to a 12-month high. Unemployment hit its lowest level in the past year. Core PCE, the Fed’s preferred inflation measure, climbed 0.3% in a month to a record for the period. That is the demand-and-inflation case Musalem cited. The Fed already raised its upper bound to 4.00% on September 17, 2026.
What Higher Rates Cost a Homebuyer Every Month
Prices are moderating, but payments are rising. Redfin reports the median U.S. home-sale price was $389,601 for the four weeks ending October 25, 2026, down 0.1% year over year. That was the first decline in more than three years. Even so, the median monthly mortgage payment rose 10.7% to $2,786 at an average 30-year rate of 7.32%.
A $350,000 loan at 6% costs about $2,098 a month in principal and interest. At 7.32%, the same loan costs about $2,404, or roughly $306 more every month. Buyers are pulling back: pending sales fell 15.9% year over year to the lowest level in Redfin’s records dating back to 2021.
The Fed controls the overnight rate, while mortgage rates follow bond yields and inflation expectations. That channel offers some relief. The 10-year Treasury yield fell to 4.90% on November 4, 2026, down from a 5.31% high on October 5, 2026. It remains above its 4.474% one-year average.
Key Dates Before the Next Housing Read
A date for the next housing starts release has yet to be announced. These scheduled releases come earlier:
- November 6, 2026, 4:15 p.m. ET: H.15 Treasury yields
- November 12, 2026, noon ET: weekly 30-year mortgage rate survey
- November 24, 2026, 9:00 a.m. ET: Case-Shiller home prices
- December 1, 2026, 10:00 a.m. ET: job openings (JOLTS)
If October starts come in below 1,182,000, it would set a new 12-month low and strengthen the case that tighter policy is choking housing supply. If they rebound above 1,288,000, it would fell that concern. Buyers have leverage now, with months of supply at 4.5. Those considering a purchase or a rate lock should keep an eye on the November 12 mortgage survey, since more Fed increases could push borrowing costs higher.
Contact [email protected] for any questions or corrections.
After two decades of patrolling the dark corners of suburbia as a police officer, Rich Duprey hung up his badge and gun to begin writing full time about stocks and investing. For the past 20 years, he’s been cruising the markets looking for companies to lock up as long-term holdings in a portfolio while writing extensively on the broad sectors of consumer goods, technology, and industrials. Because his experience isn’t from the typical financial analyst track, Rich is able to break down complex topics into understandable and useful action points for the average investor. His writings have appeared on The Motley Fool, InvestorPlace, Yahoo! Finance, Money Morning, and, of course, 24/7 Wall St. He has been featured in both U.S. and international publications, including MarketWatch, Financial Times, Forbes, Fast Company, and USA Today.