U.S. Home Sales Just Fell to a 16-Year Low. The Last Time They Were This Weak Was After the 2008 Crash

This post may contain links from our sponsors and affiliates, and Flywheel Publishing may receive compensation for actions taken through them.
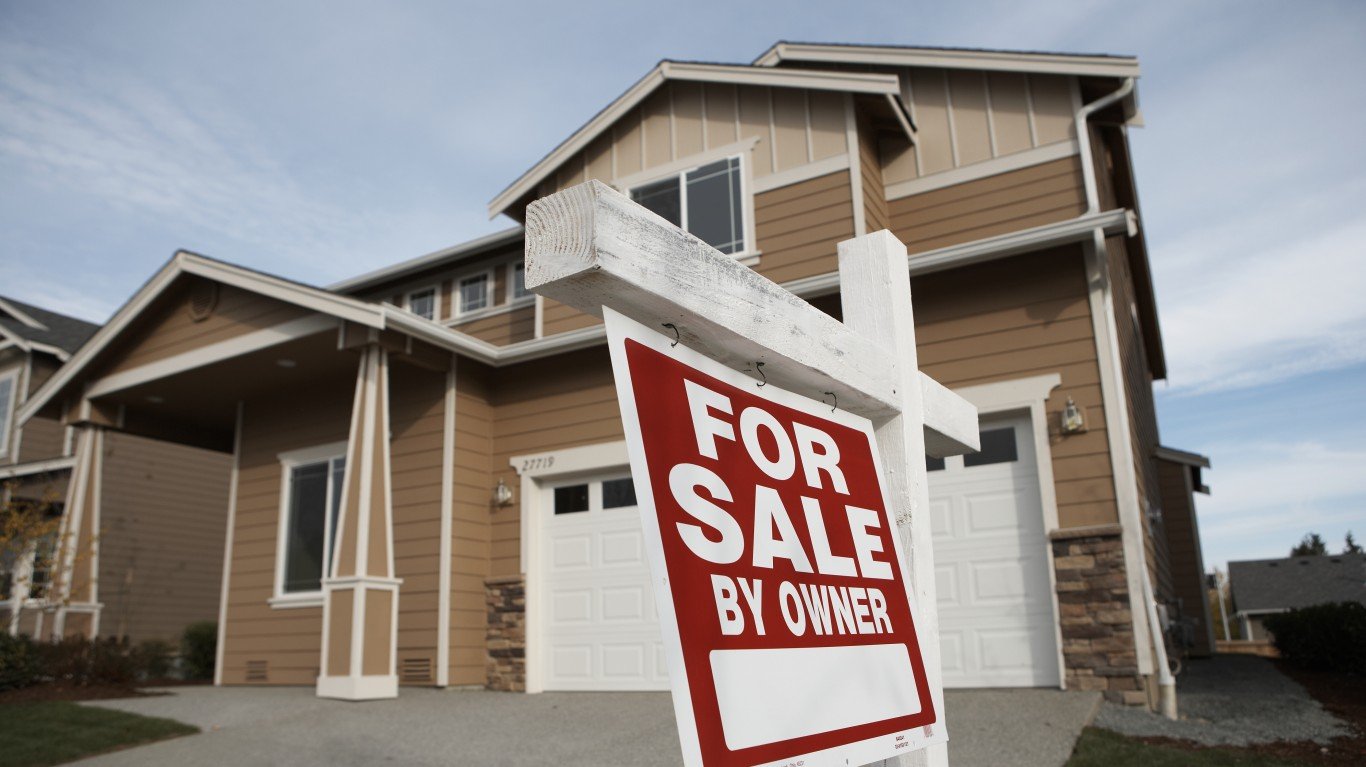
Americans bought previously owned homes at a seasonally adjusted annual rate of 3.75 million in October, the National Association of Realtors reported on November 12. That pace was 5.5%[1] below September and 8.8% below a year earlier. It was also the slowest since August 2010, when the market was still digging out from the financial crisis. The figure is an annualized rate: it shows what a full year would look like if October’s pace held. It does not count the homes that actually sold in October.
The 2010 low came from foreclosures and falling prices. This one comes from paralysis, and that pattern can last longer.
Mortgage Rates Turned a Slowdown Into a Freeze
Freddie Mac’s 30-year mortgage rate averaged 7.33% in October, up from 6.86% in September and 6.25% a year earlier. That jump explains the timing. Buyers who came back when rates fell last fall ran into rising borrowing costs again. Owners face the same math. In January 2021[2], the rate bottomed at 2.65%. Anyone who locked in near that level would have to give up their cheap loan and take on a rate above 7% to move, so most of them stay.
Prices add to the strain on buyers. The median existing-home price reached $416,700, up 0.4% from a year ago. First-time buyers made up just 29% of sales. Sales fell hardest in the West, dropping 9.7% in a single month to an annual rate of 650,000. Consumer confidence adds to the drag. September’s Michigan sentiment index stood at 48.1[3], well below the level its guide associates with recessions.
Equity Cushions Separate 2026 From 2008
Distressed sales made up only 2% of October transactions. The S&P CoreLogic Case-Shiller national index rose 2.1% year over year in August and sat just below its record from July. Inventory climbed to 1.59 million homes, a 5.1-month supply. That is enough to give buyers some leverage but far short of a glut.
Owners also look different from the bubble years. Federal Reserve data show the bottom half of households held 9.7%[4] of owner-occupied real estate in the second quarter, down from 15% in mid-2008. Housing wealth now sits mostly with households that have the cash and equity to wait out high rates instead of being forced to sell.
Fewer Closings Drain Housing-Linked Industries
A sales drought still drains the economy even when prices hold steady. Real estate and rental and leasing produced 13.6% of GDP in the second quarter, more than any other private industry. Every home sale pays brokers’ commissions and lenders’ origination fees, and it usually sets off spending on movers, furniture, appliances, and remodeling. When homes stop changing hands, all of that spending dries up. Retail trade grew just 0.3% in the second quarter.
New construction, which is tracked separately from resales, is slowing too. Housing starts fell to an annualized 1.22 million[5] in September, down 7.4% from a year earlier.
Rates Hold the Key to Unlocking Pent-Up Demand
October’s report shows that the largest private industry by GDP share is moving at a pace last seen after the financial crisis, even as prices hold steady. Buyers who stepped back and owners who are waiting add up to a large backlog of demand, but only cheaper borrowing will bring it back.
Some early relief is showing. Freddie Mac’s weekly rate fell to 7.11%[2] on November 12, down from 7.40% in mid-October. NAR’s November report will show whether that dip brought buyers back. Watch two numbers in it: the first-time buyer share, which shows whether younger households are returning, and months of supply. If inventory keeps climbing while sales stall, sellers will eventually have to cut prices. That would be the first real break in the freeze.
Contact [email protected] for any questions or corrections.
After two decades of patrolling the dark corners of suburbia as a police officer, Rich Duprey hung up his badge and gun to begin writing full time about stocks and investing. For the past 20 years, he’s been cruising the markets looking for companies to lock up as long-term holdings in a portfolio while writing extensively on the broad sectors of consumer goods, technology, and industrials. Because his experience isn’t from the typical financial analyst track, Rich is able to break down complex topics into understandable and useful action points for the average investor. His writings have appeared on The Motley Fool, InvestorPlace, Yahoo! Finance, Money Morning, and, of course, 24/7 Wall St. He has been featured in both U.S. and international publications, including MarketWatch, Financial Times, Forbes, Fast Company, and USA Today.