The S&P 500 Is Now Below Every Wall Street Year-End Target for 2026

This post may contain links from our sponsors and affiliates, and Flywheel Publishing may receive compensation for actions taken through them.
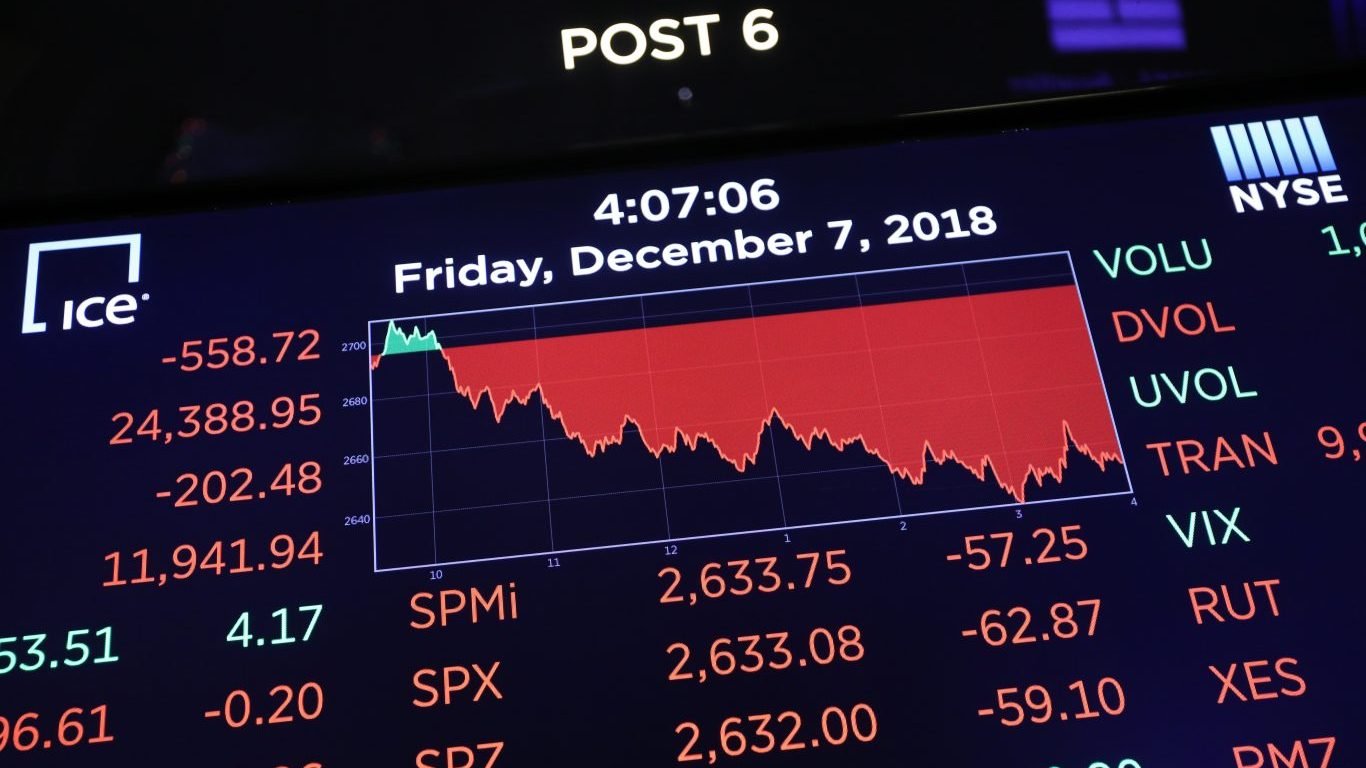
The S&P 500 finished Friday at 6,910.39 after a 265.44-point drop. That close put the index below a number most of Wall Street had treated as the floor for 2026.
Less than two hours after the bell, Creative Planning’s Charlie Bilello posted on X that at 6,910 the index is up less than 1% for the year and sits “below every major Wall Street firm’s price target.” He added that reaching the average target of 7,600 would take a 10% rally by year-end.
The SPDR S&P 500 ETF Trust (NYSEARCA:SPY) fell 3.64% in the session. It later traded at $697.40 after hours.
Fear is building too. The CBOE Volatility Index closed Thursday at 28.44[1], up 52.1% in a week. When the market sits below every target, the targets were likely too generous from the start, and that matters more to your returns than the size of the gap.
A 3.70% Drop Erased Nearly All of 2026’s Gains
Friday’s 3.70% fall left the index up just 0.95% from its 2025 close of 6,845.50. The index now sits 11.6% below its October record close of 7,818.93. SPY lost 7.55% over the past week and 9.79% over the past month.
The iShares Core S&P 500 ETF (NYSEARCA:IVV) fell 7.49% for the week, and the Vanguard S&P 500 ETF (NYSEARCA:VOO) fell 7.47%. Both peers tracked SPY’s fall closely because they hold the same index.
Bank of America’s 7,100 Floor Still Sits Above the Market
Bilello’s chart lists the year-end targets of 20 firms as they were published in December 2025. Bank of America and Ned Davis Research were the lowest at 7,100.
Even mid-range calls from Societe Generale (7,300), Barclays and BMO (7,400) and JPMorgan, HSBC and Stifel (7,500) now sit above Friday’s close.
Goldman Sachs met the 7,600 average. Morgan Stanley and Wells Fargo were at 7,800, Deutsche Bank at 8,000 and Oppenheimer at 8,100, the highest.
Bank of America strategist Savita Subramanian kept her 7,100 target through late August while other firms raised theirs. Even that Street-low number needs a 2.7% gain from Friday’s close.
Strategists Raised Targets All Year as Stocks Climbed
By late June, Goldman Sachs and Morgan Stanley were at 8,000, Citigroup and Oppenheimer at 8,100, Wells Fargo at 7,950, and JPMorgan, Barclays and Stifel at 7,800.
A late-October survey of 19 economists put the average at 7,967. The index would need to gain 15.3% to reach that level.
The process itself pushes targets up. Strategists often start from the current level and add a typical annual gain, which tends to push targets above the market.
Morgan Stanley’s Mike Wilson raised his one-year-forward target to 8,700 from 8,000 this week. When the price sits below every target, that tells you more about how targets get set than about how cheap stocks are.
History Shows a 10% Year-End Rally Is Rare
Only 27 trading sessions remain in 2026. Markets close for Thanksgiving and Christmas, and the day after Thanksgiving is a half-day session.
Since 1970, the index has gained 10% or more from November 20 to the last trading day of the year in four years: 1970 (+10.1%), 1971 (+11.4%), 1991 (+10.2%) and 2008 (+20.0%).
The average gain over that period is about +2.6%. A typical finish could reach 7,100, but 7,600 would take a year-end run as big as any in those four years.
A rally that large would need the Fed’s December 8-9 meeting to lower the 10-year Treasury yield, now 5.04%[2]. It would also need holiday trading strong enough to end the selling.
What Could Close the Gap to Strategist Targets
The case for SPY likely beefs up if earnings growth holds and yields lower after the Fed meets, because that path closes the gap to targets over the next year even if it misses the December deadline. The main risk is weaker AI-driven earnings. Two chipmakers account for about 35% of expected S&P 500 earnings growth for 2026, and SPY’s largest holding, a chipmaker, carried a 7.58% weight earlier this year.
For investors near retirement, a year-end target likely matters less than a planned stock allocation, because volatility is running well above normal. VOO and IVV track the same index as SPY, and the 10-year Treasury yield stands at 5.04%[2].
Contact [email protected] for any questions or corrections.
Omor Ibne Ehsan is a writer at 24/7 Wall St. He is a self-taught investor with a focus on growth, cyclical, and dividend equities that have strong fundamentals, value, and long-term potential. He also has an interest in high-risk, high-reward investments such as penny stocks.