Is Bitcoin a Good Buy at $80,000 Right Now?
Wall Street's biggest Bitcoin buyers are sitting right at breakeven near $80,000, and how they respond to this pressure point could determine whether BTC holds steady or slides toward territory not seen since summer.

This post may contain links from our sponsors and affiliates, and Flywheel Publishing may receive compensation for actions taken through them.
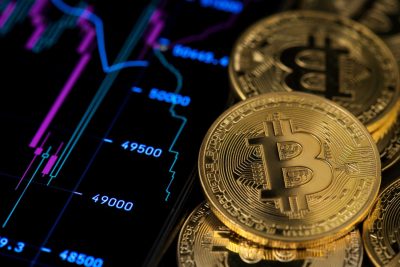
Bitcoin (CRYPTO:BTC) is hovering around $80,000, the average price many of Wall Street’s recent Bitcoin investors paid, so many are weighing whether to buy at $80,000. BTC is trading at about $79,560, roughly 36.9% below its all-time high of $126,080. Over the past month, Bitcoin has declined by 5.0%, is down 8.4% year-to-date, and has dropped 30.0% over the last year.
In October, Bitcoin has also fallen 4.1% so far, with its 30-day low at $79,107, just below the current price. It also remains below its 50-day average of $81,802. So, is this a good time to buy Bitcoin, especially since many significant investors are at breakeven?
Big Investors Paid Around $80,000 for Bitcoin

The cost basis, or the average price that investors paid for Bitcoin, shows some interesting trends. According to Glassnode data, spot ETF holders and corporate treasuries bought Bitcoin at an average price between $80,000 and $81,500. This means they are nearly at breakeven, with little gain or loss.
Glassnode’s findings indicate that Bitcoin bounced back twice near $81,500, which is the average price for U.S. spot ETF holders. On October 15, Bitcoin dropped to around $80,000, and buying interest picked up quickly.
If the price falls further, Glassnode’s True Market Mean suggests that the average price for active investors is about $77,600. To reach this level, Bitcoin would need to decline approximately 2.5%, a price point it last hit on September 18.
Three Reasons Investors Are Considering Buying Bitcoin Near $80,000

- Breakeven Buying Behavior: When investors find themselves at breakeven, they often buy more to protect their positions, which can help stabilize the price. Bitcoin has appreciated by 25.6% over the last 90 days and is up 37.8% since hitting a low of $57,718 on July 1.
- Investor Sentiment: Market sentiment is leaning toward fear. The Crypto Fear & Greed Index, which ranges from 0 to 100 (with scores below 50 indicating fear), reads 44. Historically, buyers who enter during periods of fear often secure better prices than those who chase rising markets.
- Strong Historical Performance: Over the past decade, Bitcoin has surged more than 11,500%. For example, someone who bought at $58,681 late in the 2021 bull run, on October 27, 2021, is still up 35.6% despite the market’s decline in 2026.
ETF Outflows and Slower Corporate Buying Call for Caution

In late October, spot Bitcoin ETFs (which directly hold Bitcoin) experienced significant outflows, losing $635.5 million on October 22 and another $137.9 million on October 23. Total assets also fell from $110.8 billion on October 5 to $104.4 billion. However, the funds reported $304.7 million in net inflows by the end of the week of October 19, bringing cumulative net inflows to $57.2 billion.
Moreover, corporate Bitcoin buying has slowed. For instance, Strategy (NASDAQ:MSTR | MSTR Price Prediction), which holds 848,517 BTC, added no Bitcoin in the week leading up to October 25. Its last purchase, revealed on October 12, was only 250 BTC—a small amount for the market’s largest corporate buyer.
Bitcoin has also mirrored tech stocks in 2026, raising concerns that a sell-off in AI-focused stocks could drag its price down further. Markets are also awaiting the Federal Reserve’s rate decision on October 28. If the support level around $80,000 breaks, the next significant level to watch will be the True Market Mean at $77,600.
Should Investors Buy Bitcoin at $80,000?
Whether this is a good time to buy Bitcoin largely depends on your investment strategy and how you would react to potential price drops. Long-term investors might view $80,000 as a noteworthy price point. However, due to ETF outflows and slowing corporate purchases, Bitcoin may test the $77,600 level first.
A lump-sum investment might work well if Bitcoin rallies immediately, while dollar-cost averaging—investing fixed amounts at scheduled intervals—could help minimize losses if the price drops initially.
A price recovery would likely happen in stages. First, Bitcoin would need to hold above its recent 30-day low of $79,107, then break back above $81,500 and its 50-day average of $81,802, all while ETF inflows turn positive.
If the price closes above $81,802, it suggests that major holders are defending their positions. Conversely, a close below $77,600 could bring back the 2026 low of $57,718 into view. Until we see clearer upward momentum, a move toward the previous record high of $126,080 seems unlikely.
Contact [email protected] for any questions or corrections.
Sam Daodu is a crypto analyst and the editor of 24/7 Wall St.'s Crypto Desk, where he covers Bitcoin, XRP, Ethereum, Solana and the altcoins investors search for most. His work focuses on price levels, spot ETF flows, on-chain data and the regulatory decisions that move crypto markets, written so a first-time buyer and a seasoned trader can both use it.
Sam has written about crypto professionally since 2019 and has published more than 2,000 articles. Before joining 24/7 Wall St., he wrote for crypto media outlets and Web3 companies and ghostwrote for crypto founders and token launches. His analysis is syndicated on Yahoo Finance, MSN and AOL and has been cited by other crypto news sites. He also founded MacLabs Marketing, a content and personal branding agency for crypto founders and executives.
When he isn't reading charts, Sam is usually at the gym or watching One Piece, a series he maintains has better tokenomics than most altcoins.