





The ProShares UltraPro S&P 500 (NYSEARCA:UPRO) has become one of the most popular leveraged ETFs for investors looking to amplify their exposure to the benchmark S&P 500 Index. The fund is designed to target three times the daily return of the S&P 500, and has historically generated outsized gains during strong market rallies. However, because of the fund’s underlying mechanics, long-term returns can deviate from a simple 3x multiple.
Before buying UPRO, investors must understand one key rule: the fund resets its leverage every trading day. This single technical feature explains why UPRO can radically outperform or underperform the S&P 500 over weeks, months, or even years.
The One Rule: UPRO Resets Every Day
UPRO achieves its 3x daily mandate through a combination of direct equity holdings, swap contracts, and futures. In practice, roughly half of the fund’s assets are directly invested in the underlying index’s stocks, while other derivative instruments are used to provide leverage. Swap contracts issued by banks such as UBS, Goldman Sachs, and JP Morgan, among others, do much of the heavy lifting (carrying a notional value of ~240%). E-Mini S&P 500 futures round out the fund’s leveraged exposure, providing a total 300% leverage factor.
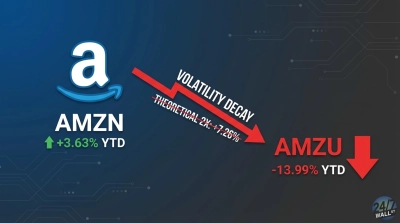
Because the fund rebalances daily to maintain this 3x target, returns over periods longer than a single trading day can diverge significantly from this target (a phenomenon known as volatility decay).
This decay effect is measurable: the 12-month drift on UPRO has averaged -2.2% on a time-weighted basis since 2010. For longer-term oriented investors, this creates a structural headwind that can prove detrimental during sideways/choppy trading ranges.
Fund Specifics
Before building a trading thesis around UPRO, active market participants should consider the current fund metrics.
| Metric | UPRO |
| Investment Objective | 3x the daily return of the S&P 500 |
| Leverage Reset | Daily |
| Inception Date | June 25, 2009 |
| Net Assets | $5.07B |
| Expense Ratio | 0.89% |
| 3-Month Average Daily Volume | $435 million |
| 10-year Cumulative return | 1,004.20% |
| Max Drawdown | -76.8% |
| Best Suited For | Short-term tactical investors |
Who Should (and Shouldn’t) Buy UPRO
UPRO is specifically designed for active traders with clear entry and exit signals who understand the mechanics behind the daily leverage reset. The fund is not meant for passive, buy-and-hold investors. That said, it is hard to ignore the multi-year long-term performance of the fund.
Since the fund’s inception in June 2009, UPRO has posted a massive 8,693% cumulative return, compared to 832% for the baseline S&P 500. This represents a massive 10.4x performance gap, albeit still short of the 3x daily target when compared over time.
However, this performance has come at a cost. These amplified returns come with much steeper drawdowns. UPRO’s maximum historical drawdown of -76.80% should be cause for concern for any investor. Additionally, with a Sharpe ratio of 0.80 compared to 0.91 for SPY, it is understandable why UPRO has worse risk-adjusted returns when compared to just owning the underlying index.
For investors looking to build long-term generational wealth, SPY remains the far more cost-effective, safer, and mathematically sound option.
Final Takeaway
UPRO is an incredibly powerful financial tool when used as intended. It is highly effective for single-day scalping, capturing momentum breakouts, or intraday macro hedging. However, mistaking it for a buy-and-forget retirement asset can prove to be a severe miscalculation.
For investors who understand the math behind the daily reset, UPRO can be used to capture explosive short-term market wins. But for those who overstay their welcome, there can be serious consequences to pay.
Contact [email protected] for any questions or corrections.

















 Top Gaining Stocks
 Top Losing Stocks