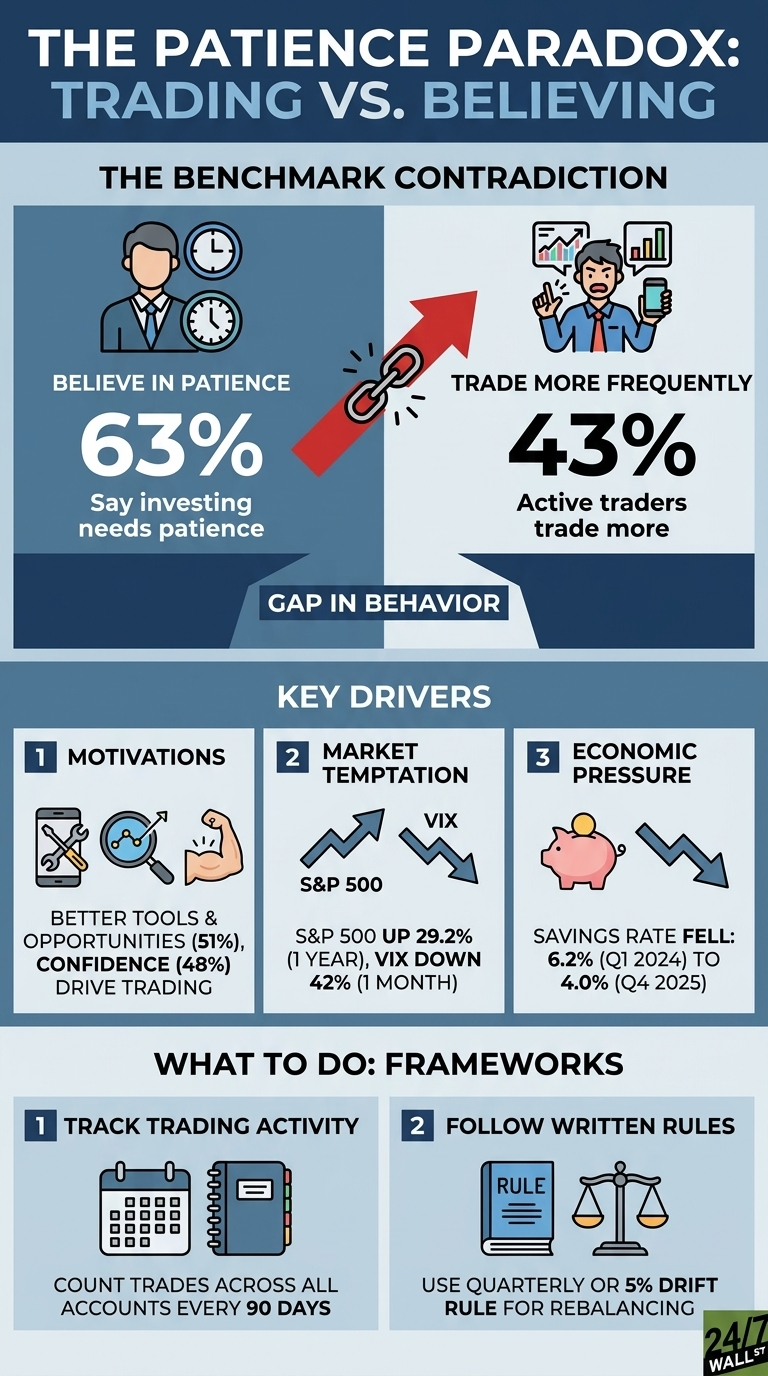
A new contradiction sits at the center of how Americans say they invest versus how they actually invest. The Charles Schwab Modern Wealth Survey 2025 found that over 63% of Americans believe investing today requires more long-term patience, yet 43% of active traders report trading more frequently than when they first started investing. The gap between stated beliefs and actual behavior is sizable, and for pre-retirees and retirees who depend on income-focused portfolios, it carries implications for retirement risk.
The trading data is more striking than the headline suggests. According to Schwab, 89% of investors trade at least once a year, and 24% trade daily or weekly. Trading every week becomes a concern inside an account meant to fund 25 or 30 years of retirement spending. Each trade introduces tax friction inside taxable accounts, bid-ask spread costs, and the possibility of selling a dividend payer right before its ex-date.
What Is Driving the Extra Activity
The reasons investors give for trading more are revealing because none of them are about the portfolio itself. Schwab found that the top motivations among those trading more frequently were access to better trading platforms and tools (51%), the desire to capitalize on market opportunities (51%), and increased confidence from experience (48%). Better tools and rising confidence are platform features and personality traits. They describe why the trade is easy to place rather than the investment thesis behind it.
The current market environment makes the temptation worse. The S&P 500 is up 29.2% over the past year and 12.24% in the past month alone. The VIX has fallen from a March peak of 31.05 to 18.02, a 42% decline in 30 days. Sharp rallies after volatility spikes are conditions historically associated with rising investor confidence and increased trading activity.
The Income Portfolio Problem
For retirees, the broader risk is that activity erodes the structure of an income-focused portfolio, even when an individual trade does not lose money on its own. The 10-year Treasury currently yields 4.35%, and the broad bond market, as measured by the Vanguard Total Bond Market ETF (NASDAQ:BND), returned 4.5% over the past year. Those numbers are the predictable cash flow when held. They become something else when traded around. Selling a bond fund during a rate spike to chase equity momentum, then rebuying after stocks have run, is one of the more common ways pre-retirees discover their realized returns are well below the index they tracked.
The pressure to trade also has a household-finance backdrop. The personal savings rate has fallen from 6.2% in Q1 2024 to 4.0% in Q4 2025, and consumer sentiment sits at 53.3, deep in pessimistic territory. When saving capacity shrinks and inflation, as measured by core PCE, sits at the 90.9th percentile of its 12-month range, the impulse to make the portfolio “do more” grows louder.
The Multiple-Account Trap
Schwab also found that 46% of investors maintain a main portfolio plus one or more smaller, separate portfolios, with 38% using side accounts to try new strategies and 29% using them to actively trade. Fragmenting a retirement plan into a serious account and a play account sounds disciplined, but the play account often pulls capital and attention out of the income engine over time.
Boomers show the cleanest version of the paradox, as the report indicates that 66% are in agreement that investing requires long-term patience, the highest of any cohort, while 59% also believe modern portfolios are more sophisticated and require professional guidance. Acknowledging complexity and acting on it are separate steps.
Frameworks Investors Use
- Some investors count the trades placed in the last 90 days across all accounts, including any “side” portfolios, and compare that figure to the number of rebalances called for in their written investment plan.
- A written rebalancing rule, such as quarterly or when an asset class drifts more than 5% from target, is one approach used to route trade decisions through a rule rather than the news cycle.
- With the 10-year at 4.35%, a Treasury or investment-grade bond ladder covering required spending over the next three to five years is one structure used to insulate the income portion of a portfolio from trading activity during volatility spikes.
Contact [email protected] for any questions or corrections.