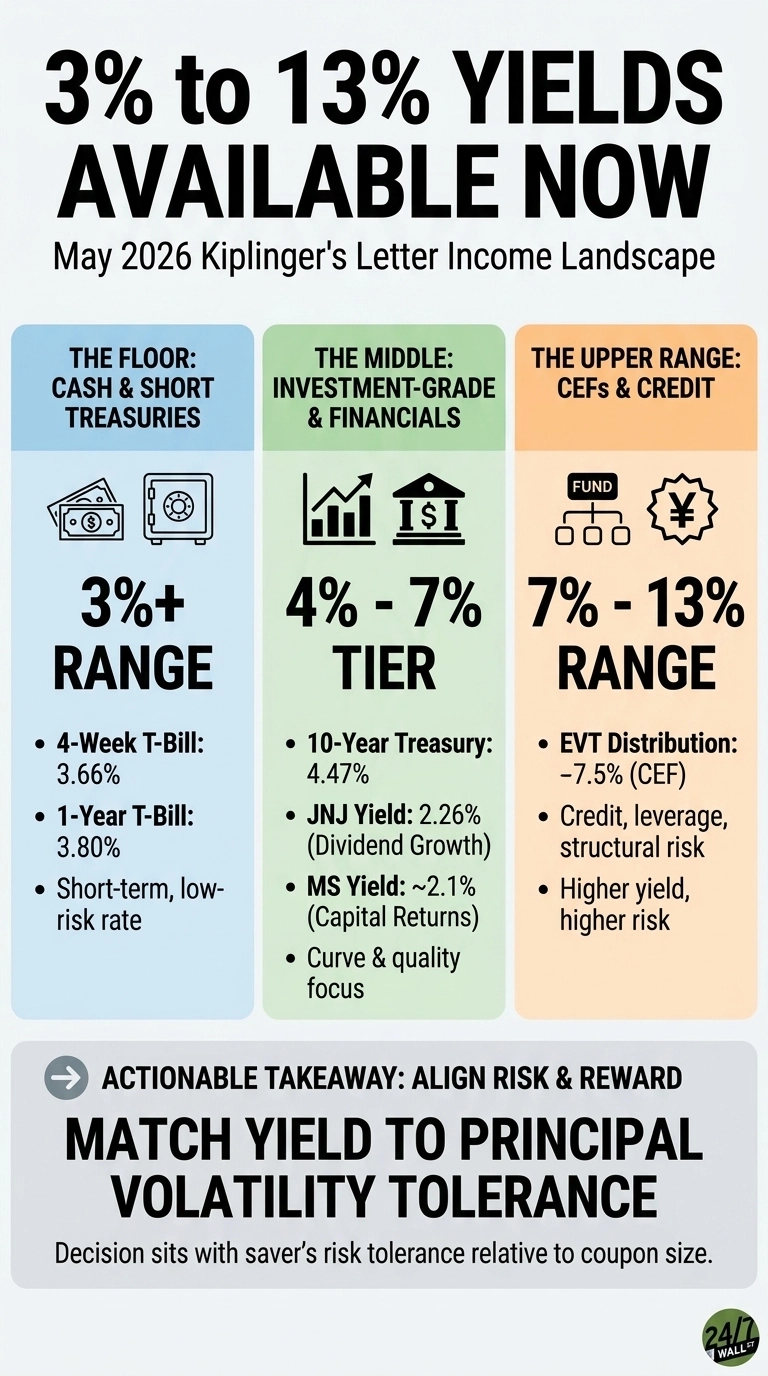
Kiplinger’s Personal Finance May 2026 letter makes it clear that if you are looking for yield, the door is wide open across the entire risk spectrum. We are seeing a massive spread, with opportunities ranging from stable 3% municipal bonds to 13% for those willing to get aggressive with business development companies. This is unfolding while the Federal Reserve holds the funds rate steady at 3.75%, even as the war in Iran throws a curveball at the market by hiking inflation expectations and long-term rates.
While the “artificial intelligence fervor” that dominated for years seemed to hit a wall in late 2025, the current income landscape hasn’t missed a beat. Investors are now weighing relatively safe plays, like intermediate-term tax-exempt funds yielding 3.3%, against spicier options like exchange-listed bond snippets yielding 6%. The income is there for the taking, but the real question for 2026 is how long the Middle East conflict lasts and how much risk you are actually willing to stomach to grab those double-digit returns.
The 3% Floor: Cash and Short Treasuries
The bottom of the risk spectrum is currently a battleground between safety and shrinking purchasing power. While the Federal Reserve holds the funds rate steady at 3.75%, the war in Iran has thrown a curveball, pushing inflation expectations and long-term rates higher. With headline inflation projected at 3% to 4% by the end of 2026, the real yield on standard cash equivalents is effectively a wash.
This narrow margin is the price of principal protection in a market that just weathered a massive geopolitical shock. For those who need more than a “break-even” result, the move is to step slightly out on the risk ladder. Municipal bond funds offering a tax-equivalent 4.3% or mortgage-debt funds yielding 5.4% provide the necessary lift to actually outrun rising costs without diving into the “spicier,” high-risk territory of double-digit yields.
The 4% to 5% Middle: The Treasury Curve and Investment-Grade Dividends
The middle of the range is where the curve does most of the work. The 5-year Treasury yields 4.13%, the 10-year offers 4.47%, and the 30-year tops out at 5.02%. TIPS at the 10-year point pay a real yield of 2.00%, which is the inflation-adjusted version of the same trade. The 10Y-2Y spread of 0.48% is positive but compressed, at the 6th percentile over the past year.
Blue-chip dividend equities sit alongside this band rather than above it. Johnson & Johnson (NYSE:JNJ | JNJ Price Prediction) pays a yield of 2.26% on its $1.34 quarterly dividend, the 64th consecutive annual increase. Cardinal Health (NYSE:CAH) yields about 1.1%. Both are dividend-growth names, and the income case rests on the compounding of the raise rather than the starting yield.
The 5% to 7% Tier: Financials and Capital Returns
Financial-services dividends layered on top of buybacks form the next step up. Morgan Stanley (NYSE:MS) carries a $4.00 annual dividend for a yield near 2.1%, supported by a Q1 2026 ROTCE of 27.1% and $1.75 billion in Q1 buybacks. Charles Schwab (NYSE:SCHW) lifted its quarterly payout 19% to $0.32 per share after Q1 2026 net income rose 30% on client assets of $11.77 trillion. The yield on Schwab is still modest at roughly 1.4%, but the dividend growth rate is the relevant figure for buyers focused on income five years out.
The 7% to 13% Range: Closed-End Funds and Credit
The upper band is where structure starts to matter more than the headline yield. Closed-end funds that use leverage and option overlays fall within the 7% to 9% range. Eaton Vance Tax-Advantaged Dividend Income Fund (NYSE:EVT) pays $0.1646 monthly, an annualized $1.9752, for a distribution rate of roughly 7.5% on its $26.27 price. The fund’s emphasis on tax-advantaged dividend income and modest leverage is representative of the CEF segment as a whole.
Yields toward the 13% end of Kiplinger’s range typically come from business development companies, mortgage REITs, leveraged credit funds, and some MLPs. Those vehicles entail credit risk, interest-rate sensitivity, and return-of-capital mechanics that the Treasury bill at the other end of the spectrum does not. The distribution rate quoted on the screen and the total return credited to the account are often different.
The Full Range
The income landscape currently ranges from 3% for municipal bond funds to 13% for business development companies. Every jump in yield across this curve is tied to a clear increase in credit, structural, or complexity risk. While the Iran war threw a curveball, pushing inflation expectations and long-term interest rates higher, attractive income opportunities remain available for those willing to navigate the fallout.
The market is still heavily influenced by the duration of the Middle East conflict, but the menu of income plays has stabilized since the initial shock. Investors are choosing between lower-risk paths, such as tax-exempt funds yielding 3.3%, and higher-risk options, such as business development companies that lend to private businesses for double-digit returns.
Ultimately, the strategy depends on a saver’s appetite for potential price swings versus the need for a reliable current yield.
Contact [email protected] for any questions or corrections.