
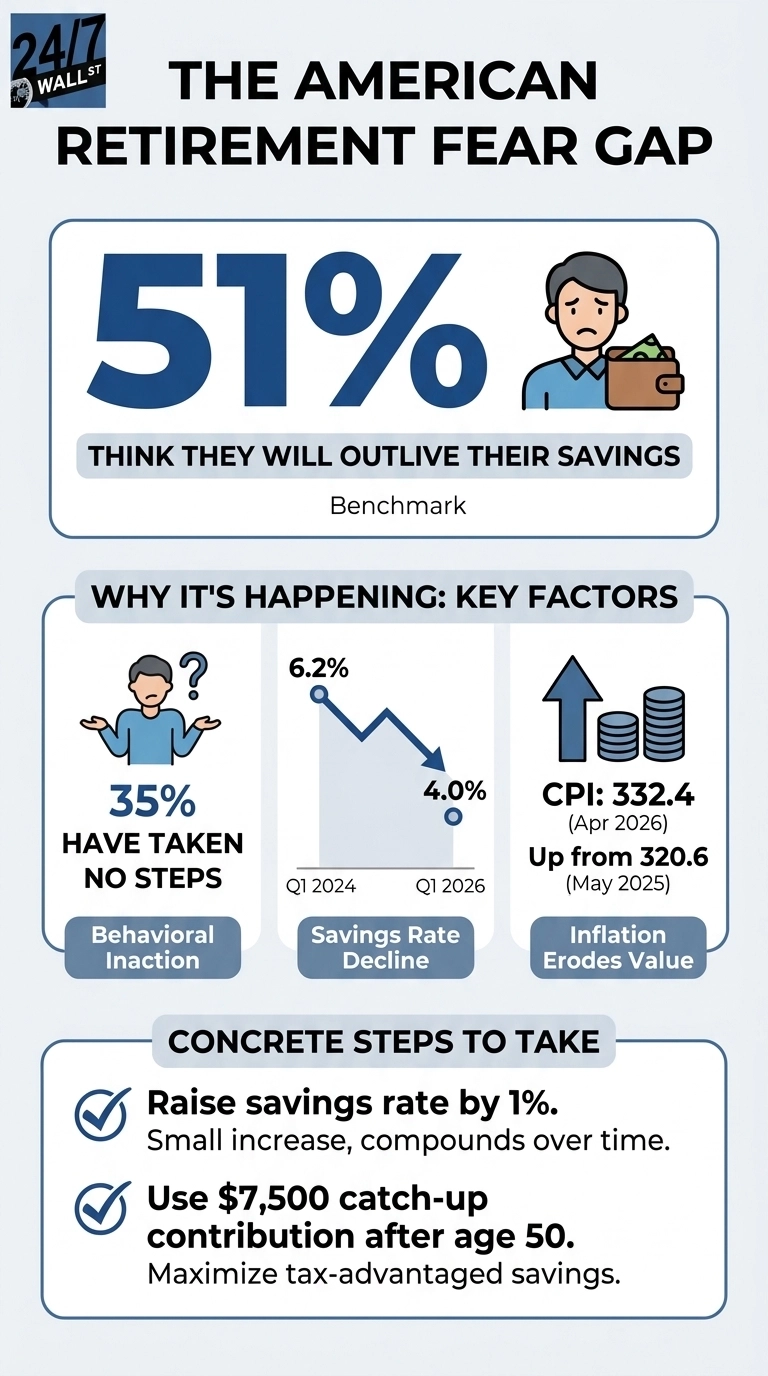
The Northwestern Mutual 2025 Planning & Progress Study quantified a widespread fear, as 51% of U.S. adults think they will outlive their savings, and 35% have taken no steps to address it. A majority sees the problem, but around a third of the worried population has taken no action. The survey covered 4,626 U.S. adults in January 2025, weighted to Census targets for age, income, region, and race. Among those who have saved for retirement, 25% have saved 1x or less of their current annual income. By common retirement benchmarks, that group is decades behind where they should be by middle age.
The macro is making the math worse
It won’t come as a surprise to learn that inflation has continued to erode savings, as the Consumer Price Index reached 332.4 in April 2026, up from 320.6 a year earlier, reducing the real value of cash balances. University of Michigan consumer sentiment came in at 48.2 in May 2026, well into the pessimistic range and approaching levels historically tied to economic stress.
Job conditions complicate the inaction narrative, with unemployment at 4.3% in April 2026, near the 12-month average in the historically low range. Average hourly earnings climbed to $37.41 in April 2026, up from $34.76 two years earlier. Per capita disposable income reached $68,617 in Q1 2026. Workers have jobs and more nominal income than two years ago.
The savings rate is telling
The Bureau of Economic Analysis shows a clear pattern in how households are using their money. The share of after‑tax income getting saved has slipped from 6.2% in the first quarter of 2024 to 4.0% in the first quarter of 2026. By early 2026, consumption was absorbing 92.3% of disposable income. Higher earnings didn’t flow into savings or investment accounts. They went straight into spending.
Housing and healthcare dominate that spending. In March 2026, households put $3,904.5 billion into housing services and another $3,741.3 billion into healthcare, together a little more than half of all services spending. Those categories only grow more demanding in retirement, when income falls, and healthcare use rises. The dollars going to today’s rent, mortgages, premiums, and copays are the same dollars that could have been building retirement balances.
Discretionary spending rounds out the picture. Motor vehicles drew $780.9 billion in March 2026, and recreational goods another $737.8 billion. Total personal consumption climbed to $1.18 trillion over the prior year. Spending growth has consistently outrun savings growth, and the gap shows up in the retirement math younger households are trying to solve.
The gap is uneven by geography
National averages blur how thin the margin really is in certain parts of the country. Per‑capita disposable income reached $93,826 in the District of Columbia and $80,708 in Connecticut at the top of the 2024 BEA table. At the bottom, Mississippi came in at $47,716, and West Virginia came in at $50,518. A single national savings benchmark cannot capture the same financial reality in Jackson as in Hartford, and treating them as interchangeable obscures the strain in lower‑income states.
High-cost-of-living states add another layer of pressure by compressing real incomes. For example, Hawaii’s cost index of 109.951 pulled per‑capita income down to $65,095 in real terms, the lowest among high‑income states. Real income varies sharply across metro areas as well, and a single savings target simply doesn’t translate evenly across those differences.
Three moves that narrow the gap
Three moves close the gap faster than most households expect:
- Raise the deferral rate by a one‑point bump; it’s the simplest lever. The national savings rate is 4.0%, while most long‑term guidance targets 12% to 15%. Moving from 4% to 5% sounds small, but over decades it compounds into a meaningfully larger balance.
- Capture the full employer match, as falling short of the match threshold leaves guaranteed returns on the table. Every unmatched dollar is free money forfeited.
- Use catch‑up contributions, as after 50, workers can add $7,500 on top of the standard $23,500 401(k) limit. For late starters, this is the cleanest way to accelerate savings without changing lifestyle overnight.
The Northwestern Mutual survey lines up with the BEA savings rate, the CPI trend, and the consumption mix. Americans are earning more, spending more of it, and saving less. The survey simply puts language to the pattern already visible in the data. The 35% who recognize the risk and have taken no action remain the group with the most control, and contributions narrow the gap, while inaction widens it.
Contact [email protected] for any questions or corrections.