24/7 Wall St. Insights
- This election cycle, Harris and Trump campaigns are focusing their resources on a handful of key swing-states, where the election will likely be decided.
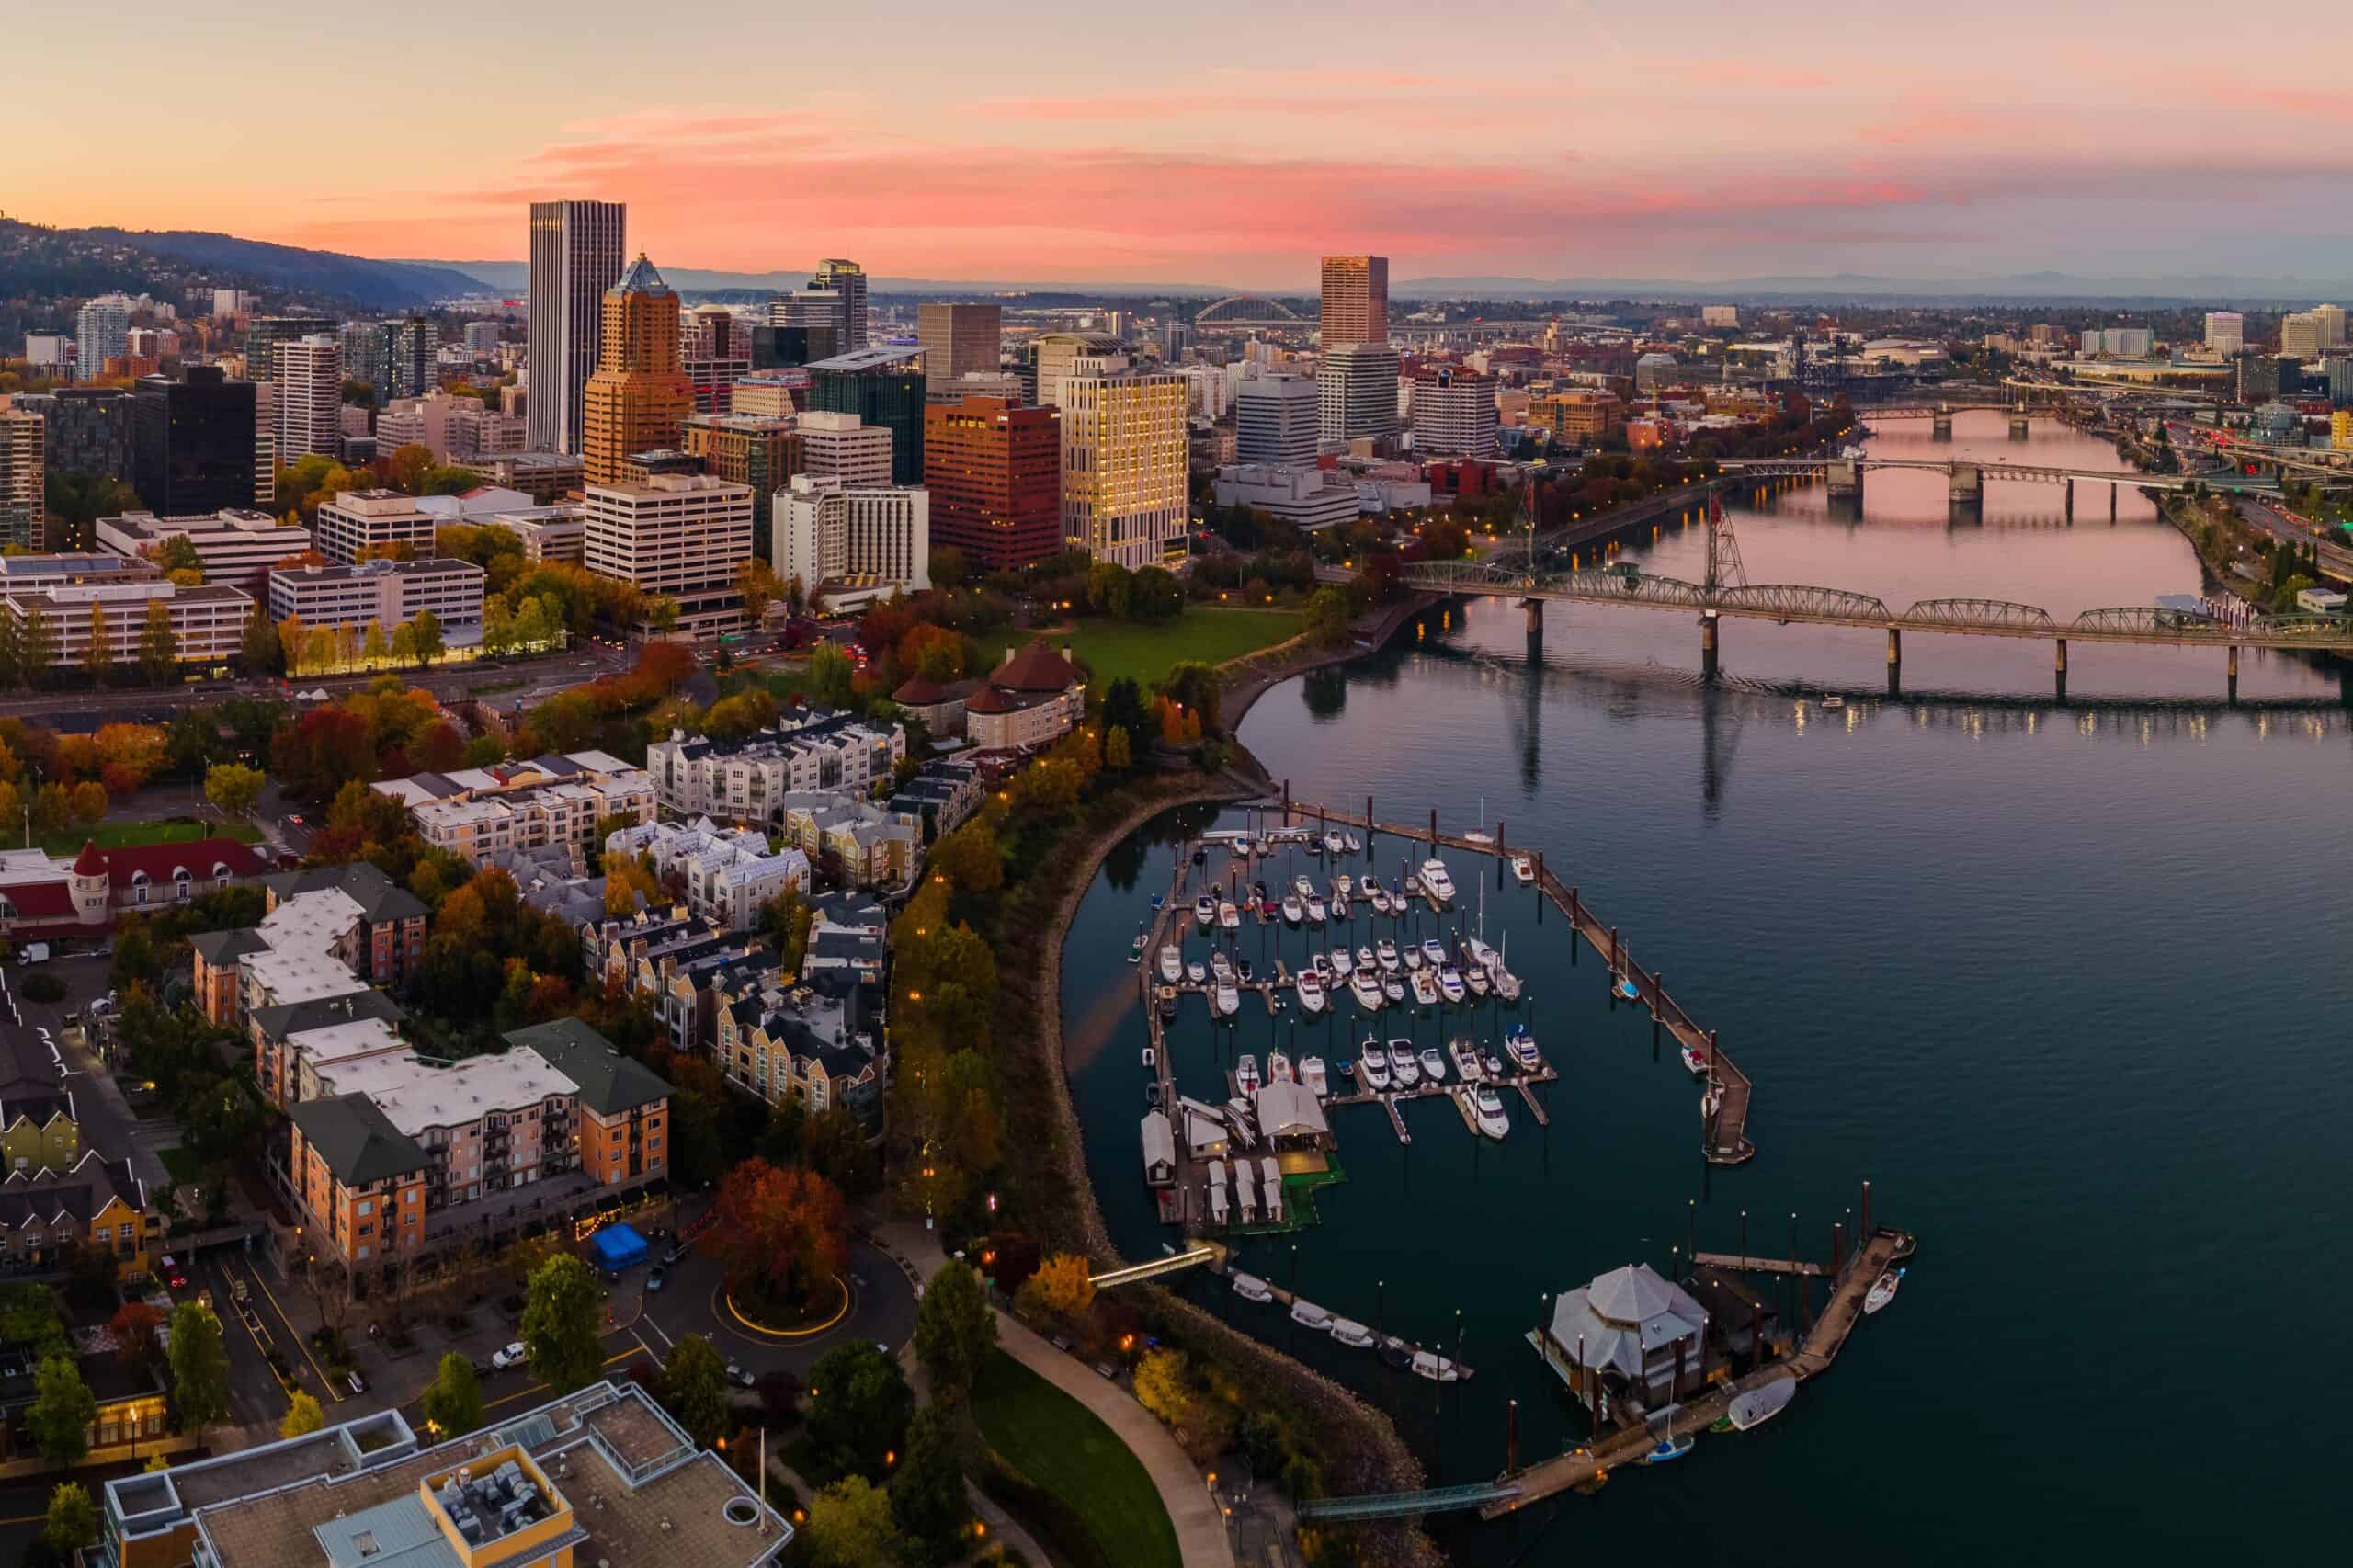
- In most of the rest of the country, including Oregon, the outcome of the race is effectively predetermined.
- However, Oregon’s status as a blue state is an oversimplification that belies a more nuanced reality.
- Also: 2 Dividend Legends to Hold Forever
The 2024 presidential race will likely hinge on voters in a handful of closely-contested swing states. In these states, which include Arizona, Georgia, North Carolina, Pennsylvania, and Wisconsin, the two major party candidates are polling so closely that either one has a reasonable chance of winning. (This is how Trump and Harris are polling in every key swing state.)
Unlike these swing states — which are effectively a toss-up – most states are already a virtual lock for one of the two major party candidates. So-called blue states, like Massachusetts and Vermont, are places that Kamala Harris, a Democrat, can reliably count on taking in November. Meanwhile, Donald Trump, the Republican candidate, is expected to handily win red states like Idaho and Wyoming.
These and other non-swing states are often seen as political monoliths, home to populations of like-minded voters with similar values and priorities. This, however, is an oversimplification that belies a much more nuanced reality.
In Oregon, long considered a blue state, an average of 54.4% of voters have supported the Democratic candidate across the last four presidential elections. Additionally, Oregon has gone to the Democratic candidate in every presidential election since 1984, when the GOP candidate Ronald Reagan defeated Walter Mondale, a Democrat. Barring any unforeseen shakeup, Oregon is expected to align with historical voting patterns once again in 2024 and go to Harris. (Here is a look at the 15 least popular presidents, according to Millennials.)
Despite its status as a Democratic stronghold, there are several parts of the state that have consistently broken with the prevailing political ideology in recent elections. According to voting records, there are 20 counties in Oregon where an average of at least 50% of voters have supported the Republican candidate across the last four presidential elections. In one of these counties, an average of 76.1% of voters cast ballots for the Republican candidate over the same four general elections.
These are the most Republican counties in Oregon. All historical, county-level, voting statistics are from the MIT Election Data and Science Lab’s County Presidential Election Returns 2000-2020 database, as compiled in the Harvard Dataverse, V13.
Why It Matters
Because of the electoral college system, the outcome of presidential elections often comes down to voters in just a handful of closely contested states. In contrast to these battleground states, most of the country has reliably voted either Democratic or Republican in recent presidential elections. These states include Oregon, which, barring any unforeseen shake ups in the race, is all but guaranteed to go to Harris in 2024. Still, Oregon is not the partisan monolith it is often perceived to be.
20. Coos County
- Average popular vote split in last 4 presidential elections: 40.6% Democratic; 54.5% Republican
- Popular vote split in 2020 election: 38.4% Democrat (Joe Biden); 58.9% Republican (Donald Trump)
- Popular vote split in 2016 election: 33.4% Democrat (Hillary Clinton); 57.1% Republican (Donald Trump)
- Popular vote split in 2012 election: 44.8% Democrat (Barack Obama); 51.2% Republican (Mitt Romney)
- Popular vote split in 2008 election: 46.5% Democrat (Barack Obama); 49.6% Republican (John McCain)
- County population: 64,908
19. Curry County
- Average popular vote split in last 4 presidential elections: 39.2% Democratic; 56.1% Republican
- Popular vote split in 2020 election: 40.6% Democrat (Joe Biden); 56.8% Republican (Donald Trump)
- Popular vote split in 2016 election: 34.1% Democrat (Hillary Clinton); 57.2% Republican (Donald Trump)
- Popular vote split in 2012 election: 39.6% Democrat (Barack Obama); 56.5% Republican (Mitt Romney)
- Popular vote split in 2008 election: 42.4% Democrat (Barack Obama); 53.9% Republican (John McCain)
- County population: 23,404
18. Linn County
- Average popular vote split in last 4 presidential elections: 37.1% Democratic; 57.1% Republican
- Popular vote split in 2020 election: 36.5% Democrat (Joe Biden); 59.9% Republican (Donald Trump)
- Popular vote split in 2016 election: 30.6% Democrat (Hillary Clinton); 57.0% Republican (Donald Trump)
- Popular vote split in 2012 election: 39.6% Democrat (Barack Obama); 56.3% Republican (Mitt Romney)
- Popular vote split in 2008 election: 42.6% Democrat (Barack Obama); 54.0% Republican (John McCain)
- County population: 128,598
17. Jefferson County
- Average popular vote split in last 4 presidential elections: 37.9% Democratic; 57.4% Republican
- Popular vote split in 2020 election: 36.9% Democrat (Joe Biden); 60.3% Republican (Donald Trump)
- Popular vote split in 2016 election: 31.5% Democrat (Hillary Clinton); 58.0% Republican (Donald Trump)
- Popular vote split in 2012 election: 40.4% Democrat (Barack Obama); 56.8% Republican (Mitt Romney)
- Popular vote split in 2008 election: 44.3% Democrat (Barack Obama); 52.9% Republican (John McCain)
- County population: 24,659
16. Josephine County
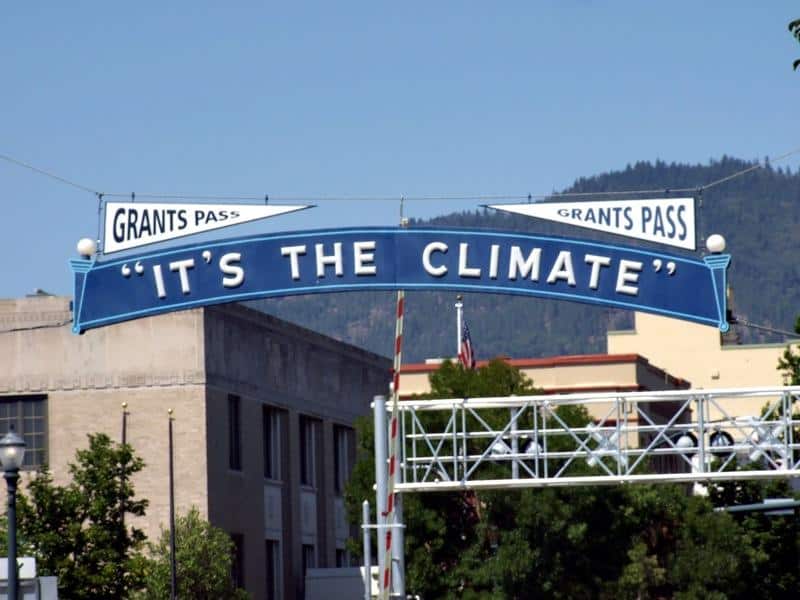
- Average popular vote split in last 4 presidential elections: 36.0% Democratic; 59.0% Republican
- Popular vote split in 2020 election: 35.7% Democrat (Joe Biden); 61.5% Republican (Donald Trump)
- Popular vote split in 2016 election: 30.2% Democrat (Hillary Clinton); 60.4% Republican (Donald Trump)
- Popular vote split in 2012 election: 37.2% Democrat (Barack Obama); 58.8% Republican (Mitt Romney)
- Popular vote split in 2008 election: 41.4% Democrat (Barack Obama); 54.6% Republican (John McCain)
- County population: 87,994
15. Umatilla County
- Average popular vote split in last 4 presidential elections: 32.8% Democratic; 62.2% Republican
- Popular vote split in 2020 election: 32.4% Democrat (Joe Biden); 64.4% Republican (Donald Trump)
- Popular vote split in 2016 election: 27.8% Democrat (Hillary Clinton); 61.8% Republican (Donald Trump)
- Popular vote split in 2012 election: 34.4% Democrat (Barack Obama); 62.1% Republican (Mitt Romney)
- Popular vote split in 2008 election: 37.2% Democrat (Barack Obama); 59.8% Republican (John McCain)
- County population: 79,904
14. Douglas County

- Average popular vote split in last 4 presidential elections: 32.0% Democratic; 63.3% Republican
- Popular vote split in 2020 election: 29.8% Democrat (Joe Biden); 67.3% Republican (Donald Trump)
- Popular vote split in 2016 election: 26.3% Democrat (Hillary Clinton); 64.6% Republican (Donald Trump)
- Popular vote split in 2012 election: 34.4% Democrat (Barack Obama); 61.8% Republican (Mitt Romney)
- Popular vote split in 2008 election: 38.3% Democrat (Barack Obama); 58.4% Republican (John McCain)
- County population: 111,322
13. Gilliam County
- Average popular vote split in last 4 presidential elections: 31.2% Democratic; 63.9% Republican
- Popular vote split in 2020 election: 27.5% Democrat (Joe Biden); 70.8% Republican (Donald Trump)
- Popular vote split in 2016 election: 23.5% Democrat (Hillary Clinton); 65.8% Republican (Donald Trump)
- Popular vote split in 2012 election: 35.0% Democrat (Barack Obama); 60.2% Republican (Mitt Romney)
- Popular vote split in 2008 election: 38.7% Democrat (Barack Obama); 58.4% Republican (John McCain)
- County population: 1,983
12. Union County

- Average popular vote split in last 4 presidential elections: 30.6% Democratic; 64.6% Republican
- Popular vote split in 2020 election: 28.5% Democrat (Joe Biden); 68.9% Republican (Donald Trump)
- Popular vote split in 2016 election: 25.1% Democrat (Hillary Clinton); 65.0% Republican (Donald Trump)
- Popular vote split in 2012 election: 32.9% Democrat (Barack Obama); 63.3% Republican (Mitt Romney)
- Popular vote split in 2008 election: 36.6% Democrat (Barack Obama); 60.2% Republican (John McCain)
- County population: 26,286
11. Wallowa County
- Average popular vote split in last 4 presidential elections: 30.2% Democratic; 65.4% Republican
- Popular vote split in 2020 election: 31.6% Democrat (Joe Biden); 66.1% Republican (Donald Trump)
- Popular vote split in 2016 election: 25.6% Democrat (Hillary Clinton); 65.2% Republican (Donald Trump)
- Popular vote split in 2012 election: 29.8% Democrat (Barack Obama); 66.7% Republican (Mitt Romney)
- Popular vote split in 2008 election: 33.4% Democrat (Barack Obama); 63.5% Republican (John McCain)
- County population: 7,439
10. Morrow County
- Average popular vote split in last 4 presidential elections: 29.0% Democratic; 65.9% Republican
- Popular vote split in 2020 election: 26.8% Democrat (Joe Biden); 70.1% Republican (Donald Trump)
- Popular vote split in 2016 election: 24.4% Democrat (Hillary Clinton); 65.3% Republican (Donald Trump)
- Popular vote split in 2012 election: 31.0% Democrat (Barack Obama); 65.2% Republican (Mitt Romney)
- Popular vote split in 2008 election: 34.7% Democrat (Barack Obama); 61.8% Republican (John McCain)
- County population: 12,140
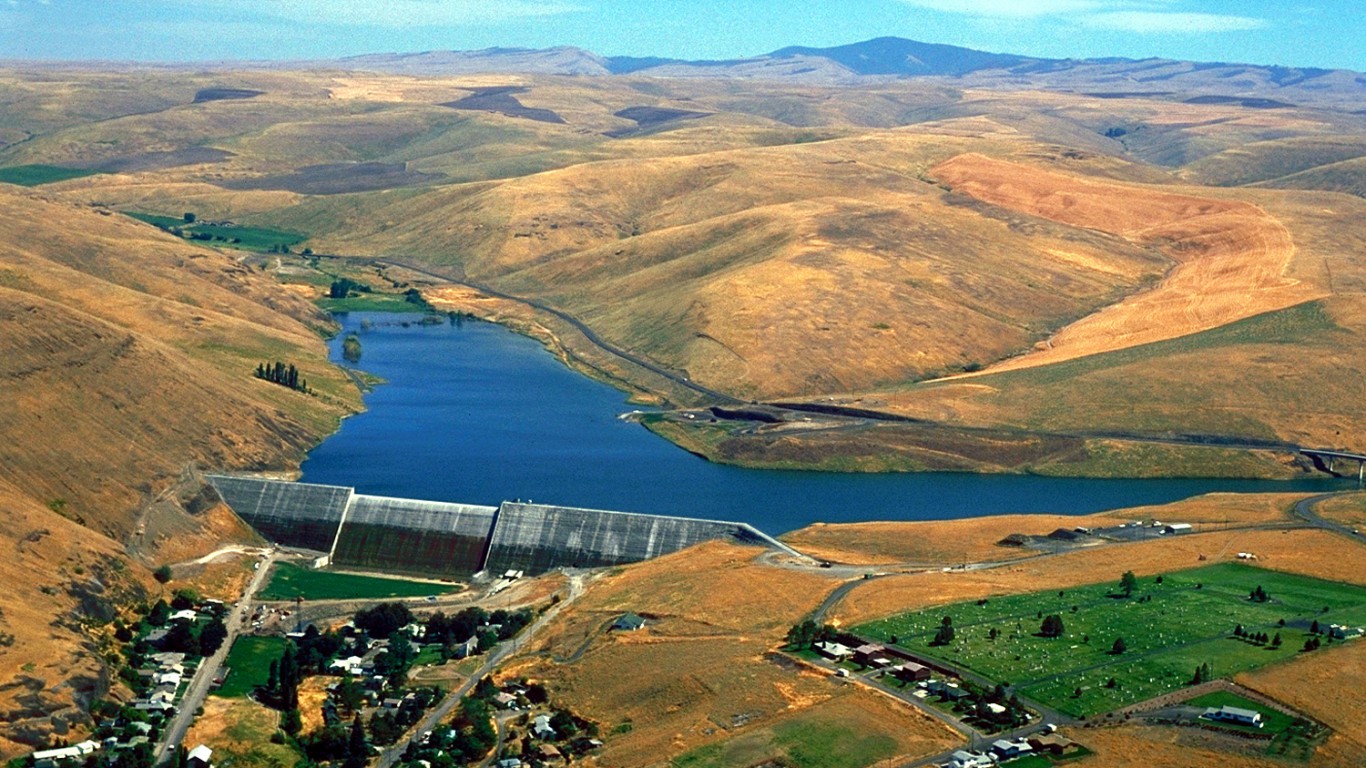
9. Klamath County
- Average popular vote split in last 4 presidential elections: 28.3% Democratic; 67.1% Republican
- Popular vote split in 2020 election: 28.3% Democrat (Joe Biden); 68.9% Republican (Donald Trump)
- Popular vote split in 2016 election: 23.6% Democrat (Hillary Clinton); 67.0% Republican (Donald Trump)
- Popular vote split in 2012 election: 29.5% Democrat (Barack Obama); 67.1% Republican (Mitt Romney)
- Popular vote split in 2008 election: 31.9% Democrat (Barack Obama); 65.0% Republican (John McCain)
- County population: 69,506
8. Wheeler County
- Average popular vote split in last 4 presidential elections: 26.6% Democratic; 67.9% Republican
- Popular vote split in 2020 election: 22.5% Democrat (Joe Biden); 73.7% Republican (Donald Trump)
- Popular vote split in 2016 election: 18.9% Democrat (Hillary Clinton); 72.2% Republican (Donald Trump)
- Popular vote split in 2012 election: 31.0% Democrat (Barack Obama); 63.5% Republican (Mitt Romney)
- Popular vote split in 2008 election: 34.6% Democrat (Barack Obama); 61.3% Republican (John McCain)
- County population: 1,407
7. Crook County
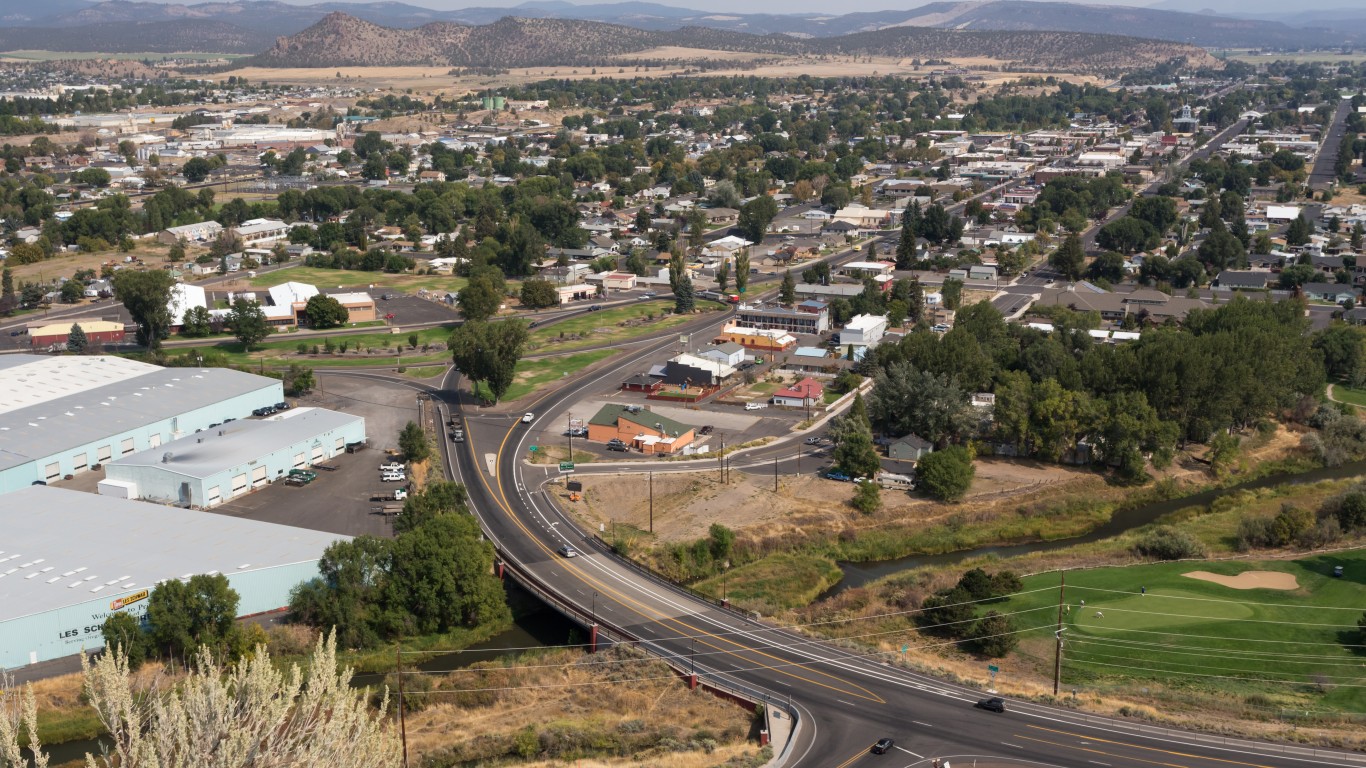
- Average popular vote split in last 4 presidential elections: 27.3% Democratic; 68.4% Republican
- Popular vote split in 2020 election: 24.6% Democrat (Joe Biden); 73.1% Republican (Donald Trump)
- Popular vote split in 2016 election: 21.7% Democrat (Hillary Clinton); 69.9% Republican (Donald Trump)
- Popular vote split in 2012 election: 30.3% Democrat (Barack Obama); 66.4% Republican (Mitt Romney)
- Popular vote split in 2008 election: 35.1% Democrat (Barack Obama); 61.5% Republican (John McCain)
- County population: 24,987
6. Malheur County
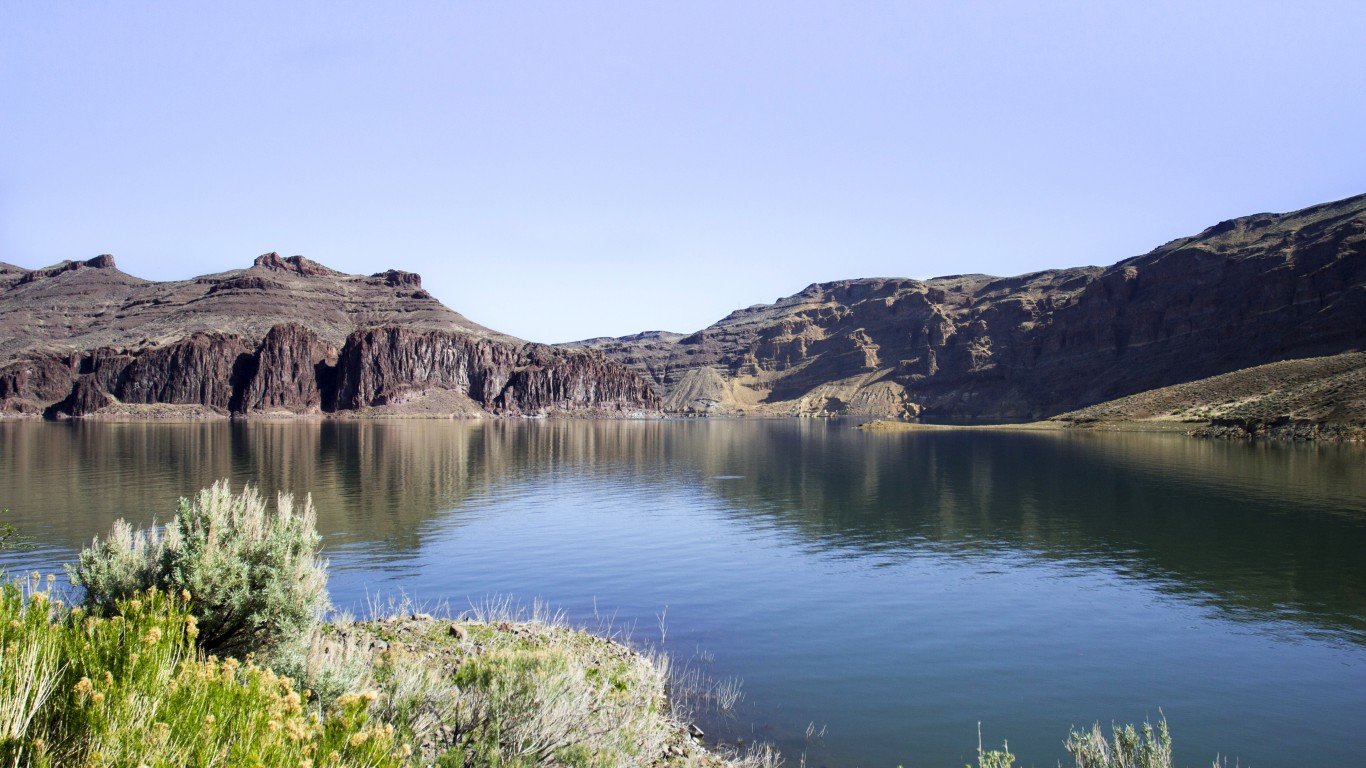
- Average popular vote split in last 4 presidential elections: 26.3% Democratic; 68.9% Republican
- Popular vote split in 2020 election: 27.6% Democrat (Joe Biden); 69.4% Republican (Donald Trump)
- Popular vote split in 2016 election: 21.5% Democrat (Hillary Clinton); 68.9% Republican (Donald Trump)
- Popular vote split in 2012 election: 27.7% Democrat (Barack Obama); 68.8% Republican (Mitt Romney)
- Popular vote split in 2008 election: 28.3% Democrat (Barack Obama); 68.6% Republican (John McCain)
- County population: 31,538
5. Sherman County
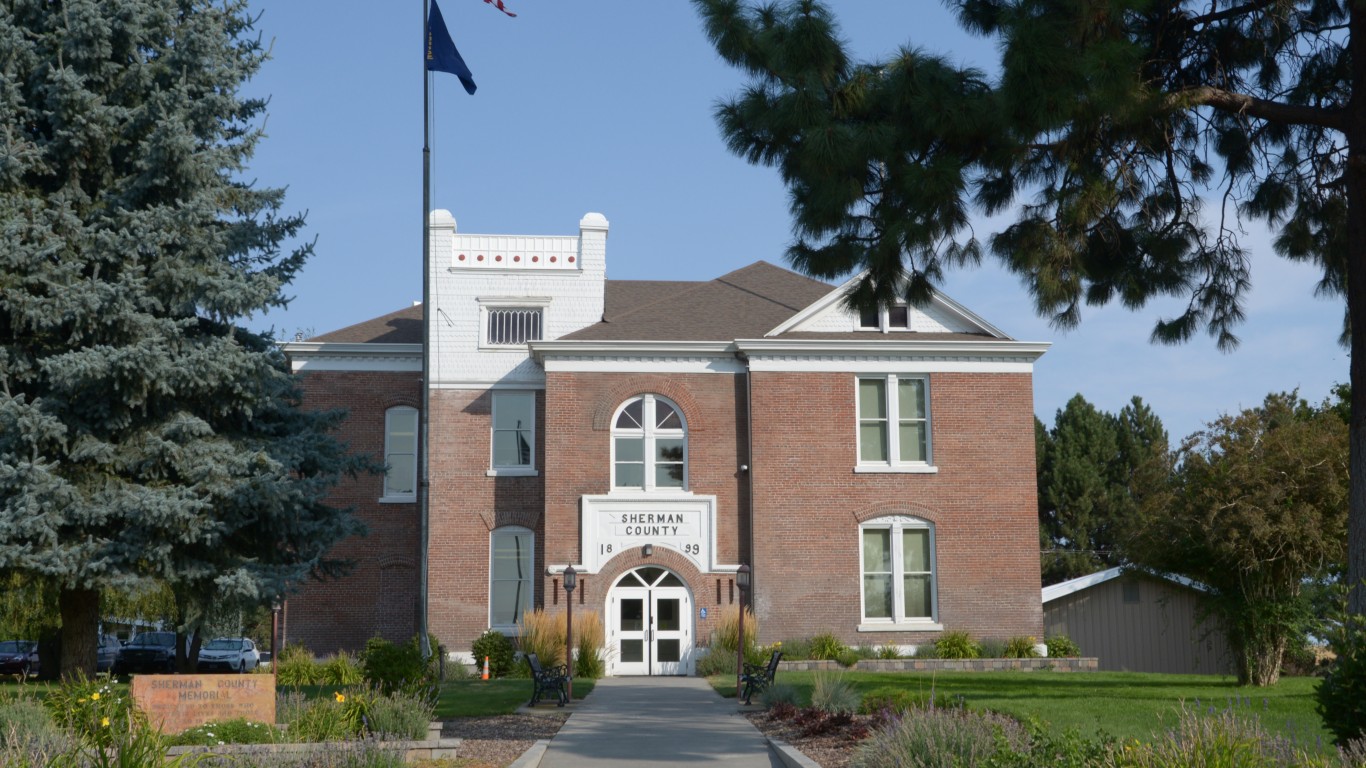
- Average popular vote split in last 4 presidential elections: 27.1% Democratic; 69.0% Republican
- Popular vote split in 2020 election: 21.5% Democrat (Joe Biden); 76.2% Republican (Donald Trump)
- Popular vote split in 2016 election: 19.9% Democrat (Hillary Clinton); 72.0% Republican (Donald Trump)
- Popular vote split in 2012 election: 31.1% Democrat (Barack Obama); 66.1% Republican (Mitt Romney)
- Popular vote split in 2008 election: 36.8% Democrat (Barack Obama); 60.6% Republican (John McCain)
- County population: 1,900
4. Baker County
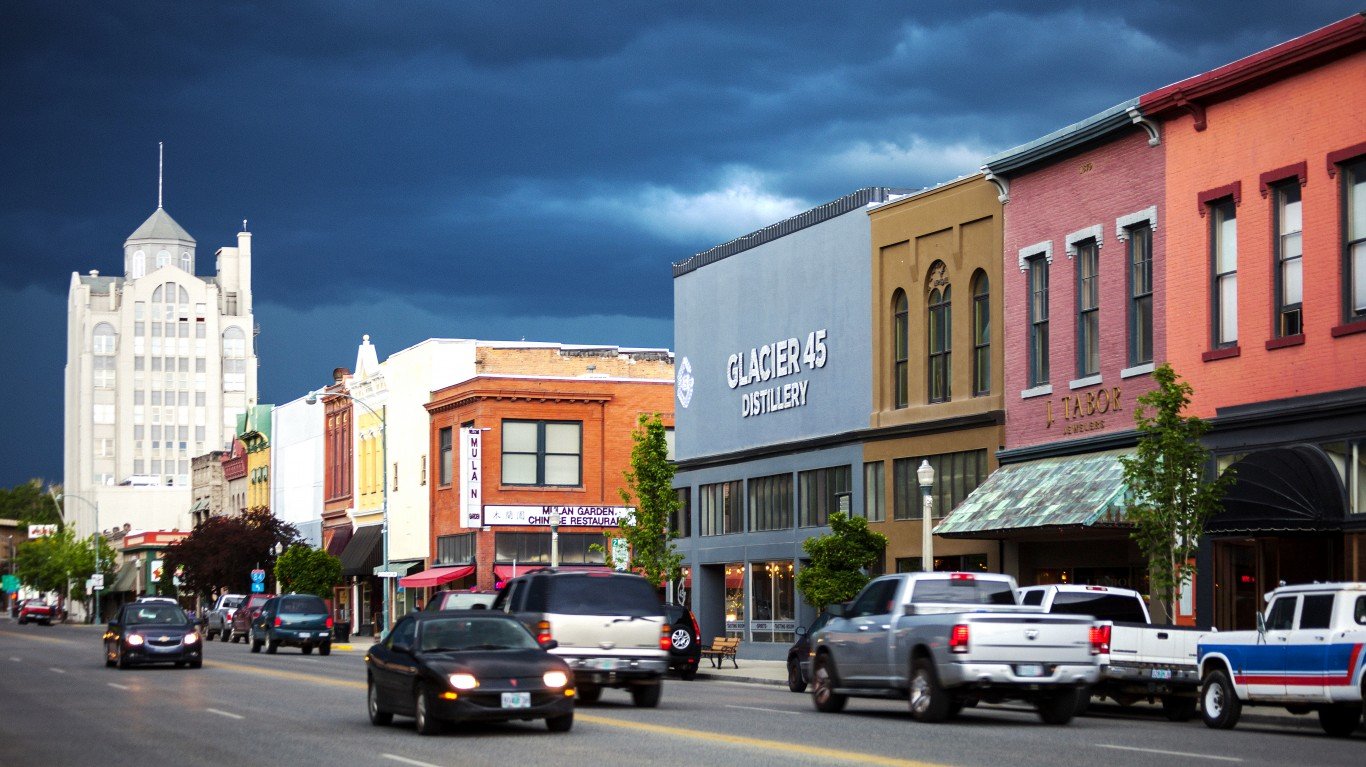
- Average popular vote split in last 4 presidential elections: 25.9% Democratic; 69.4% Republican
- Popular vote split in 2020 election: 23.6% Democrat (Joe Biden); 74.0% Republican (Donald Trump)
- Popular vote split in 2016 election: 20.5% Democrat (Hillary Clinton); 70.8% Republican (Donald Trump)
- Popular vote split in 2012 election: 28.0% Democrat (Barack Obama); 67.5% Republican (Mitt Romney)
- Popular vote split in 2008 election: 32.0% Democrat (Barack Obama); 64.4% Republican (John McCain)
- County population: 16,685
3. Harney County
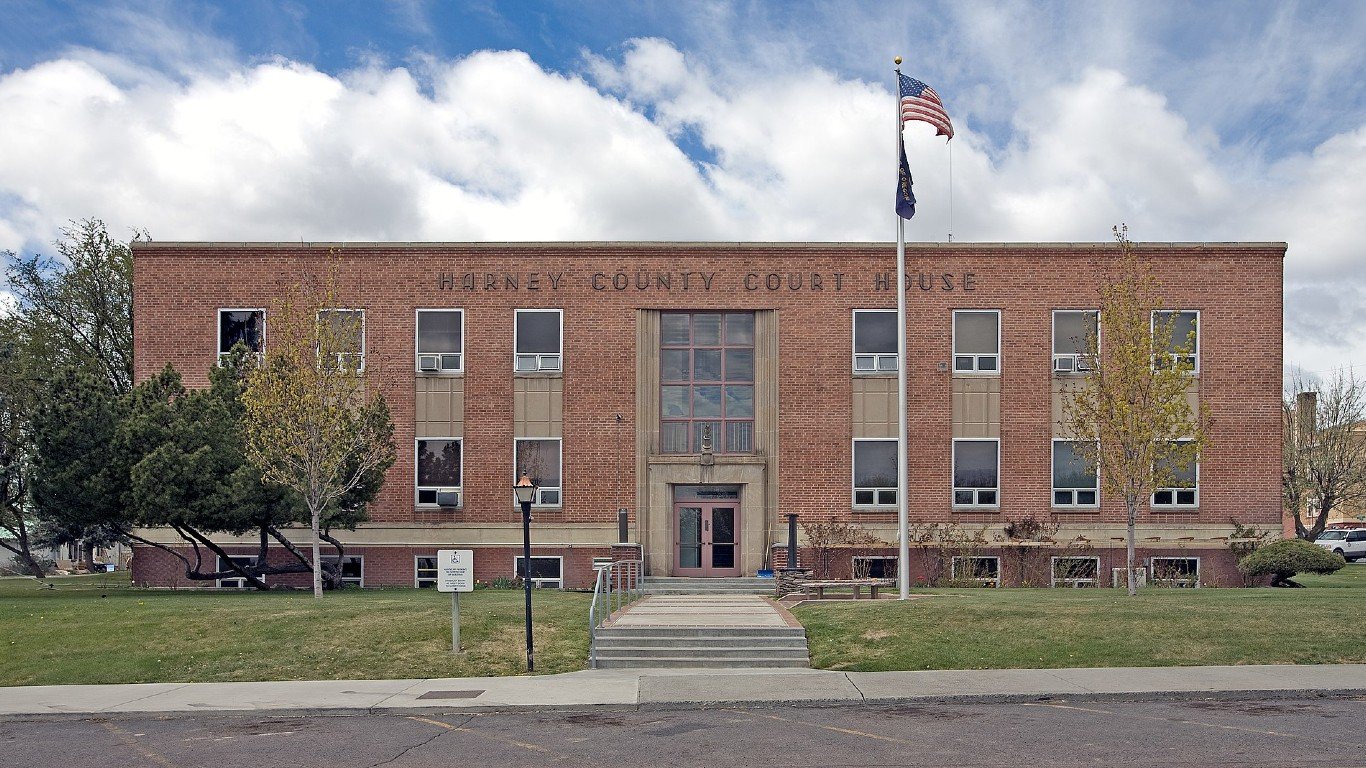
- Average popular vote split in last 4 presidential elections: 21.4% Democratic; 73.7% Republican
- Popular vote split in 2020 election: 20.0% Democrat (Joe Biden); 77.5% Republican (Donald Trump)
- Popular vote split in 2016 election: 17.2% Democrat (Hillary Clinton); 73.3% Republican (Donald Trump)
- Popular vote split in 2012 election: 23.2% Democrat (Barack Obama); 72.8% Republican (Mitt Romney)
- Popular vote split in 2008 election: 25.8% Democrat (Barack Obama); 70.5% Republican (John McCain)
- County population: 7,496
2. Grant County
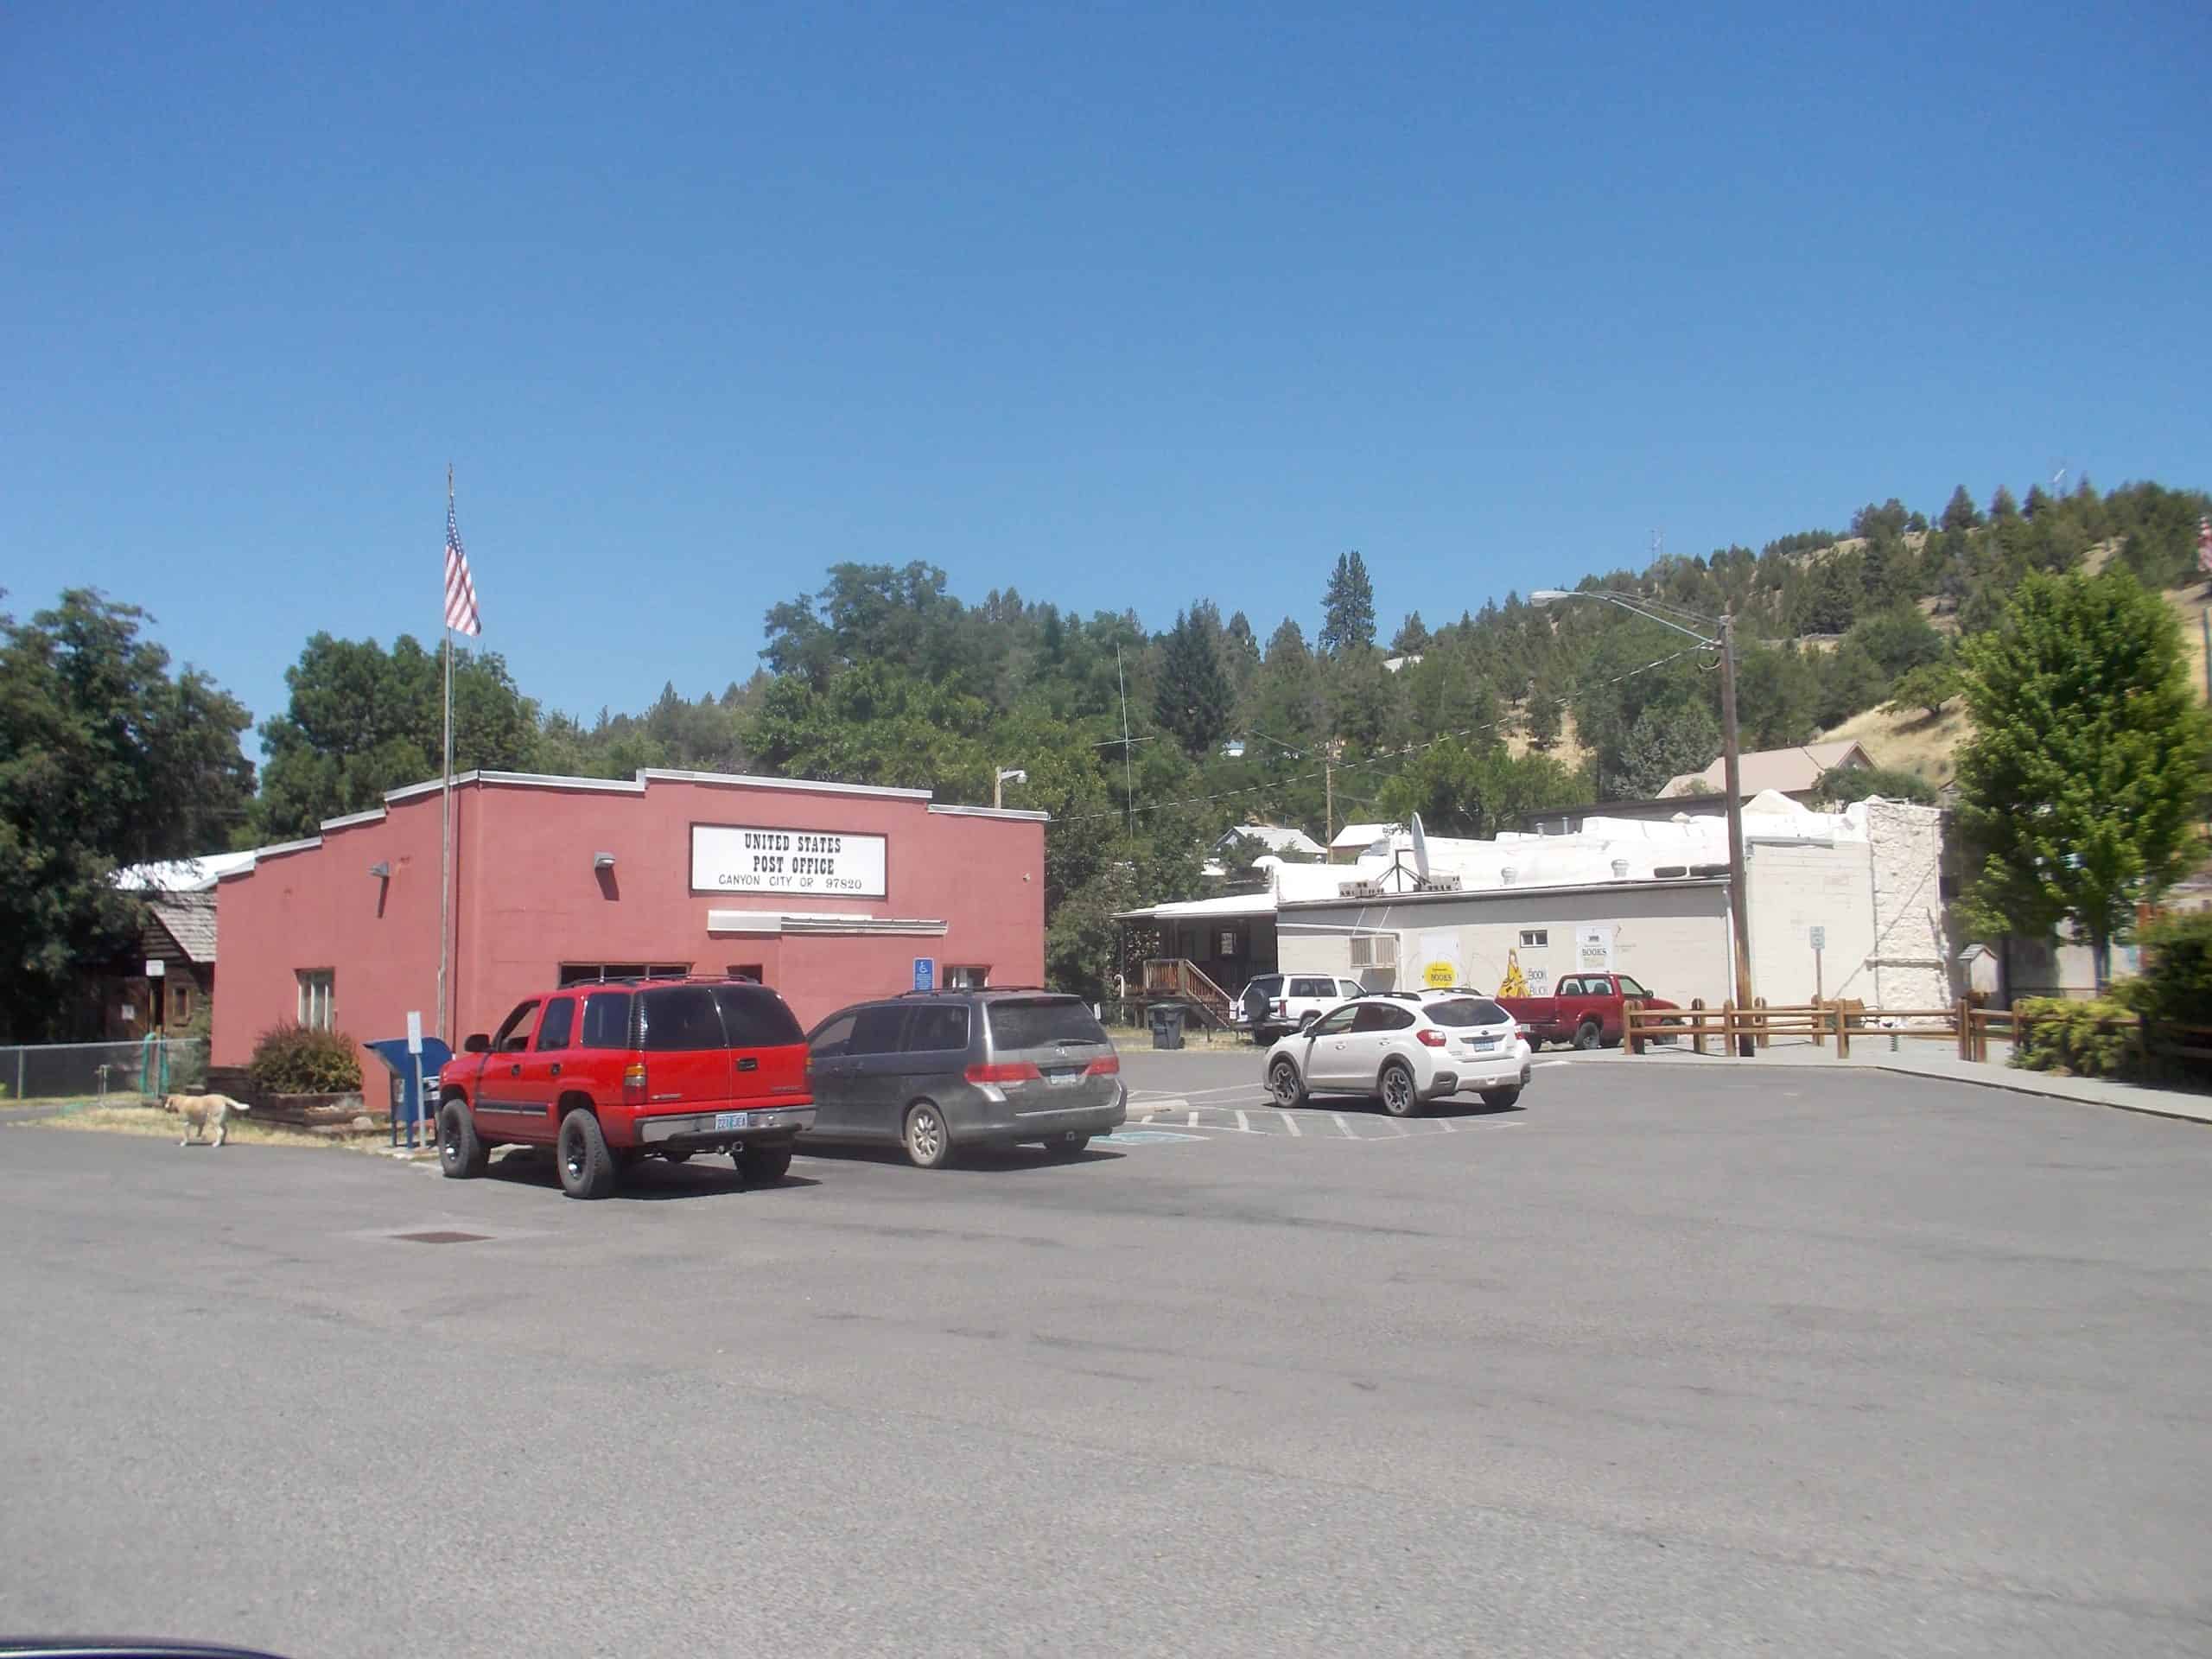
- Average popular vote split in last 4 presidential elections: 21.0% Democratic; 74.4% Republican
- Popular vote split in 2020 election: 20.2% Democrat (Joe Biden); 77.1% Republican (Donald Trump)
- Popular vote split in 2016 election: 17.0% Democrat (Hillary Clinton); 74.0% Republican (Donald Trump)
- Popular vote split in 2012 election: 21.8% Democrat (Barack Obama); 74.8% Republican (Mitt Romney)
- Popular vote split in 2008 election: 25.7% Democrat (Barack Obama); 71.2% Republican (John McCain)
- County population: 7,237
1. Lake County
- Average popular vote split in last 4 presidential elections: 20.1% Democratic; 76.1% Republican
- Popular vote split in 2020 election: 18.2% Democrat (Joe Biden); 79.5% Republican (Donald Trump)
- Popular vote split in 2016 election: 16.3% Democrat (Hillary Clinton); 76.9% Republican (Donald Trump)
- Popular vote split in 2012 election: 20.8% Democrat (Barack Obama); 75.7% Republican (Mitt Romney)
- Popular vote split in 2008 election: 25.9% Democrat (Barack Obama); 71.5% Republican (John McCain)
- County population: 8,201
Contact [email protected] for any questions or corrections.