
24/7 Wall St. Insights
- Every year, millions of immigrants move to the United States.
- Of the 2.1 million people who moved to the U.S. from abroad in 2022, hundreds of thousands now live in California — a state with a nation-leading foreign-born population.
- Also: 2 Dividend Legends to Hold Forever
Election Day is less than two weeks away, and U.S. immigration policy is top of mind for millions of Americans. But, as with most major issues in American politics, opinions about immigration are starkly divided along party lines.
A recent survey from the Pew Research Center found that immigration is a very important issue in the 2024 presidential race for 61% of registered voters. The same study also found that only 39% of voters who support Kamala Harris, a Democrat, see immigration policy as very important, compared to 82% of Republicans who support Donald Trump.
Currently, there are nearly 45.3 million immigrants living in the United States, or about 13.8% of the total U.S. population, according to 1-year estimates from the U.S. Census Bureau’s American Community Survey. Of America’s foreign-born residents, 23.7 million are naturalized U.S. citizens, 21.6 million are foreign nationals, and more than 2.1 million of all immigrants in the U.S. arrived in 2022, the most recent year of available data.
Places with large, well-established communities of immigrants are often popular destinations for new international migrants. There are currently 10,437,332 people living in California who were born in a foreign country, the most among the 50 states. While every state brought in new residents from abroad in 2022, California was, perhaps not surprisingly, an especially popular destination.
According to 5-year ACS estimates, approximately 253,300 people moved to California from a different country or U.S. territory in 2022. The largest share of new residents from abroad in California came from Asia, a region that accounted for about 47.9% of all migrants to the state in 2022. Immigrants from Central America and Europe were also relatively common, accounting for about 20.4% and 14.7% of all inbound migration, respectively. (Here is a look at the countries most immigrants in the U.S. come from.)
For any number of reasons, some parts of California are demonstrably more attractive for international migrants than others. Whether for social factors, such as the presence of large international communities, or for economic conditions, like affordable housing or the availability of well-paying jobs, 26 of the 58 counties in California with available data brought in more than 1,000 people from abroad in 2022 alone. (These immigrant populations have made it big in the U.S.)
These are the counties in California where the most immigrants are moving. All county-level migration, income, and home value data in this story are 5-year average estimates from the U.S. Census Bureau’s ACS. Supplemental data on the average unemployment rate in 2023 are from the Bureau of Labor Statistics. It is important to note that international migration totals include individuals who moved from Puerto Rico and other U.S. territories, like the Virgin Islands and American Samoa, as well as foreign countries.
Why It Matters

The United States has long been a leading destination for international migrants globally. However, fueled in part by a surge in illegal crossings along the southern border, U.S. immigration policy has emerged as one of the most contentious and polarizing issues in American politics. More than 2.1 million people migrated to the U.S. from abroad in 2022 alone, and of them, about 14.2% reside in California, according to 1-year ACS estimates.
26. Santa Cruz County

- New residents who moved from abroad in 2022: 1,346 (0.5% of current population)
- Top feeder regions in 2022: Asia: 571 migrants; Europe: 397 migrants; Central America: 270 migrants
- Citizenship and nativity demographics of county: 82.5% native-born; 7.9% foreign-born naturalized citizen; 9.6% foreign-born non-citizen
- 2023 annual unemployment rate: 5.7% (0.9 ppt. higher than statewide rate)
- Median home value: $951,300 ($292,000 higher than statewide median)
- Median household income: $104,409 ($12,504 higher than statewide median)
- Total population: 266,339
25. Placer County

- New residents who moved from abroad in 2022: 1,586 (0.4% of current population)
- Top feeder regions in 2022: Asia: 827 migrants; Europe: 383 migrants; Central America: 178 migrants
- Citizenship and nativity demographics of county: 87.9% native-born; 7.7% foreign-born naturalized citizen; 4.4% foreign-born non-citizen
- 2023 annual unemployment rate: 3.7% (1.1 ppt. lower than statewide rate)
- Median home value: $627,100 ($32,200 lower than statewide median)
- Median household income: $109,375 ($17,470 higher than statewide median)
- Total population: 403,375
24. Merced County

- New residents who moved from abroad in 2022: 1,814 (0.7% of current population)
- Top feeder regions in 2022: Central America: 1,208 migrants; Asia: 299 migrants; South America: 136 migrants
- Citizenship and nativity demographics of county: 73.4% native-born; 11.0% foreign-born naturalized citizen; 15.6% foreign-born non-citizen
- 2023 annual unemployment rate: 9.0% (4.2 ppt. higher than statewide rate)
- Median home value: $342,300 ($317,000 lower than statewide median)
- Median household income: $64,772 ($27,133 lower than statewide median)
- Total population: 278,607
23. Tulare County

- New residents who moved from abroad in 2022: 1,917 (0.4% of current population)
- Top feeder regions in 2022: Central America: 1,634 migrants; Asia: 223 migrants; Africa: 29 migrants
- Citizenship and nativity demographics of county: 77.7% native-born; 8.2% foreign-born naturalized citizen; 14.1% foreign-born non-citizen
- 2023 annual unemployment rate: 10.0% (5.2 ppt. higher than statewide rate)
- Median home value: $280,900 ($378,400 lower than statewide median)
- Median household income: $64,474 ($27,431 lower than statewide median)
- Total population: 467,882
22. Sonoma County

- New residents who moved from abroad in 2022: 2,129 (0.4% of current population)
- Top feeder regions in 2022: Central America: 569 migrants; Asia: 480 migrants; Europe: 420 migrants
- Citizenship and nativity demographics of county: 83.6% native-born; 7.8% foreign-born naturalized citizen; 8.6% foreign-born non-citizen
- 2023 annual unemployment rate: 3.6% (1.2 ppt. lower than statewide rate)
- Median home value: $748,500 ($89,200 higher than statewide median)
- Median household income: $99,266 ($7,361 higher than statewide median)
- Total population: 484,507
21. Stanislaus County

- New residents who moved from abroad in 2022: 2,179 (0.4% of current population)
- Top feeder regions in 2022: Asia: 1,368 migrants; Central America: 518 migrants; Oceania and At Sea: 127 migrants
- Citizenship and nativity demographics of county: 79.6% native-born; 9.7% foreign-born naturalized citizen; 10.7% foreign-born non-citizen
- 2023 annual unemployment rate: 6.4% (1.6 ppt. higher than statewide rate)
- Median home value: $393,300 ($266,000 lower than statewide median)
- Median household income: $74,872 ($17,033 lower than statewide median)
- Total population: 545,653
20. Marin County

- New residents who moved from abroad in 2022: 2,303 (0.9% of current population)
- Top feeder regions in 2022: Central America: 643 migrants; Asia: 590 migrants; Europe: 351 migrants
- Citizenship and nativity demographics of county: 81.2% native-born; 9.8% foreign-born naturalized citizen; 9.0% foreign-born non-citizen
- 2023 annual unemployment rate: 3.3% (1.5 ppt. lower than statewide rate)
- Median home value: $1,291,800 ($632,500 higher than statewide median)
- Median household income: $142,019 ($50,114 higher than statewide median)
- Total population: 257,915
19. Yolo County

- New residents who moved from abroad in 2022: 2,474 (1.1% of current population)
- Top feeder regions in 2022: Asia: 1,631 migrants; Europe: 350 migrants; Central America: 182 migrants
- Citizenship and nativity demographics of county: 77.8% native-born; 11.0% foreign-born naturalized citizen; 11.2% foreign-born non-citizen
- 2023 annual unemployment rate: 4.7% (0.1 ppt. lower than statewide rate)
- Median home value: $555,200 ($104,100 lower than statewide median)
- Median household income: $85,097 ($6,808 lower than statewide median)
- Total population: 215,373
18. Ventura County
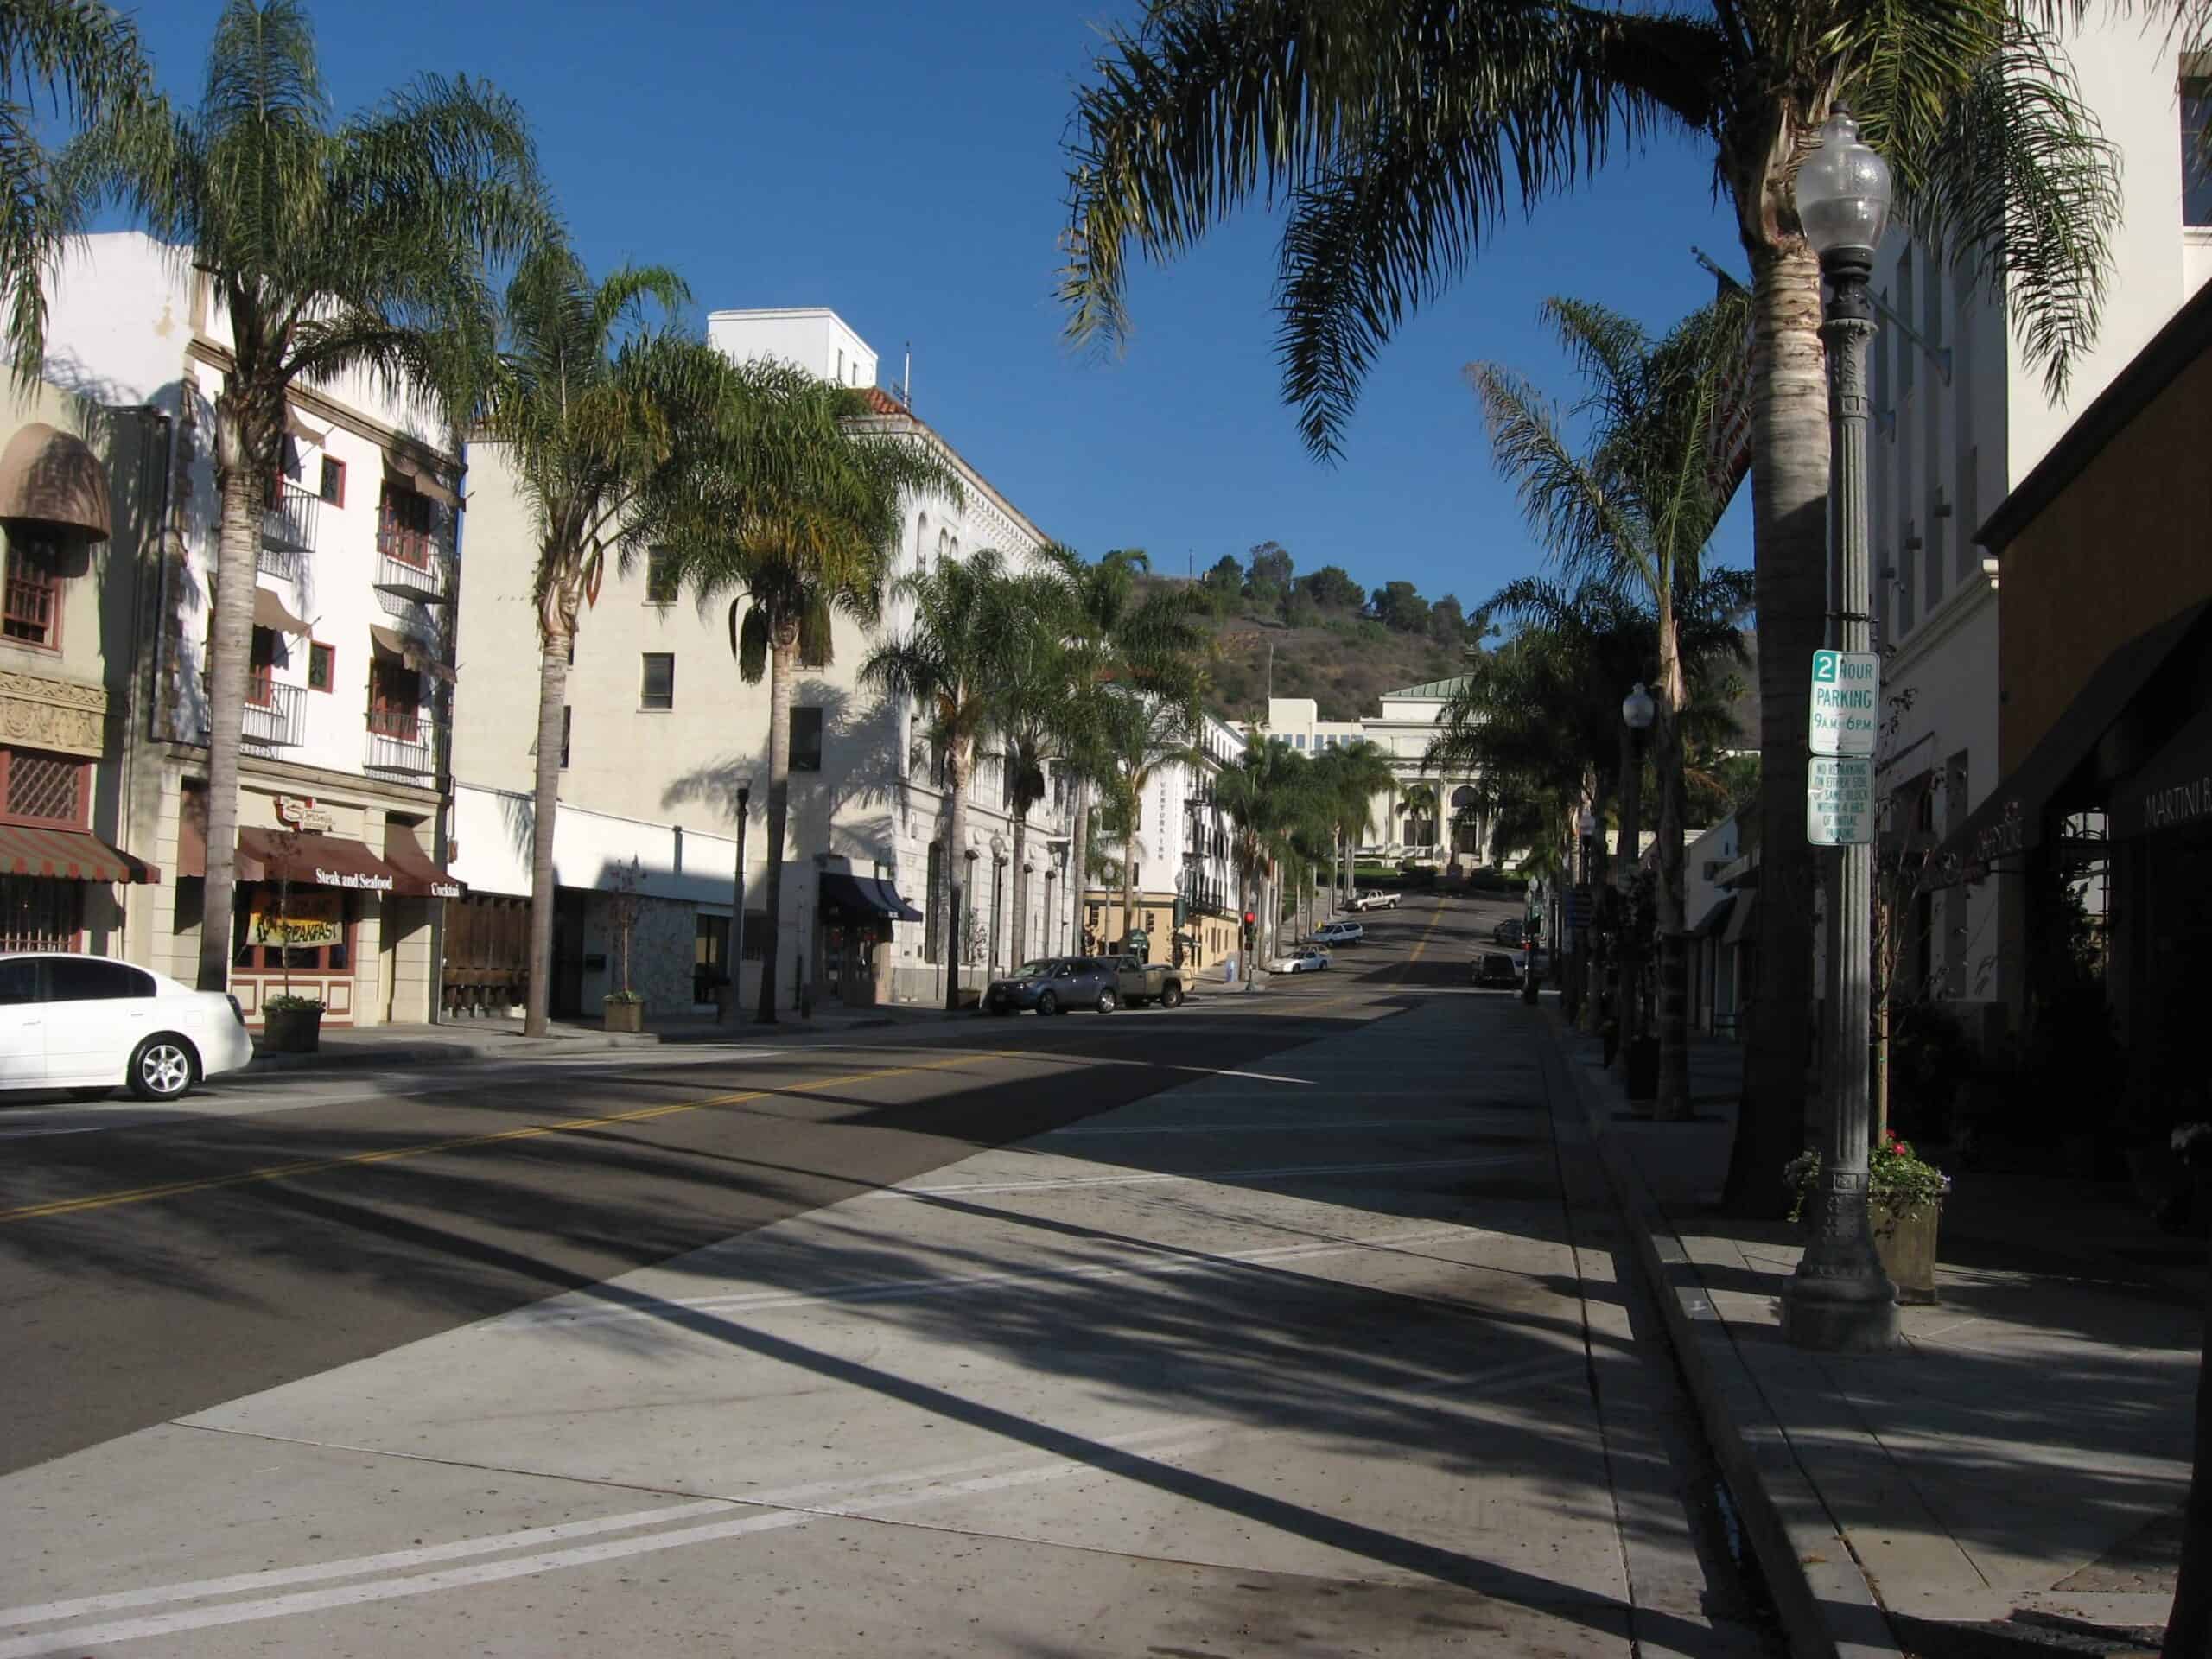
- New residents who moved from abroad in 2022: 2,802 (0.3% of current population)
- Top feeder regions in 2022: Asia: 1,016 migrants; Central America: 841 migrants; Europe: 534 migrants
- Citizenship and nativity demographics of county: 78.4% native-born; 11.4% foreign-born naturalized citizen; 10.3% foreign-born non-citizen
- 2023 annual unemployment rate: 4.3% (0.5 ppt. lower than statewide rate)
- Median home value: $719,100 ($59,800 higher than statewide median)
- Median household income: $102,141 ($10,236 higher than statewide median)
- Total population: 833,669
17. Monterey County
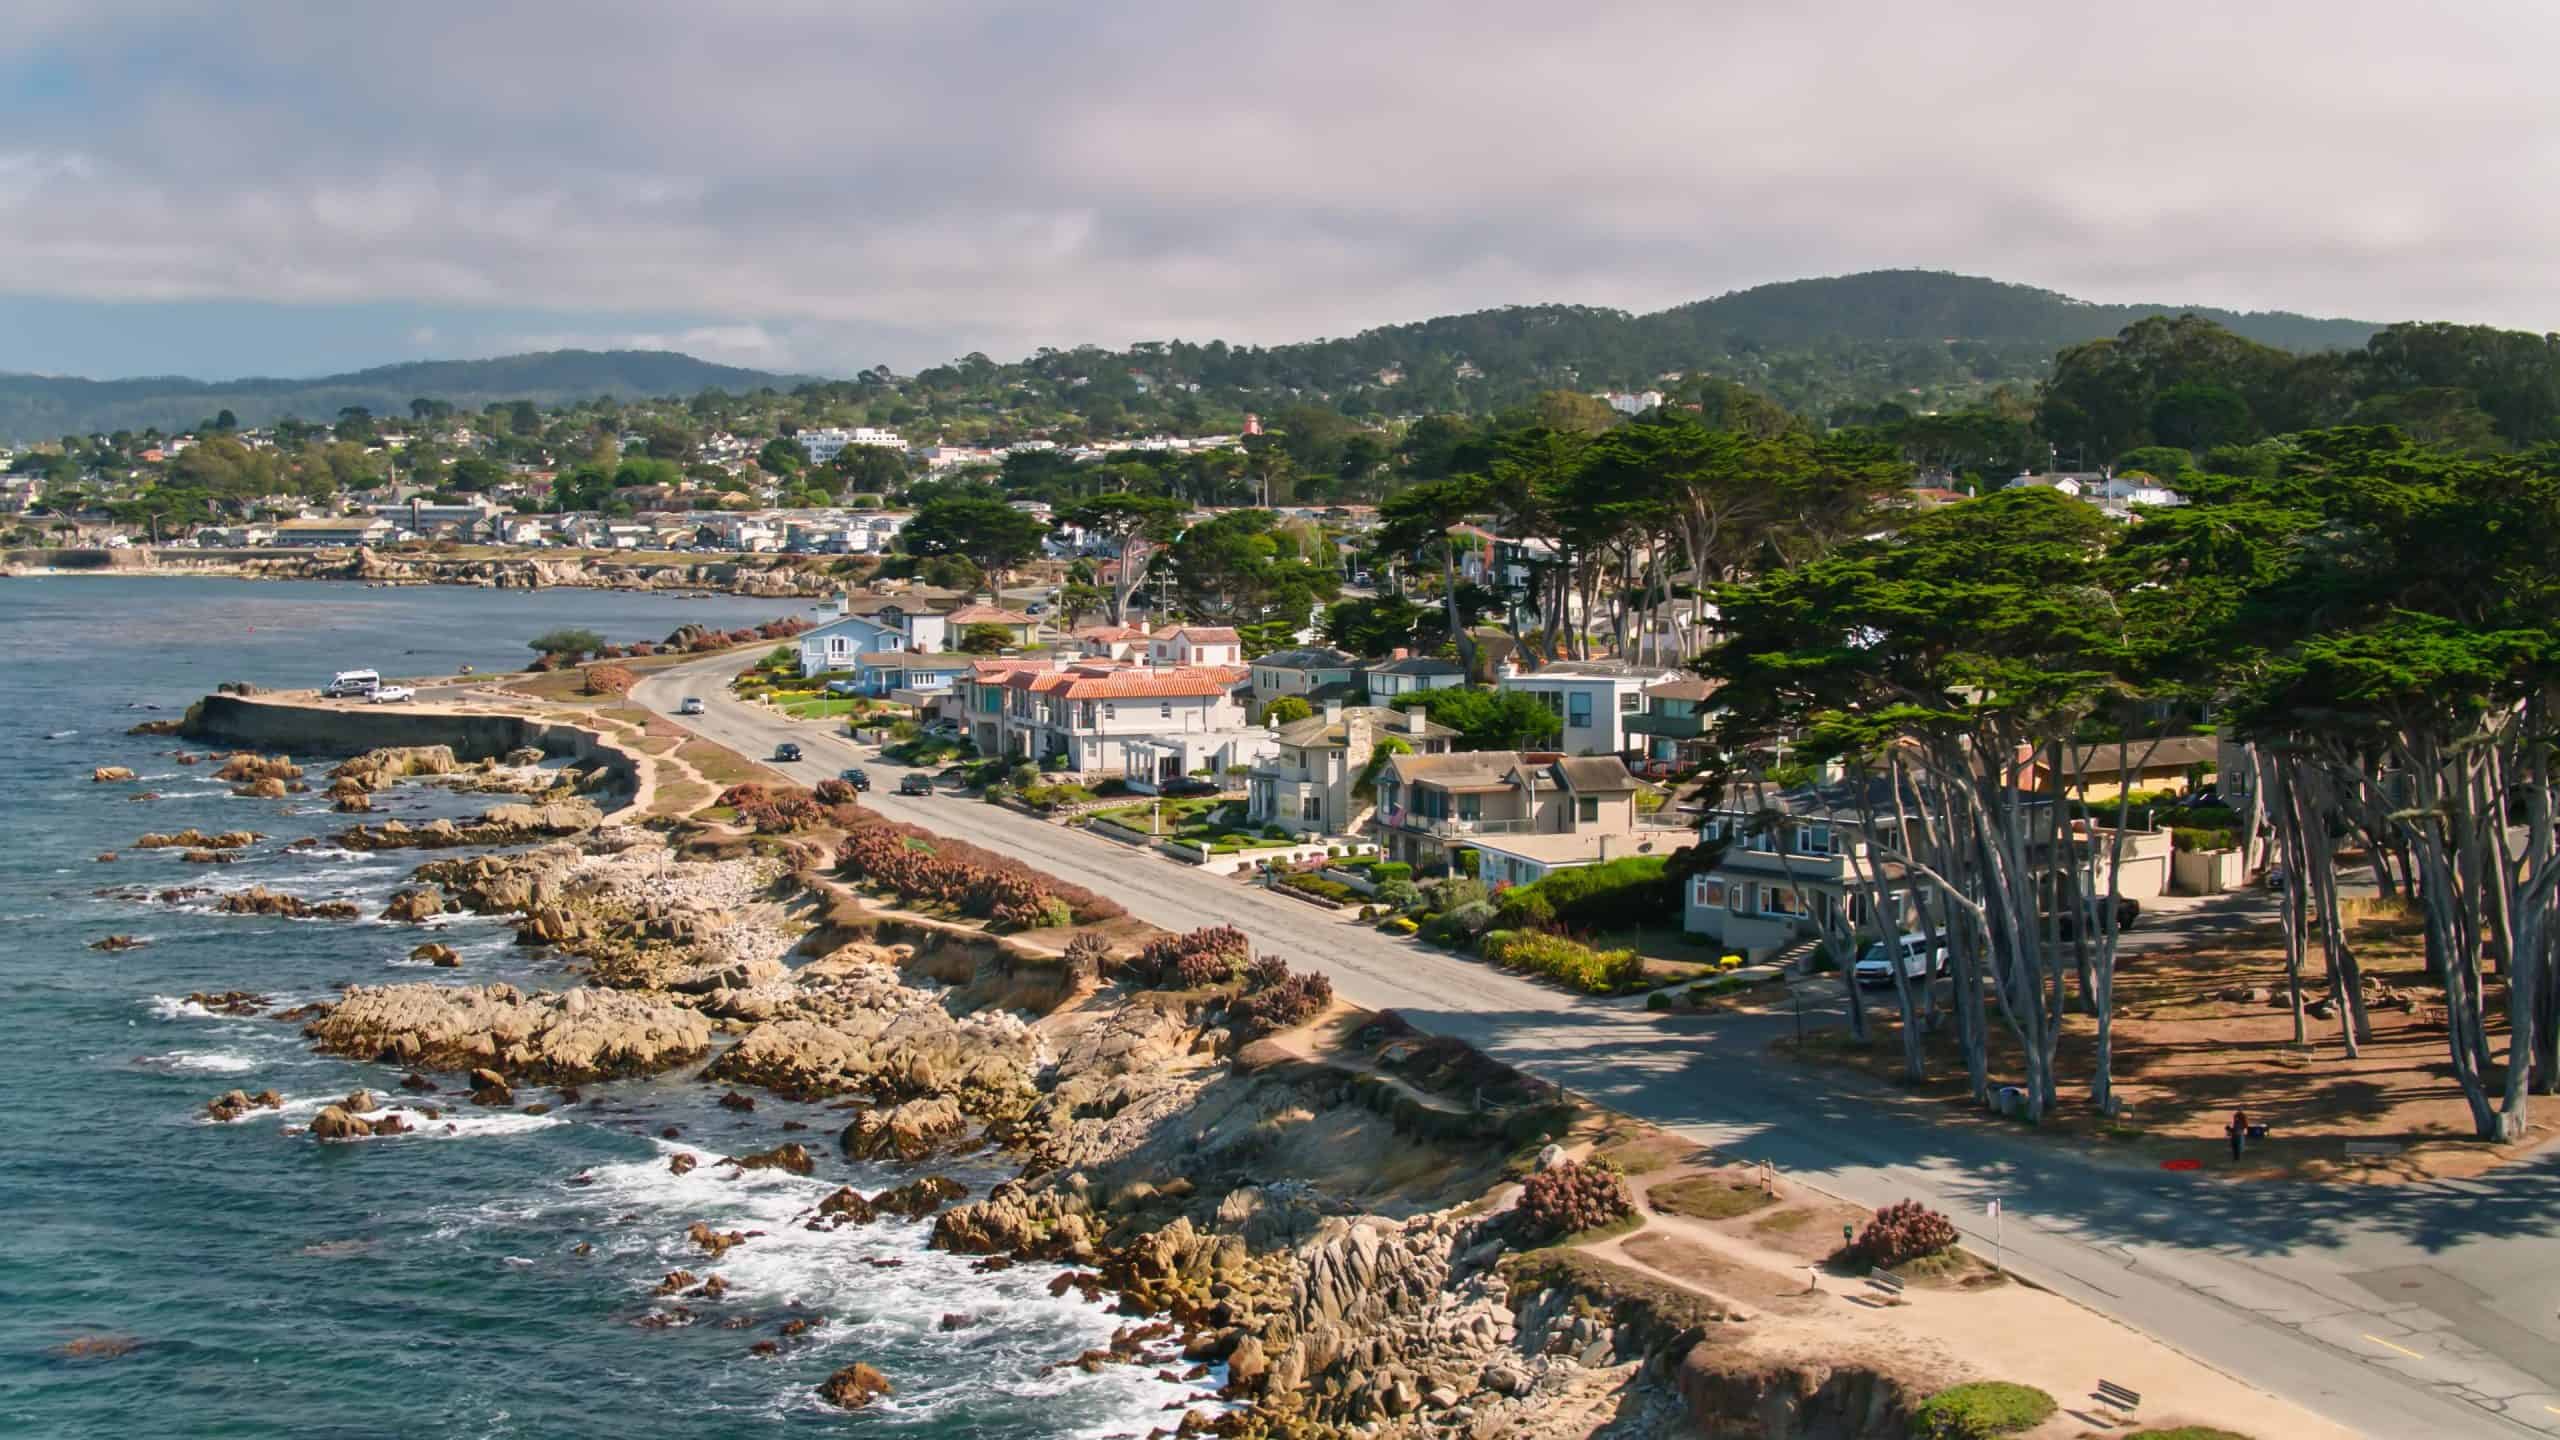
- New residents who moved from abroad in 2022: 2,843 (0.7% of current population)
- Top feeder regions in 2022: Central America: 1,119 migrants; Europe: 688 migrants; Asia: 661 migrants
- Citizenship and nativity demographics of county: 70.8% native-born; 8.7% foreign-born naturalized citizen; 20.5% foreign-born non-citizen
- 2023 annual unemployment rate: 7.0% (2.2 ppt. higher than statewide rate)
- Median home value: $683,700 ($24,400 higher than statewide median)
- Median household income: $91,043 ($862 lower than statewide median)
- Total population: 433,193
16. Solano County

- New residents who moved from abroad in 2022: 2,979 (0.7% of current population)
- Top feeder regions in 2022: Asia: 1,018 migrants; Europe: 633 migrants; Central America: 615 migrants
- Citizenship and nativity demographics of county: 80.2% native-born; 11.9% foreign-born naturalized citizen; 8.0% foreign-born non-citizen
- 2023 annual unemployment rate: 4.7% (0.1 ppt. lower than statewide rate)
- Median home value: $549,100 ($110,200 lower than statewide median)
- Median household income: $97,037 ($5,132 higher than statewide median)
- Total population: 446,502
15. Kern County

- New residents who moved from abroad in 2022: 3,097 (0.3% of current population)
- Top feeder regions in 2022: Asia: 1,091 migrants; Central America: 905 migrants; Northern North America: 497 migrants
- Citizenship and nativity demographics of county: 80.1% native-born; 7.8% foreign-born naturalized citizen; 12.1% foreign-born non-citizen
- 2023 annual unemployment rate: 8.3% (3.5 ppt. higher than statewide rate)
- Median home value: $282,800 ($376,500 lower than statewide median)
- Median household income: $63,883 ($28,022 lower than statewide median)
- Total population: 895,615
14. Fresno County
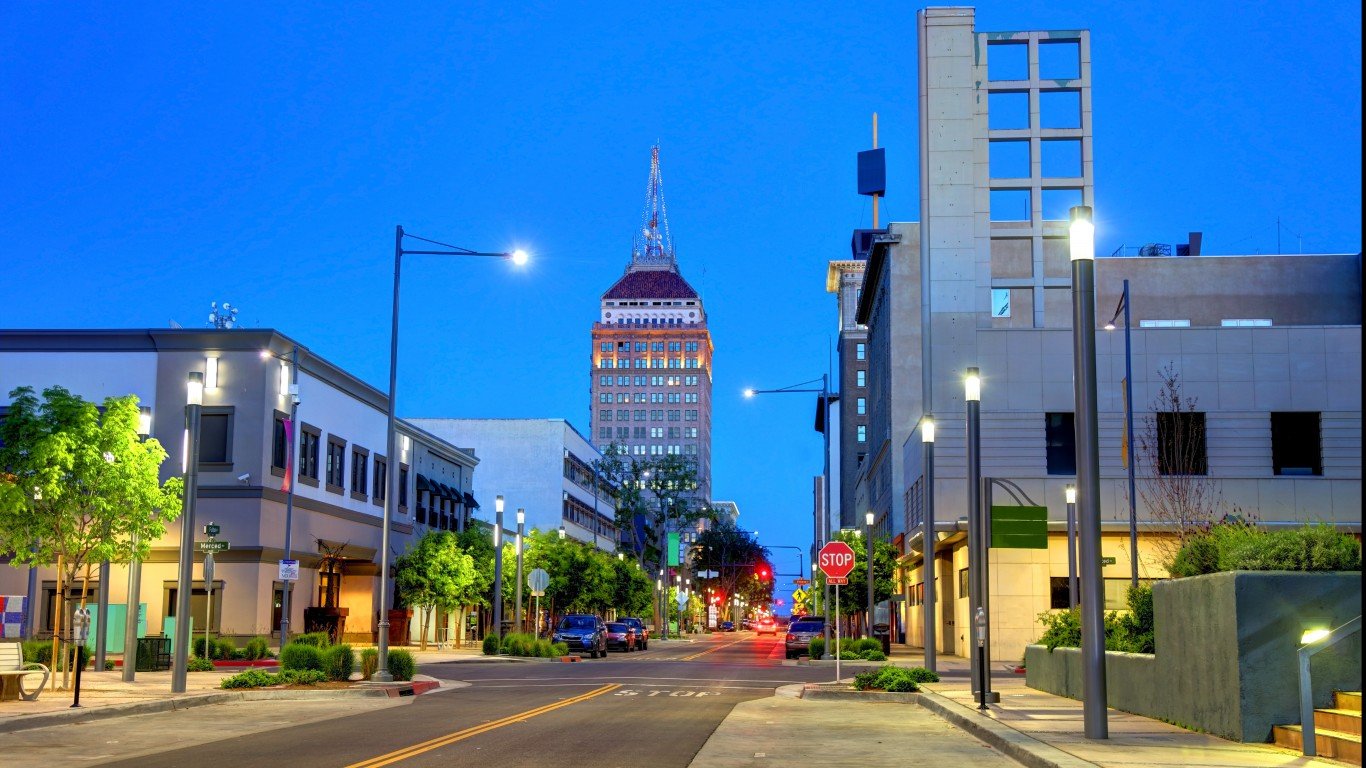
- New residents who moved from abroad in 2022: 3,335 (0.3% of current population)
- Top feeder regions in 2022: Central America: 1,517 migrants; Asia: 1,189 migrants; Europe: 353 migrants
- Citizenship and nativity demographics of county: 79.8% native-born; 9.4% foreign-born naturalized citizen; 10.8% foreign-born non-citizen
- 2023 annual unemployment rate: 7.5% (2.7 ppt. higher than statewide rate)
- Median home value: $338,200 ($321,100 lower than statewide median)
- Median household income: $67,756 ($24,149 lower than statewide median)
- Total population: 995,457
13. San Joaquin County

- New residents who moved from abroad in 2022: 3,535 (0.5% of current population)
- Top feeder regions in 2022: Central America: 1,641 migrants; Asia: 1,449 migrants; Europe: 180 migrants
- Citizenship and nativity demographics of county: 75.8% native-born; 12.5% foreign-born naturalized citizen; 11.7% foreign-born non-citizen
- 2023 annual unemployment rate: 6.2% (1.4 ppt. higher than statewide rate)
- Median home value: $462,000 ($197,300 lower than statewide median)
- Median household income: $82,837 ($9,068 lower than statewide median)
- Total population: 770,966
12. Santa Barbara County

- New residents who moved from abroad in 2022: 3,642 (0.8% of current population)
- Top feeder regions in 2022: Europe: 1,175 migrants; Asia: 1,153 migrants; Central America: 827 migrants
- Citizenship and nativity demographics of county: 77.6% native-born; 8.5% foreign-born naturalized citizen; 13.9% foreign-born non-citizen
- 2023 annual unemployment rate: 4.1% (0.7 ppt. lower than statewide rate)
- Median home value: $714,800 ($55,500 higher than statewide median)
- Median household income: $92,332 ($427 higher than statewide median)
- Total population: 440,275
11. San Bernardino County

- New residents who moved from abroad in 2022: 7,196 (0.3% of current population)
- Top feeder regions in 2022: Asia: 2,856 migrants; Central America: 2,223 migrants; Europe: 570 migrants
- Citizenship and nativity demographics of county: 78.6% native-born; 11.1% foreign-born naturalized citizen; 10.2% foreign-born non-citizen
- 2023 annual unemployment rate: 4.7% (0.1 ppt. lower than statewide rate)
- Median home value: $438,000 ($221,300 lower than statewide median)
- Median household income: $77,423 ($14,482 lower than statewide median)
- Total population: 2,155,391
10. Contra Costa County

- New residents who moved from abroad in 2022: 7,443 (0.6% of current population)
- Top feeder regions in 2022: Asia: 3,910 migrants; Europe: 1,346 migrants; Central America: 727 migrants
- Citizenship and nativity demographics of county: 74.3% native-born; 14.9% foreign-born naturalized citizen; 10.8% foreign-born non-citizen
- 2023 annual unemployment rate: 4.1% (0.7 ppt. lower than statewide rate)
- Median home value: $787,300 ($128,000 higher than statewide median)
- Median household income: $120,020 ($28,115 higher than statewide median)
- Total population: 1,150,978
9. San Mateo County

- New residents who moved from abroad in 2022: 7,971 (1.1% of current population)
- Top feeder regions in 2022: Asia: 3,477 migrants; Europe: 1,479 migrants; Central America: 956 migrants
- Citizenship and nativity demographics of county: 64.5% native-born; 21.0% foreign-born naturalized citizen; 14.5% foreign-born non-citizen
- 2023 annual unemployment rate: 3.0% (1.8 ppt. lower than statewide rate)
- Median home value: $1,441,300 ($782,000 higher than statewide median)
- Median household income: $149,907 ($58,002 higher than statewide median)
- Total population: 745,907
8. Sacramento County

- New residents who moved from abroad in 2022: 9,483 (0.6% of current population)
- Top feeder regions in 2022: Asia: 4,739 migrants; Europe: 1,958 migrants; Central America: 1,010 migrants
- Citizenship and nativity demographics of county: 78.6% native-born; 12.7% foreign-born naturalized citizen; 8.7% foreign-born non-citizen
- 2023 annual unemployment rate: 4.4% (0.4 ppt. lower than statewide rate)
- Median home value: $465,900 ($193,400 lower than statewide median)
- Median household income: $84,010 ($7,895 lower than statewide median)
- Total population: 1,563,379
7. Riverside County

- New residents who moved from abroad in 2022: 9,595 (0.4% of current population)
- Top feeder regions in 2022: Asia: 3,549 migrants; Central America: 2,511 migrants; Northern North America: 1,642 migrants
- Citizenship and nativity demographics of county: 78.2% native-born; 12.1% foreign-born naturalized citizen; 9.7% foreign-born non-citizen
- 2023 annual unemployment rate: 4.8 % (in line with statewide rate)
- Median home value: $462,900 ($196,400 lower than statewide median)
- Median household income: $84,505 ($7,400 lower than statewide median)
- Total population: 2,405,614
6. San Francisco County

- New residents who moved from abroad in 2022: 10,457 (1.2% of current population)
- Top feeder regions in 2022: Asia: 3,173 migrants; Europe: 3,117 migrants; Central America: 1,189 migrants
- Citizenship and nativity demographics of county: 65.8% native-born; 21.5% foreign-born naturalized citizen; 12.7% foreign-born non-citizen
- 2023 annual unemployment rate: 3.3% (1.5 ppt. lower than statewide rate)
- Median home value: $1,348,700 ($689,400 higher than statewide median)
- Median household income: $136,689 ($44,784 higher than statewide median)
- Total population: 843,279
5. Alameda County

- New residents who moved from abroad in 2022: 16,792 (1.0% of current population)
- Top feeder regions in 2022: Asia: 10,299 migrants; Europe: 2,233 migrants; Central America: 2,067 migrants
- Citizenship and nativity demographics of county: 66.4% native-born; 18.6% foreign-born naturalized citizen; 15.0% foreign-born non-citizen
- 2023 annual unemployment rate: 4.1% (0.7 ppt. lower than statewide rate)
- Median home value: $999,200 ($339,900 higher than statewide median)
- Median household income: $122,488 ($30,583 higher than statewide median)
- Total population: 1,647,577
4. Orange County

- New residents who moved from abroad in 2022: 23,370 (0.7% of current population)
- Top feeder regions in 2022: Asia: 14,155 migrants; Europe: 3,233 migrants; Central America: 2,716 migrants
- Citizenship and nativity demographics of county: 70.2% native-born; 17.2% foreign-born naturalized citizen; 12.5% foreign-born non-citizen
- 2023 annual unemployment rate: 3.6% (1.2 ppt. lower than statewide rate)
- Median home value: $862,900 ($203,600 higher than statewide median)
- Median household income: $109,361 ($17,456 higher than statewide median)
- Total population: 3,143,884
3. San Diego County

- New residents who moved from abroad in 2022: 26,648 (0.8% of current population)
- Top feeder regions in 2022: Asia: 12,741 migrants; Central America: 6,636 migrants; Europe: 3,371 migrants
- Citizenship and nativity demographics of county: 77.2% native-born; 13.4% foreign-born naturalized citizen; 9.5% foreign-born non-citizen
- 2023 annual unemployment rate: 3.9% (0.9 ppt. lower than statewide rate)
- Median home value: $725,200 ($65,900 higher than statewide median)
- Median household income: $96,974 ($5,069 higher than statewide median)
- Total population: 3,253,143
2. Santa Clara County

- New residents who moved from abroad in 2022: 27,985 (1.5% of current population)
- Top feeder regions in 2022: Asia: 18,458 migrants; Europe: 4,197 migrants; Central America: 2,115 migrants
- Citizenship and nativity demographics of county: 59.3% native-born; 21.7% foreign-born naturalized citizen; 19.0% foreign-born non-citizen
- 2023 annual unemployment rate: 3.5% (1.3 ppt. lower than statewide rate)
- Median home value: $1,316,800 ($657,500 higher than statewide median)
- Median household income: $153,792 ($61,887 higher than statewide median)
- Total population: 1,899,071
1. Los Angeles County

- New residents who moved from abroad in 2022: 60,179 (0.6% of current population)
- Top feeder regions in 2022: Asia: 27,484 migrants; Central America: 14,410 migrants; Europe: 7,762 migrants
- Citizenship and nativity demographics of county: 66.4% native-born; 18.2% foreign-born naturalized citizen; 15.4% foreign-born non-citizen
- 2023 annual unemployment rate: 5.0% (0.2 ppt. higher than statewide rate)
- Median home value: $732,200 ($72,900 higher than statewide median)
- Median household income: $83,411 ($8,494 lower than statewide median)
- Total population: 9,840,001
Contact [email protected] for any questions or corrections.