[cnxvideo id=”506831″ placement=”ros”]Education is the bedrock of national prosperity. Even public education is not free, however, and it is up to taxpayers to foot the bill. U.S. school districts spend an average of $11,009 per pupil a year.
A range of factors affect per pupil spending, and unique circumstances in different regions of the country mean that per pupil spending can vary drastically from one school district to another. Some districts spend more than three times the national average per student. 24/7 Wall St. reviewed spending across U.S. school districts to identify the districts that are spending the most per student. New York’s Pocantico Hills Central School District spends $63,760 per student each year, far more than any other district in the country.
In an interview with 24/7 Wall St., Michael Griffith, school finance strategist for the policy think tank the Education Commission of the States, explained that the biggest cost driver for school districts is salaries and benefits of the administration and staff. Depending on the district, as much as 65% of the annual budget goes to teachers’ compensation, and another 15% goes towards paying everybody else, from cafeteria workers to the district superintendent.
Click here to see the school districts spending the most.
How much teachers are paid depends largely on local economic forces. Certain parts of the country have higher costs of living and consequently require higher salaries to attract and retain teachers. “It’s expensive to live in the Northeast; It’s expensive to live in California; It’s expensive in Alaska — so we tend to see those places spending a higher amount per pupil,” Griffith said. Indeed, each of the 10 school districts spending the most per pupil are located either in the Northeast or Alaska.
The size of the student body also plays a significant role in per pupil spending. “When [districts] get below about 1,500 kids, (they) start showing additional costs per pupil — it really picks up when you get below 500,” Griffith explained. Below the 1,500 student threshold, teachers are instructing smaller classes, contributing to a higher overall per-student cost. Enrollment in half of the 10 school districts with the highest per pupil expenditures is less than 1,500 students.
American public schools receive on average about 9% of their revenue from federal sources, 47% from state sources, and 45% from local sources. In many of the school districts spending the most, these proportions are drastically different. According to Griffith, New York does very little to regulate how much revenue school districts can raise locally. As a result, six of the top spending districts are in wealthy neighborhoods in Long Island and Westchester County and get an outsized share — from 73% to 93% — of revenue from local sources. On the other hand, top spending school districts in Alaska, while not always affluent, receive most of their funding from state coffers padded with oil and natural gas revenue.
To identify the 10 American school districts spending the most per pupil, 24/7 Wall St. reviewed annual per pupil expenditures across the 9,605 U.S. school districts serving at least 250 students from the U.S. Census Bureau’s Survey of School System Finances. School spending figures and all other district-based values are as of the end of 2014 and come from the U.S. Census Bureau’s Survey of School System Finances. Graduation rates come from National Center for Education Statistics (NCES).
These are the school districts spending the most per student.
Correction: In a previous version of this article the source for annual per pupil expenditures was incorrectly cited as the U.S. Census Bureau’s American Community Survey (ACS). In fact, annual per pupil expenditures for U.S. school districts came from the U.S. Census Bureau’s Survey of School System Finances.
Correction: A previous version of this article incorrectly included Rivendell Interstate School District among the school districts spending the most per pupil. Due to inaccurate enrollment figures published by the Department of Education for Rivendell, which is on the border of New Hamshire and Vermont and serves both states, Rivendell’s annual per pupil expenditure was incorrect. Our coverage of the Rivendell school district has been removed from the article.
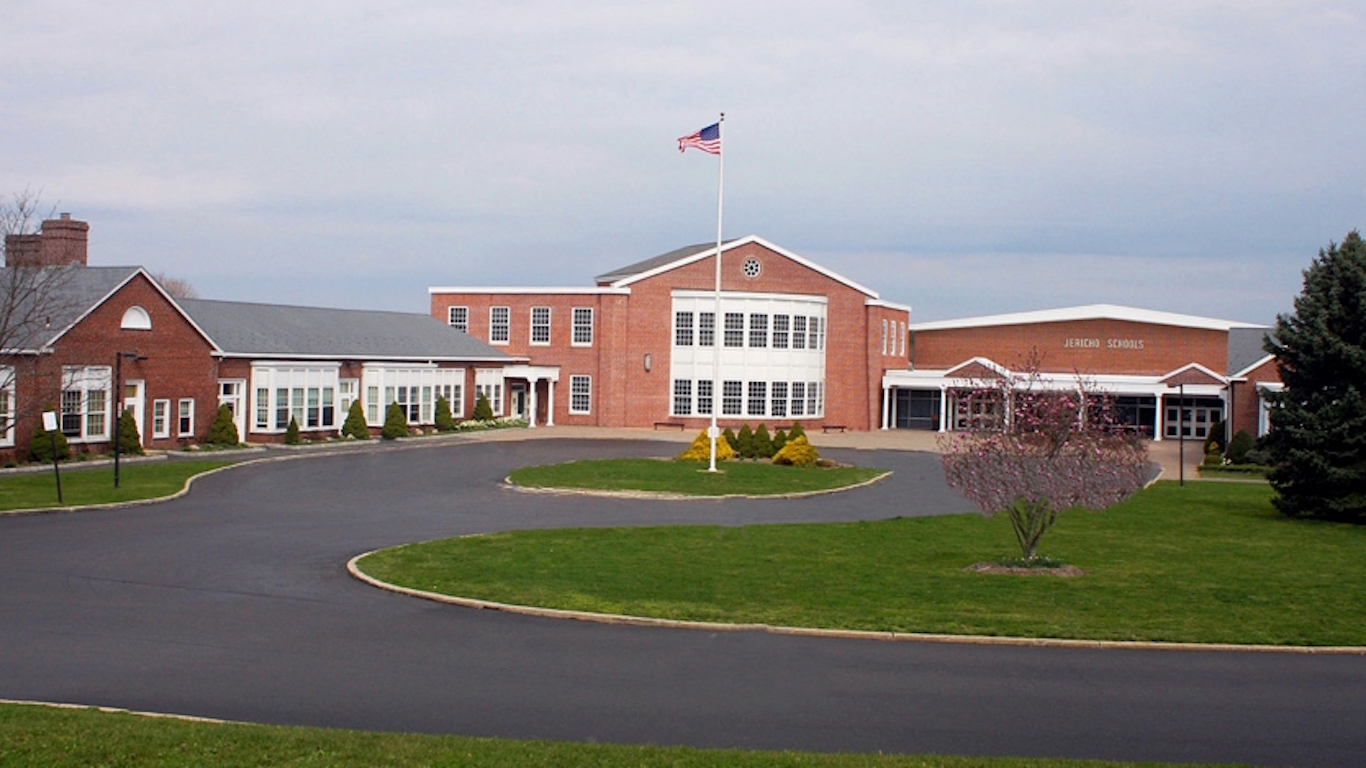
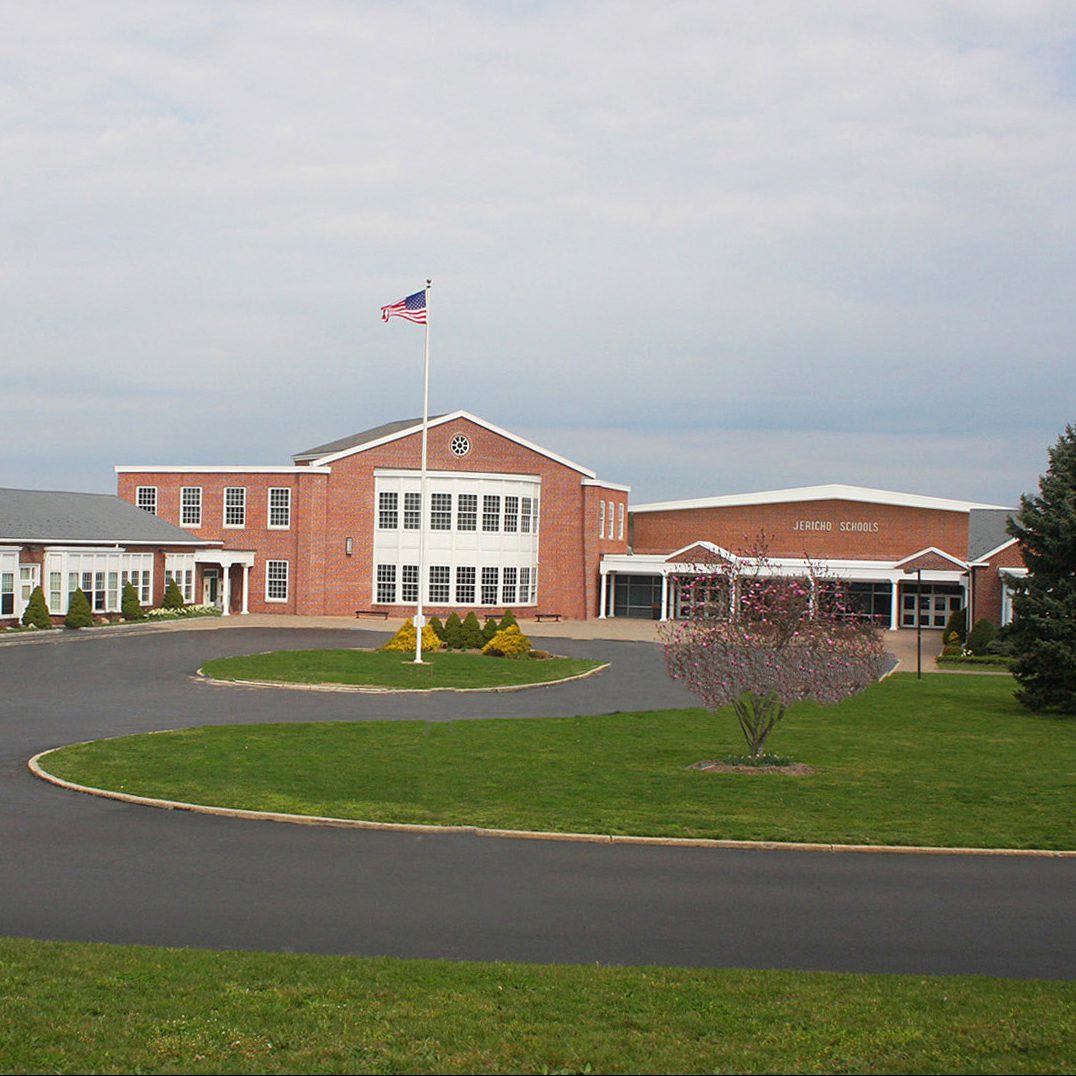
9. Jericho Union Free School District, New York
> District spending per pupil: $33,841
> State spending per pupil: $20,610
> Median household income: $150,313
> Enrollment: 2,999
New York spends more per pupil on public schools than any other state. Even within the state, certain districts spend far more than is typical. The Jericho Union Free School District on Long Island spends $33,841 per pupil annually, the 10th most of any U.S. school district and far more than the $20,610 New York school districts spend per student on average.
The vast majority of public school expenditures go towards salaries and benefits for school staff and administration. In the Jericho school district, administration salaries may have an outsized impact on the overall budget. Henry Grishman, the district superintendent, received $438,349 a year in total compensation, including benefits, more than any other district superintendent on Long Island.
[in-text-ad]

8. Greenburgh Central School District, New York
> District spending per pupil: $33,851
> State spending per pupil: $20,610
> Median household income: $94,873
> Enrollment: 1,838
Many of the New York school districts that are among the biggest per pupil spenders are in Westchester County, just north of New York City. Located in Hartsdale, Greenburgh Central School District is one of them. Like much of Westchester County, residents within the school district tend to be affluent. The typical area household earns $94,873 a year, far more than the median household income nationwide of $53,657 a year.
With a strong tax base, the Greenburgh schools get much of their revenue — nearly 73% — from local sources. In contrast, school districts nationwide get an average of about 45% of funding from local sources.

7. Bering Strait School District, Alaska
> District spending per pupil: $34,352
> State spending per pupil: $18,416
> Median household income: $35,495
> Enrollment: 1,904
Many school districts in Alaska have to spend more for basic services, such as heating and electricity, solely because of geography and climate. The Bering Strait School District is no exception. The average daily temperature drops below 40 degrees fahrenheit nine months out of the year. Due in part to extreme weather driving up costs, the district spends $34,352 per student per year, more than all but half a dozen other U.S. school districts.
Incomes are relatively low in the Bering Strait School District. As a result, area schools are primarily funded by the state and by the federal government. Only 4.2% of the district’s revenue comes from local sources. In stark contrast, districts nationwide derive an average of 44.7% of revenue from local sources.
[in-text-ad]

6. Southampton Union Free School District, New York
> District spending per pupil: $34,704
> State spending per pupil: $20,610
> Median household income: $88,239
> Enrollment: 1,613
Located on the south shore of Long Island, Southampton is a relatively affluent community that spends a great deal on public education. The typical area household earns $88,239 a year, roughly $35,000 more than the typical American household. With higher incomes, the school district has a strong tax base to draw from. The Southampton district spends $34,704 per student annually, more than three times the average amount spent across public schools nationwide. Slightly more than 86% of the district’s revenue comes from local sources, nearly double the proportion the typical American district collects from local coffers.
Earlier this year, the district’s superintendent, Dr. Scott Farina, stepped down from his post amidst public scandal, including multiple allegations of financial misconduct.

5. Montauk Union Free School District, New York
> District spending per pupil: $35,821
> State spending per pupil: $20,610
> Median household income: $73,000
> Enrollment: 358
The Montauk Union Free School District spends $35,821 per student per year, more than all but four other school districts nationwide. Like many other New York school districts with similarly high per pupil budgets, Montauk has an exceptionally strong tax base. The typical area household earns $73,000 a year, nearly $20,000 more than the typical American household.
Partially because of the area’s relative affluence, the district receives a relatively small share of its funding from state and federal coffers. Less than 1% of district revenue comes from the federal government and only 6.3% comes from the state. Nationwide, districts receive an average of 8.6% of their revenue from the federal government and 46.7% from their respective state.
4. North Slope Borough School District, Alaska
> District spending per pupil: $36,981
> State spending per pupil: $18,416
> Median household income: $74,609
> Enrollment: 2,006
The North Slope Borough School District spends $36,981 per student per year, more than three times the typical amount spent nationwide. The nation’s northernmost school district is also the largest in the country by area, covering roughly 89,000 square miles. Much of the per student spending in the district is likely necessitated by to geography and climate. Challenges related to student transportation, lighting, and heating likely make basic public school services abnormally expensive in North Slope.
The school district’s graduation rate demonstrates the complicated relationship between investment and outcomes in the realm of public education. Despite spending more per student each year than only three other districts nationwide, North Slope’s high school graduation rate is only 45%-49%, well below the nationwide 82.3% rate.
[in-text-ad]

3. Island Park Union Free School District, New York
> District spending per pupil: $37,757
> State spending per pupil: $20,610
> Median household income: $70,771
> Enrollment: 692
The median household income in the Island Park Union Free School District is $70,771 a year, far higher than the $53,657 the typical American household earns a year. Like many other affluent New York school districts spending relatively large sums on their students, a disproportionate share of the district’s funding comes from local taxes. Meanwhile, only 11.0% of the district’s funding comes from state coffers, a considerably smaller share than the 46.7% the average school district gets from its respective state government.

2. Lake And Peninsula School District, Alaska
> District spending per pupil: $43,256
> State spending per pupil: $18,416
> Median household income: $47,143
> Enrollment: 363
The typical household in the Lake And Peninsula School District earns $47,143 a year, considerably less than the statewide median income of $71,583. Despite the relatively weak tax base, the school district spends $43,256 a year per student, more than all but one other school district in the United States. Because local residents do not have the the income to fund area schools, a disproportionate share of the district’s budget comes from state and federal coffers. Only 22.1% of the budget comes from local sources, less than half the share school districts typically receive from local taxes. Meanwhile, 17.5% of the district’s revenue comes from the federal government, more than double the proportion school districts typically get from Washington.
1. Pocantico Hills Central School District, New York
> District spending per pupil: $63,760
> State spending per pupil: $20,610
> Median household income: $99,737
> Enrollment: 287
New York spends more per pupil on public schools than any other state in the country. It is perhaps no surprise that the state is also home to the nation’s highest spending school district. The Pocantico Hills Central School District spends $63,760 per student each year, nearly six times the amount the typical American school district spends and more than $20,000 more than the second highest spending district.
Low enrollment and a strong local tax base largely explain the high per pupil spending in Pocantico Hills. The typical household in the school district earns nearly $100,000 a year, far more than the $53,657 national median household income. The high tax revenue collected in the area is spread across a relatively small student body. There are only 287 students in the school district, well below the 1,500 student threshold that typically represents an efficient economy of scale.
Contact [email protected] for any questions or corrections.