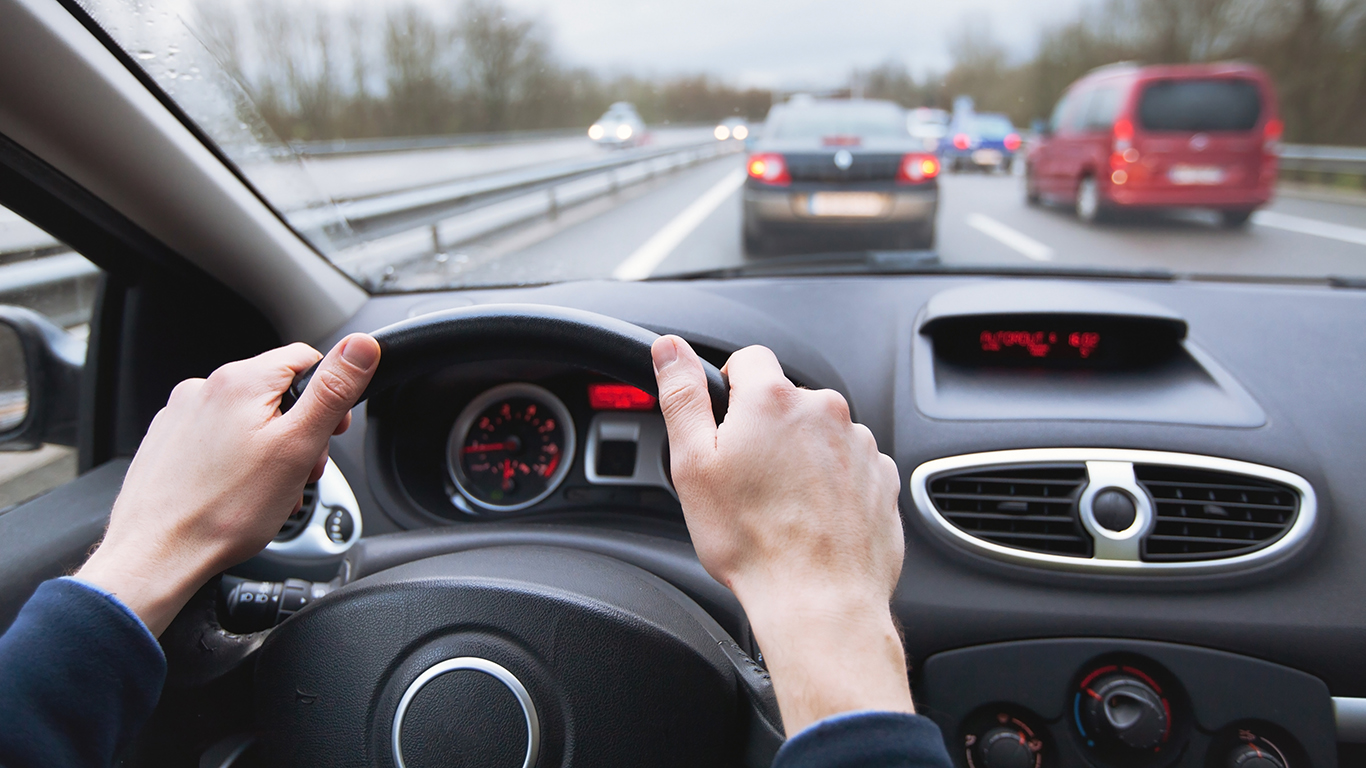
American commuters spend an average of 27 minutes getting to work. For the typical nine-to-fiver, time spent commuting adds up to about four and a half hours a week and 18 hours a month. For the vast majority of commuters who are not walking or biking, it is not only the time that adds up but costs too — and in many parts of the country, transportation is the highest line-item expense in the typical adult’s monthly budget.
In addition to commuting, transportation expenses include travel for any purpose, such as quick trips to the grocery store or taking the subway downtown to catch a concert. Transportation costs can therefore include fuel, public transit fare, and the costs of automobile ownership such as maintenance and insurance. Distance and frequency of travel are also factors in the overall cost of transportation.
24/7 Wall St. identified the cities with the most expensive transportation by reviewing average monthly transportation costs for a single adult from the Economic Policy Institute’s Family Budget Calculator. EPI is a nonprofit, nonpartisan think tank. Across all U.S. metro areas, transportation costs for an individual vary considerably, from $435 a month to over $1,000 a month.
While there is a wide range in transportation costs nationwide, they are not usually the drivers of differences in overall cost of living. The cost of housing and childcare tend to vary much more, while in the vast majority of U.S. metro areas, the monthly average falls between $800 and $900.
The high costs of motor vehicle ownership account for most of a given city’s transportation costs. In metro areas with robust public transit infrastructure — which give many residents the option to not own a car — average monthly transit costs tend to be lower.
Click here to see the cities with the most expensive transportation.
Click here to read our detailed findings and methodology.
28. Greeley, CO
> Monthly transportation cost: $902
> Daily vehicle miles travelled: 18.3 per person
> Avg. commute time: 27.6 minutes
> Avg. cost of gas: $2.75 per gallon
> Commuters biking or walking to work: 2.1%
[in-text-ad]
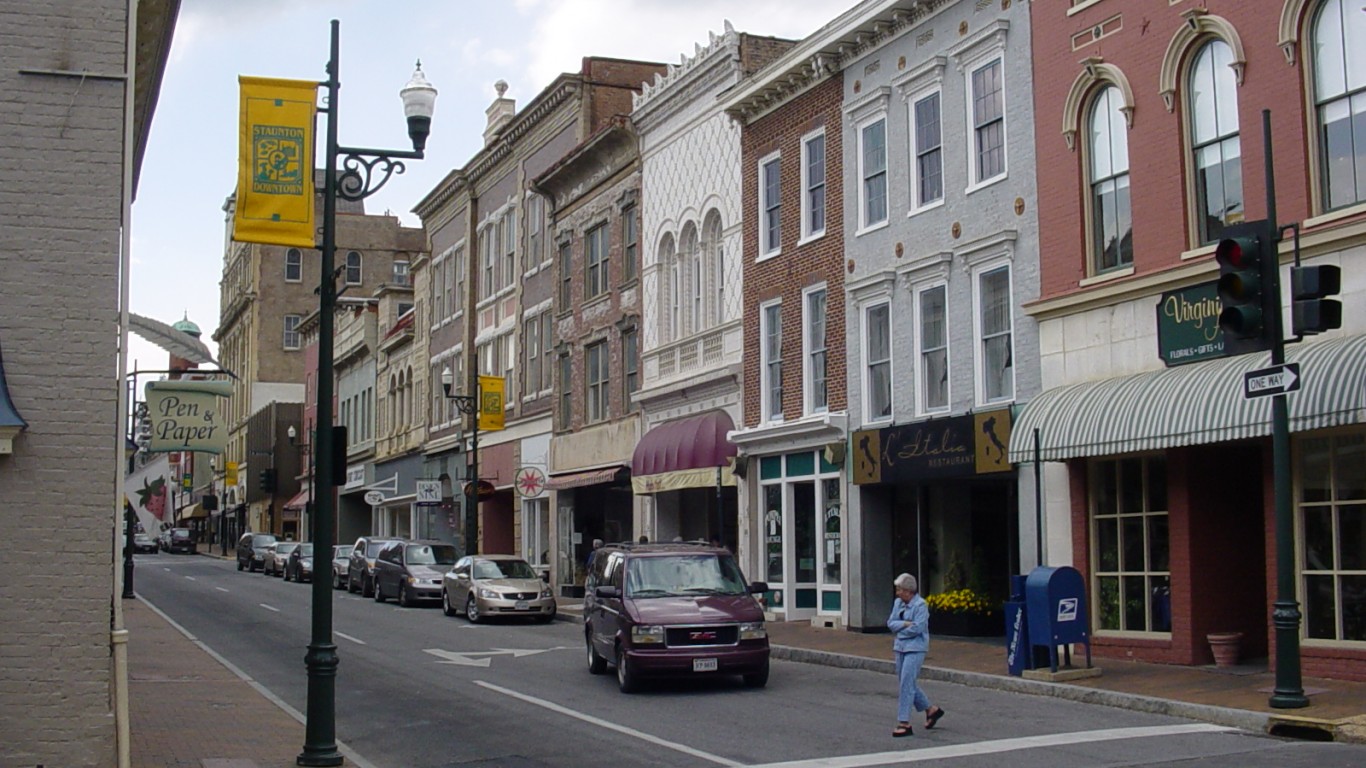
27. Staunton-Waynesboro, VA
> Monthly transportation cost: $903
> Daily vehicle miles travelled: 28.5 per person
> Avg. commute time: 24.0 minutes
> Avg. cost of gas: $2.50 per gallon
> Commuters biking or walking to work: 1.3%
[recirclink id=488456]
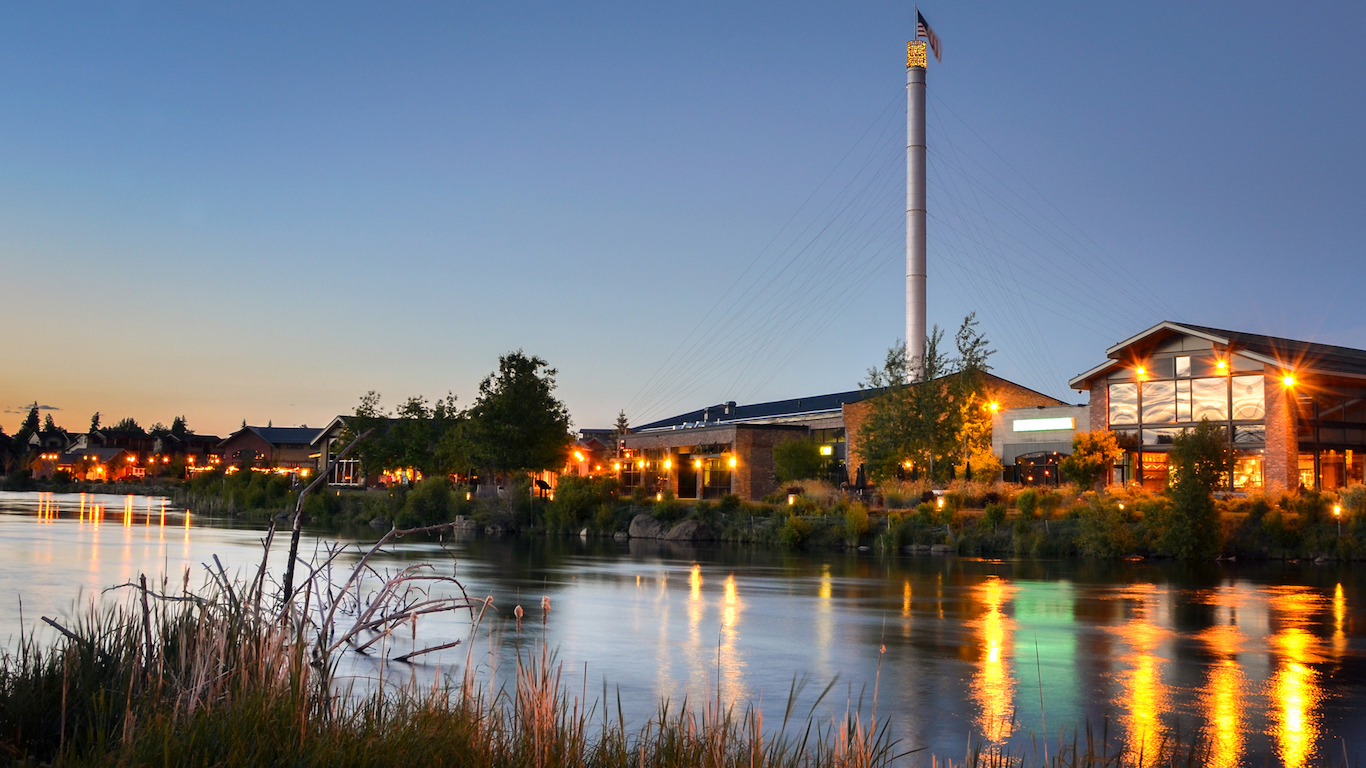
26. Bend-Redmond, OR
> Monthly transportation cost: $903
> Daily vehicle miles travelled: 19.1 per person
> Avg. commute time: 19.8 minutes
> Avg. cost of gas: $2.82 per gallon
> Commuters biking or walking to work: 2.8%
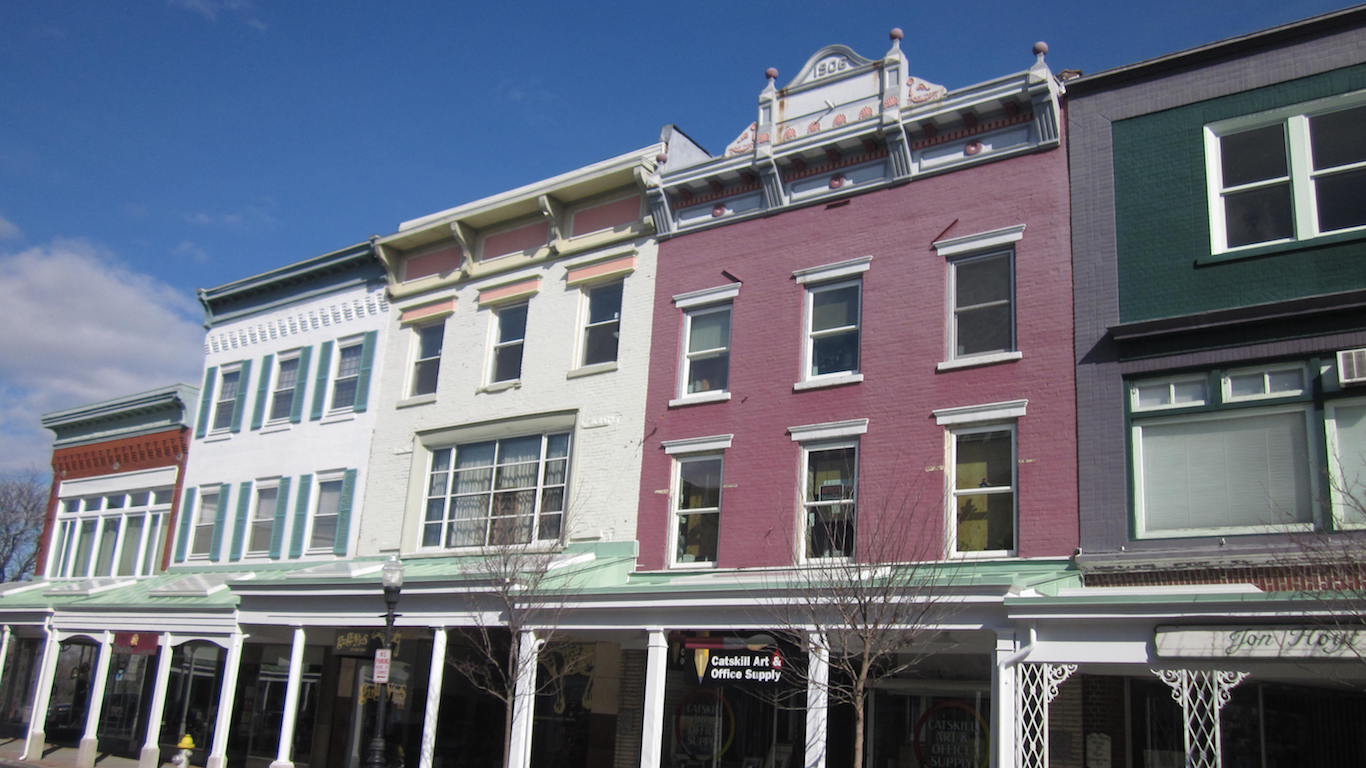
25. Glens Falls, NY
> Monthly transportation cost: $908
> Daily vehicle miles travelled: 30.2 per person
> Avg. commute time: 24.1 minutes
> Avg. cost of gas: $2.72 per gallon
> Commuters biking or walking to work: 3.4%
[in-text-ad-2]
24. Wenatchee, WA
> Monthly transportation cost: $909
> Daily vehicle miles travelled: 16.3 per person
> Avg. commute time: 19.3 minutes
> Avg. cost of gas: $2.50 per gallon
> Commuters biking or walking to work: 4.1%
23. Mount Vernon-Anacortes, WA
> Monthly transportation cost: $909
> Daily vehicle miles travelled: 22.0 per person
> Avg. commute time: 24.2 minutes
> Avg. cost of gas: $3.35 per gallon
> Commuters biking or walking to work: 3.4%
[in-text-ad]
22. Barnstable Town, MA
> Monthly transportation cost: $911
> Daily vehicle miles travelled: 41.6 per person
> Avg. commute time: 24.1 minutes
> Avg. cost of gas: $2.90 per gallon
> Commuters biking or walking to work: 2.7%
[recirclink id=488594]
21. Corvallis, OR
> Monthly transportation cost: $916
> Daily vehicle miles travelled: 13.4 per person
> Avg. commute time: 19.2 minutes
> Avg. cost of gas: $2.60 per gallon
> Commuters biking or walking to work: 14.4%

20. California-Lexington Park, MD
> Monthly transportation cost: $916
> Daily vehicle miles travelled: 19.8 per person
> Avg. commute time: 31.5 minutes
> Avg. cost of gas: $2.78 per gallon
> Commuters biking or walking to work: 3.7%
[in-text-ad-2]
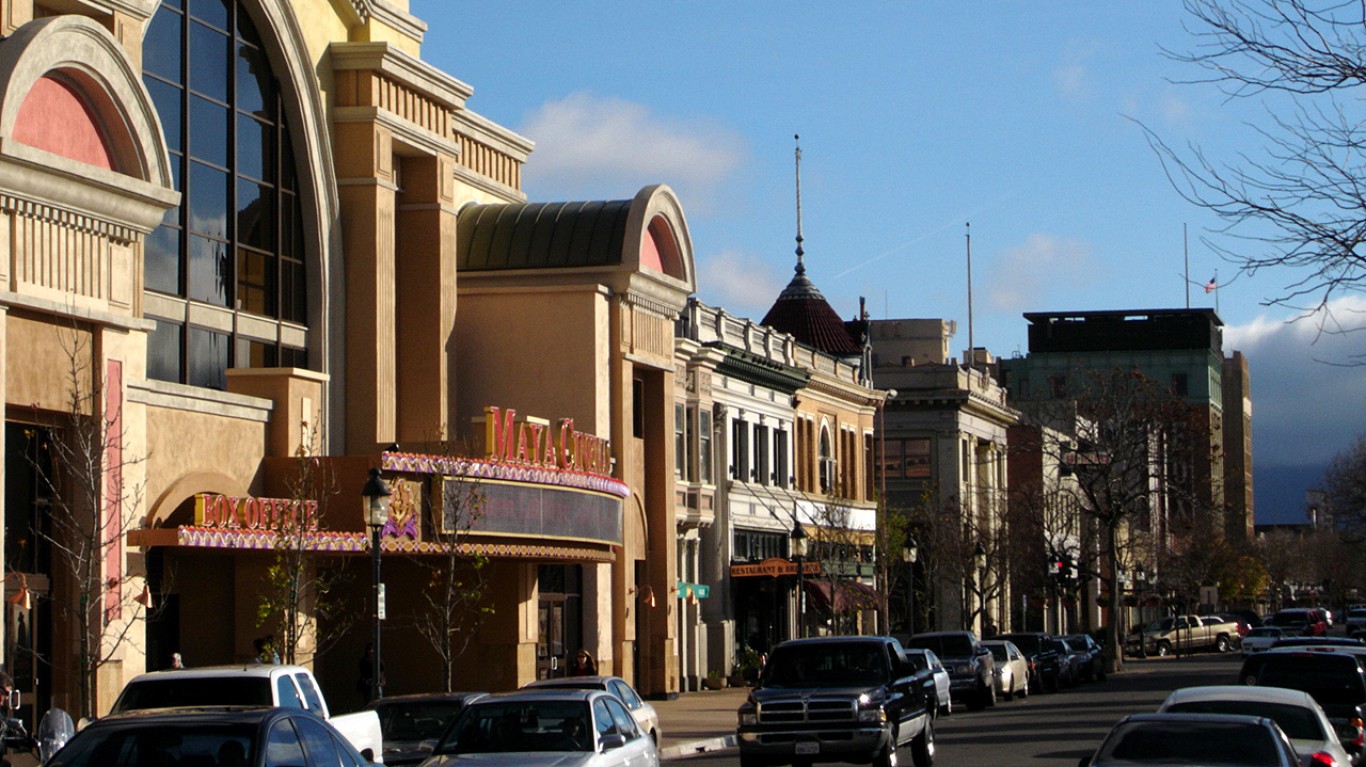
19. Vallejo-Fairfield, CA
> Monthly transportation cost: $916
> Daily vehicle miles travelled: 22.1 per person
> Avg. commute time: 33.0 minutes
> Avg. cost of gas: $3.62 per gallon (statewide)
> Commuters biking or walking to work: 1.6%

18. Redding, CA
> Monthly transportation cost: $923
> Daily vehicle miles travelled: 25.8 per person
> Avg. commute time: 19.2 minutes
> Avg. cost of gas: $3.62 per gallon (statewide)
> Commuters biking or walking to work: 3.3%
[in-text-ad]
17. Mankato-North Mankato, MN
> Monthly transportation cost: $925
> Daily vehicle miles travelled: 20.3 per person
> Avg. commute time: 19.2 minutes
> Avg. cost of gas: $2.83 per gallon
> Commuters biking or walking to work: 4.1%
[recirclink id=488561]
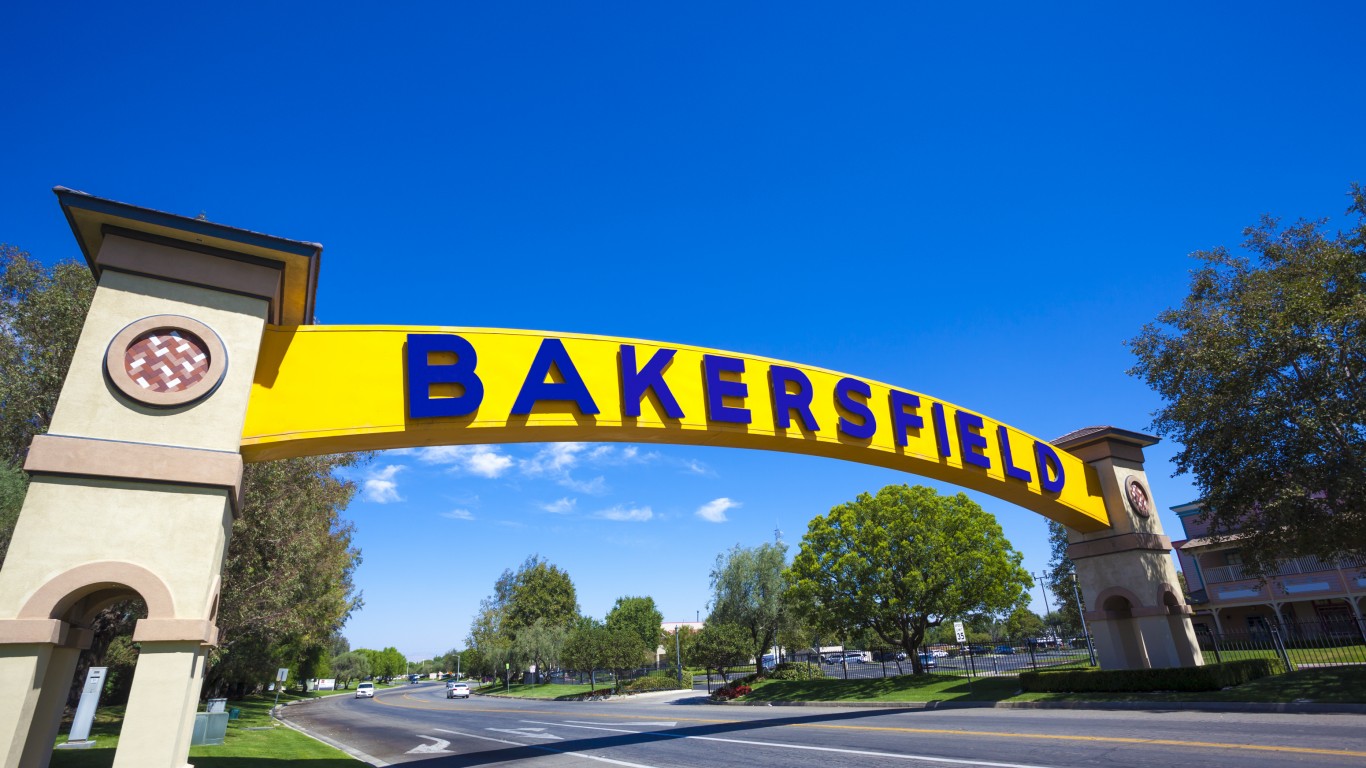
16. Bakersfield, CA
> Monthly transportation cost: $927
> Daily vehicle miles travelled: 19.1 per person
> Avg. commute time: 23.7 minutes
> Avg. cost of gas: $3.62 per gallon
> Commuters biking or walking to work: 1.5%
15. Visalia-Porterville, CA
> Monthly transportation cost: $929
> Daily vehicle miles travelled: 19.3 per person
> Avg. commute time: 21.4 minutes
> Avg. cost of gas: $3.62 per gallon (statewide)
> Commuters biking or walking to work: 2.0%
[in-text-ad-2]
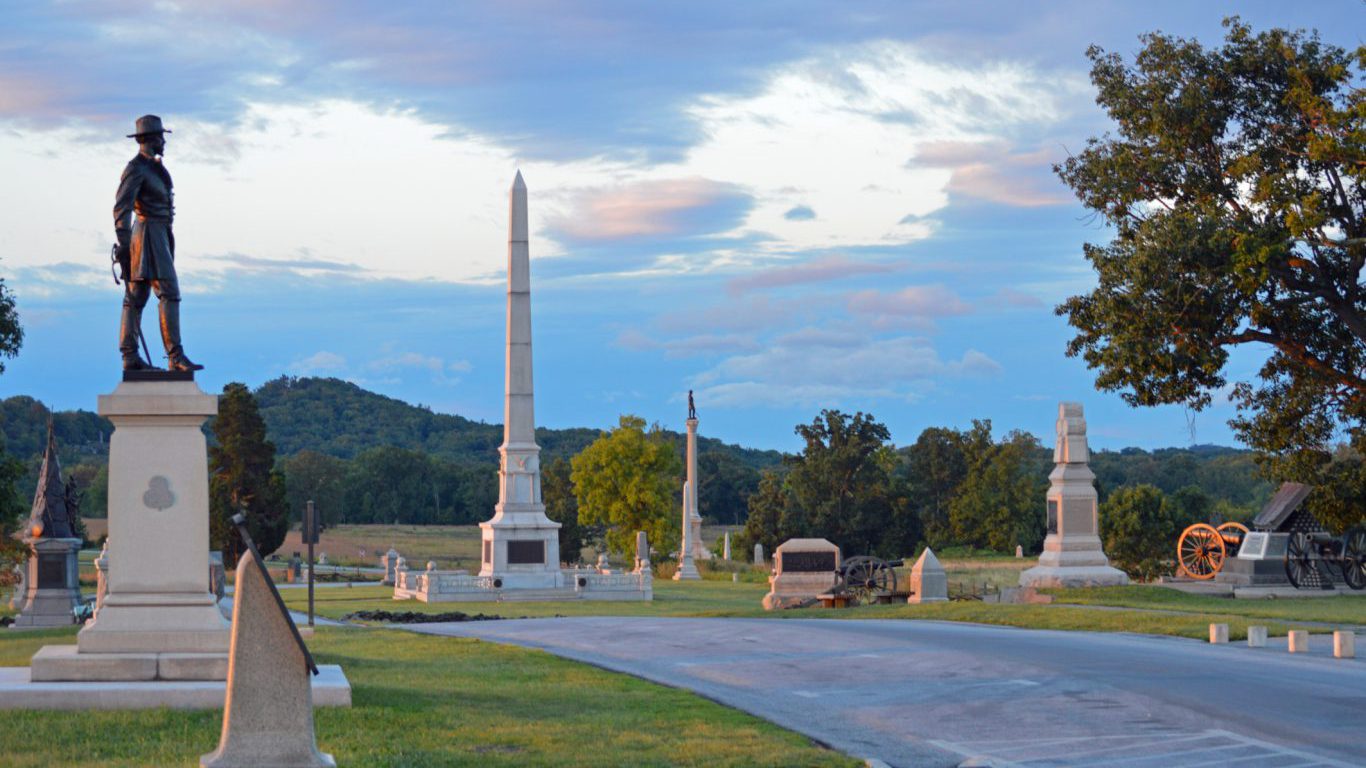
14. Gettysburg, PA
> Monthly transportation cost: $929
> Daily vehicle miles travelled: N/A
> Avg. commute time: 28.5 minutes
> Avg. cost of gas: $3.37 per gallon
> Commuters biking or walking to work: 3.3%

13. Yuba City, CA
> Monthly transportation cost: $933
> Daily vehicle miles travelled: 16.0 per person
> Avg. commute time: 29.2 minutes
> Avg. cost of gas: $3.62 per gallon (statewide)
> Commuters biking or walking to work: 1.4%
[in-text-ad]
12. Kingston, NY
> Monthly transportation cost: $936
> Daily vehicle miles travelled: 71.0 per person
> Avg. commute time: 29.0 minutes
> Avg. cost of gas: $2.60 per gallon
> Commuters biking or walking to work: 4.0%
[recirclink id=488514]
11. Hanford-Corcoran, CA
> Monthly transportation cost: $939
> Daily vehicle miles travelled: 17.1 per person
> Avg. commute time: 24.2 minutes
> Avg. cost of gas: $3.62 per gallon (statewide)
> Commuters biking or walking to work: 2.8%
10. El Centro, CA
> Monthly transportation cost: $942
> Daily vehicle miles travelled: 12.8 per person
> Avg. commute time: 21.8 minutes
> Avg. cost of gas: $3.62 per gallon (statewide)
> Commuters biking or walking to work: 2.2%
[in-text-ad-2]

9. Merced, CA
> Monthly transportation cost: $945
> Daily vehicle miles travelled: 15.1 per person
> Avg. commute time: 27.2 minutes
> Avg. cost of gas: $3.15 per gallon
> Commuters biking or walking to work: 2.3%
8. Santa Cruz-Watsonville, CA
> Monthly transportation cost: $949
> Daily vehicle miles travelled: 20.4 per person
> Avg. commute time: 28.3 minutes
> Avg. cost of gas: $3.62 per gallon
> Commuters biking or walking to work: 8.6%
[in-text-ad]
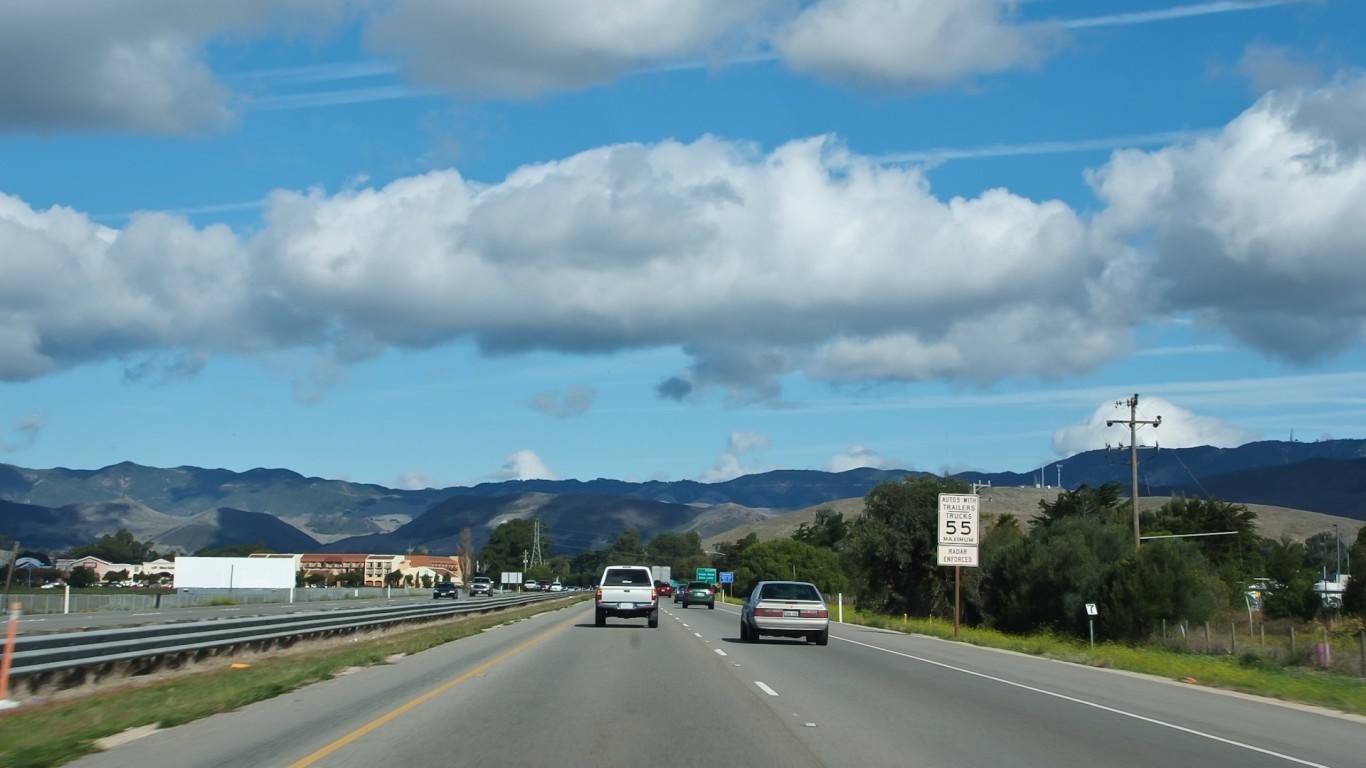
7. Santa Maria-Santa Barbara, CA
> Monthly transportation cost: $950
> Daily vehicle miles travelled: 13.5 per person
> Avg. commute time: 19.5 minutes
> Avg. cost of gas: $3.71 per gallon
> Commuters biking or walking to work: 8.9%
[recirclink id=488498]
6. Santa Rosa, CA
> Monthly transportation cost: $955
> Daily vehicle miles travelled: 21.6 per person
> Avg. commute time: 26.7 minutes
> Avg. cost of gas: $3.62 per gallon (statewide)
> Commuters biking or walking to work: 3.4%
5. Salinas, CA
> Monthly transportation cost: $961
> Daily vehicle miles travelled: 18.0 per person
> Avg. commute time: 22.5 minutes
> Avg. cost of gas: $3.68 per gallon
> Commuters biking or walking to work: 3.1%
[in-text-ad-2]
4. Oxnard-Thousand Oaks-Ventura, CA
> Monthly transportation cost: $968
> Daily vehicle miles travelled: 17.5 per person
> Avg. commute time: 28.1 minutes
> Avg. cost of gas: $3.64 per gallon
> Commuters biking or walking to work: 1.9%
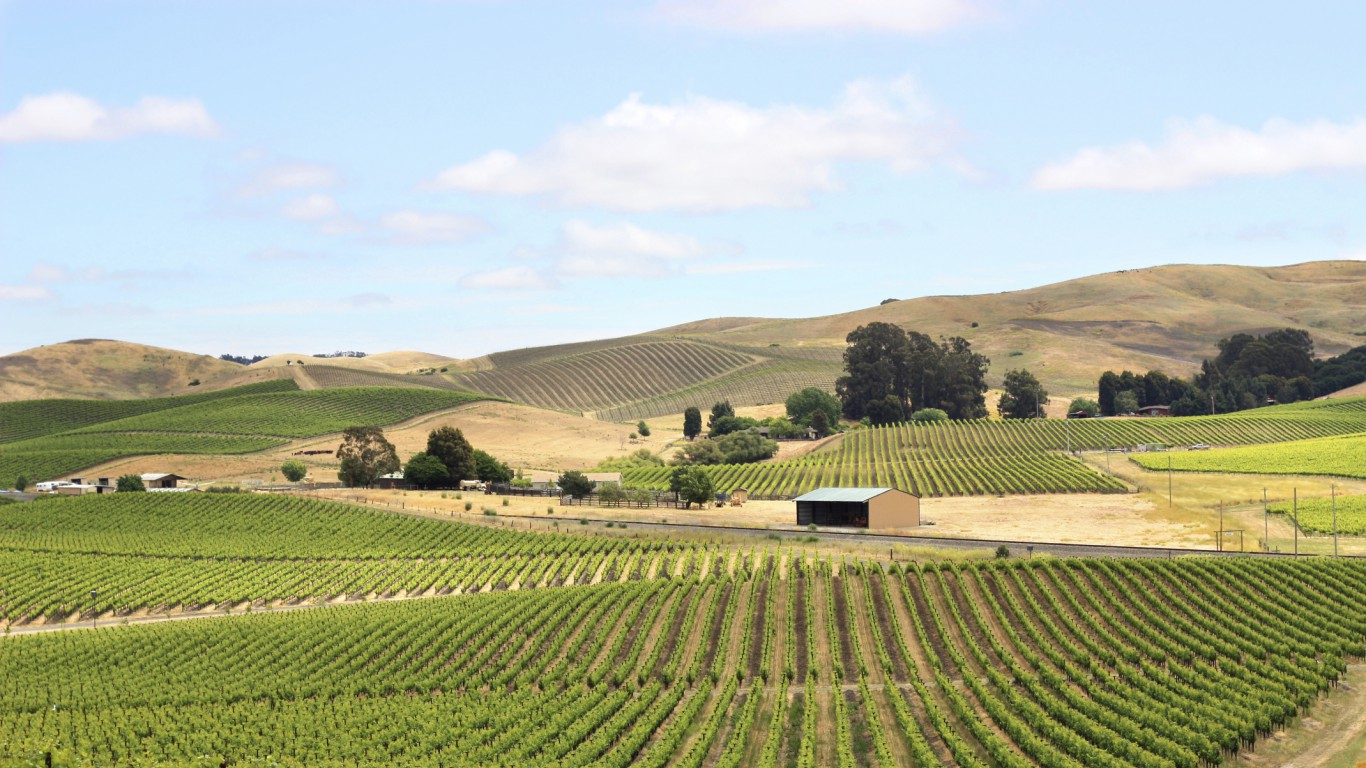
3. Napa, CA
> Monthly transportation cost: $980
> Daily vehicle miles travelled: 18.5 per person
> Avg. commute time: 25.2 minutes
> Avg. cost of gas: $3.62 per gallon (statewide)
> Commuters biking or walking to work: 4.2%
[in-text-ad]
2. San Luis Obispo-Paso Robles-Arroyo Grande, CA
> Monthly transportation cost: $992
> Daily vehicle miles travelled: 19.1 per person
> Avg. commute time: 21.5 minutes
> Avg. cost of gas: $3.62 per gallon (statewide)
> Commuters biking or walking to work: 5.8%
[recirclink id=488094]

1. Madera, CA
> Monthly transportation cost: $1,011
> Daily vehicle miles travelled: 15.1 per person
> Avg. commute time: 26.7 minutes
> Avg. cost of gas: $3.62 per gallon (statewide)
> Commuters biking or walking to work: 1.3%
Detailed Findings
Personal vehicles, despite their high cost of ownership, are the preferred mode of transportation in the United States. Nationwide, just 5% of commuters use public transportation. No city on this list is home to a higher share, and in over half of the 28 cities where transportation is most expensive, less than 1% of commuters rely on public transit.
Meanwhile, the cities with the lowest average transportation costs have some of the best public transit systems in the country. Such cities include Boston, Chicago, Washington D.C., and New York City, where 31% of commuters use public transit, the largest share in the country. The average monthly transportation cost for a single adult in New York City is $435, the lowest of any city in the country.
Over half of the cities on this list are located in California — due in no small part to high fuel costs. The average cost of a gallon of regular gas in California is $3.62, the second highest cost of any state, trailing only Hawaii. In some California cities on this list, the average cost of a gallon of fuel is even higher than the statewide average. For reference, the average cost of a gallon of fuel nationwide was $2.85 as of the middle of September.
California-Lexington Park, Maryland; Mankato, Minnesota; and Staunton-Waynesboro, Virginia are the only cities on this list located in states with lower average gas prices than the nationwide average price.
Motor vehicle insurance costs also impact travel costs. The levels and prices of required insurance coverage vary by state. According to insurance data aggregator Insure.com, the average annual car insurance costs for the nation is $1,318. The cost of insurance is higher in 20 of the 28 cities on this list.
People living in the cities with the highest transportation costs tend to drive fewer miles on average compare to the typical American. Drivers in only four cities on this list report longer average travel distances. Similarly, the average commute time is longer than the 26.9 minute national average in only nine of the 28 cities.
Perhaps due to high transportation costs, residents of the cities on this list are often more likely to take cost saving measures. For example, in 18 of the 28 cities with the highest transportation costs, the share of commuters who carpool is equal to or greater than the 8.9% of American commuters. In half of the cities on this list, a larger share of commuters walk or bike to work than the 3.2% national average.
Methodology
To identify the cities with the most expensive transportation, 24/7 Wall St. the data provided the Economic Policy Institute, which is used in the non profit’s Family Budget Calculator tool. Metro areas were ranked by the EPI’s estimated monthly transportation costs for a single adult, which is based on costs of auto ownership, auto use, and public transit use. We only considered the 377 metro areas covered in both the U.S Census Bureau’s American Community Survey and the EPI’s Family Budget Calculator. Average commute time and the share of commuters biking or walking to work are one-year estimates from the 2017 ACS. Daily vehicle miles travelled per capita came from the Federal Highway Administration and are for 2016. The average cost of a gallon of gas came from Gasbuddy on September 17, 2018 and September 18, 2018. Average gas prices were unavailable in some California cities. In those cases, as noted, the average statewide gas price was used instead.
Contact [email protected] for any questions or corrections.