
Global migration has increased sharply in recent years. In the Organisation for Economic Co-operation and Development (OECD) — a group of 36 of some of the richest and healthiest countries in the world — the total inflow of new immigrants rose from 5.2 million in 2010 to 7.3 million in 2017, a 40.5% increase.
While immigration is one of the largest drivers of economic growth, not all countries are able to attract and retain talented workers on the same scale. In its first OECD Indicators of Talent Attractiveness report, the OECD analyzed factors such as quality of opportunity; income and tax; future prospects; family environment; inclusiveness; and quality of life to assess the overall attractiveness of OECD countries for talented foreign workers.
To determine the countries where you don’t want to work abroad, 24/7 Wall St. reviewed the attractiveness rank from the OECD Indicators of Talent Attractiveness report, as well as additional data from the OECD and the International Labour Organization. OECD countries were ranked based on the average of their perceived ability to attract individuals with masters or doctoral degrees and their perceived ability to attract foreign entrepreneurs, as determined by the OECD. To see some wealthy countries that tend to be more open to foreign workers, these are the most welcoming countries to expats.
There are a number of factors talented individuals may consider before looking for work or accepting a job in a foreign country. In an exchange with 24/7 Wall St., Jean-Christophe Dumont, head of the International Migration Division of the OECD, stated “Obviously, the working conditions play a role, but it goes well beyond wages. Career prospects, and the extent to which their skills will be used and can be developed, are very important elements.”
Click here to see the full list of countries where you don’t want to work abroad
Click here to see our detailed findings and methodology

11. Czech Republic
> Foreign-born unemployment rate: 2.5%
> Foreign-born participation rate: 81.4%
> GNI per capita: $37,580
> Population: 10.6 million
In a report measuring quality of opportunities, inclusiveness, and other immigration factors, the Czech Republic ranks as one of the least attractive countries for foreign workers in the OECD. One of the largest factors deterring immigrants may be the poor job market for foreign-born workers. Some 9.8% of them are employed in low-skilled occupations, nearly twice the 5.2% share of native-born workers who are employed in low-skilled occupations.
The Czech Republic is one of several Eastern European countries where anti-immigrant rhetoric associated with a newly elected nationalist government may be scaring off talented foreign workers. In a recent survey by the Czech Public Opinion Research Centre, roughly 70% of Czechs stated that the Czech Republic should not accept refugees from war-torn countries in 2017, an increase from 50% in 2015.
[in-text-ad]

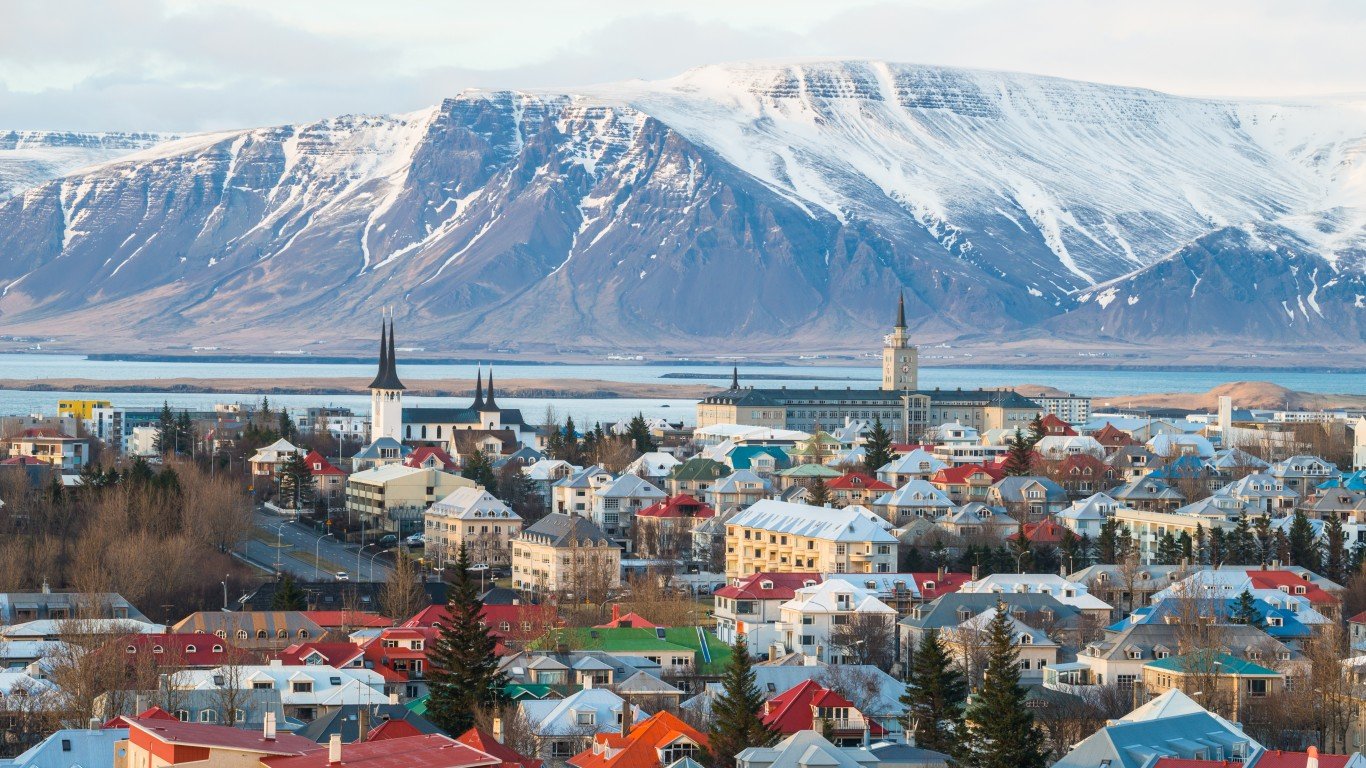
10. Iceland
> Foreign-born unemployment rate: 5.1%
> Foreign-born participation rate: 87.0%
> GNI per capita: $55,190
> Population: 353,574
One factor deterring immigrants from finding work in Iceland may be the lack of opportunities for foreign workers there . While 51.4% of native Icelanders work in high-skilled jobs, for example, only 37.0% of foreign-born residents do — one of the largest disparities of any OECD country.
A recent investigation by the Icelandic National Broadcasting Service found that foreign workers in Iceland are more likely to be exploited than locals, particularly in the tourism industry. In one instance cited in the report, foreign workers were regularly working 220 hours per month for less than minimum wage, while paying 50,000 ISK ($400) to share a room with up to nine other workers.

9. Hungary
> Foreign-born unemployment rate: 4.6%
> Foreign-born participation rate: 75.2%
> GNI per capita: $29,500
> Population: 9.8 million
Hungary ranks as one of the least attractive countries for foreign workers in the OECD. One factor deterring foreign nationals from seeking work in Hungary may be the strict immigration policies imposed by Prime Minister Viktor Orbán. Orbán’s government has erected barriers to immigration, both legal and physical, including limits on work permits and a razor-wire fences along its border with Serbia and Croatia. According to local observers, restrictions on immigration have stoked anti-immigrant sentiment in the country. Foreign-born residents currently constitute just 2.2% of the working-age population in Hungary, one of the smallest shares of any country in the OECD.

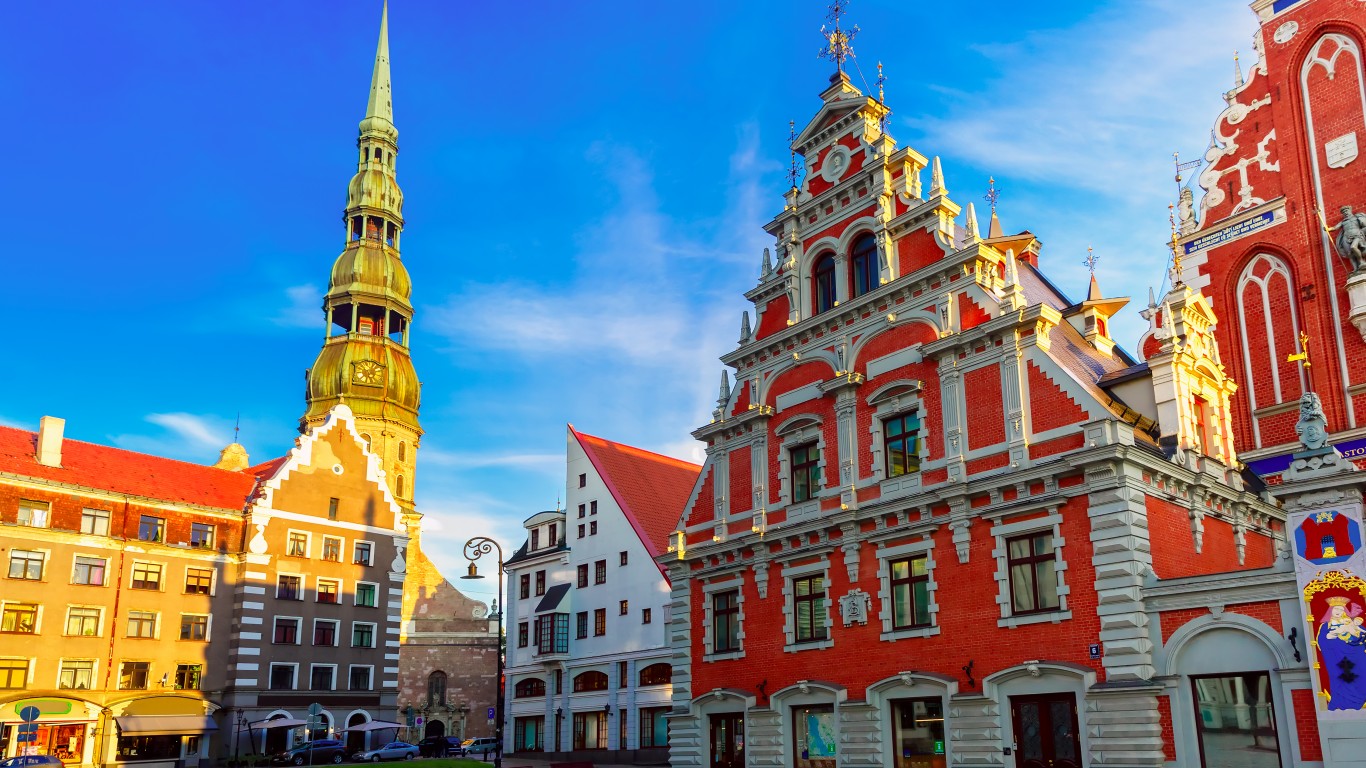
8. Latvia
> Foreign-born unemployment rate: 7.7%
> Foreign-born participation rate: 74.8%
> GNI per capita: $30,270
> Population: 1.9 million
While some 13.1% of the native-born working-age population in Latvia has a bachelor’s degree or equivalent level of education, just 8.1% of the foreign-born working-age population do — one of the largest disparities of any country with available data. Similarly, while 41.4% of native workers are employed in high-skilled jobs, such as managers, professionals, and technicians, just 33.7% of foreign-born workers are.
Foreign workers in Latvia are also likely to encounter discrimination and unfair treatment. According to a May 2019 report published in the open access volume The Emigrant Communities of Latvia, one in three Latvian migrant workers have experienced discrimination at work, and one in five report being paid less than their native-born coworkers for similar work.
[in-text-ad-2]

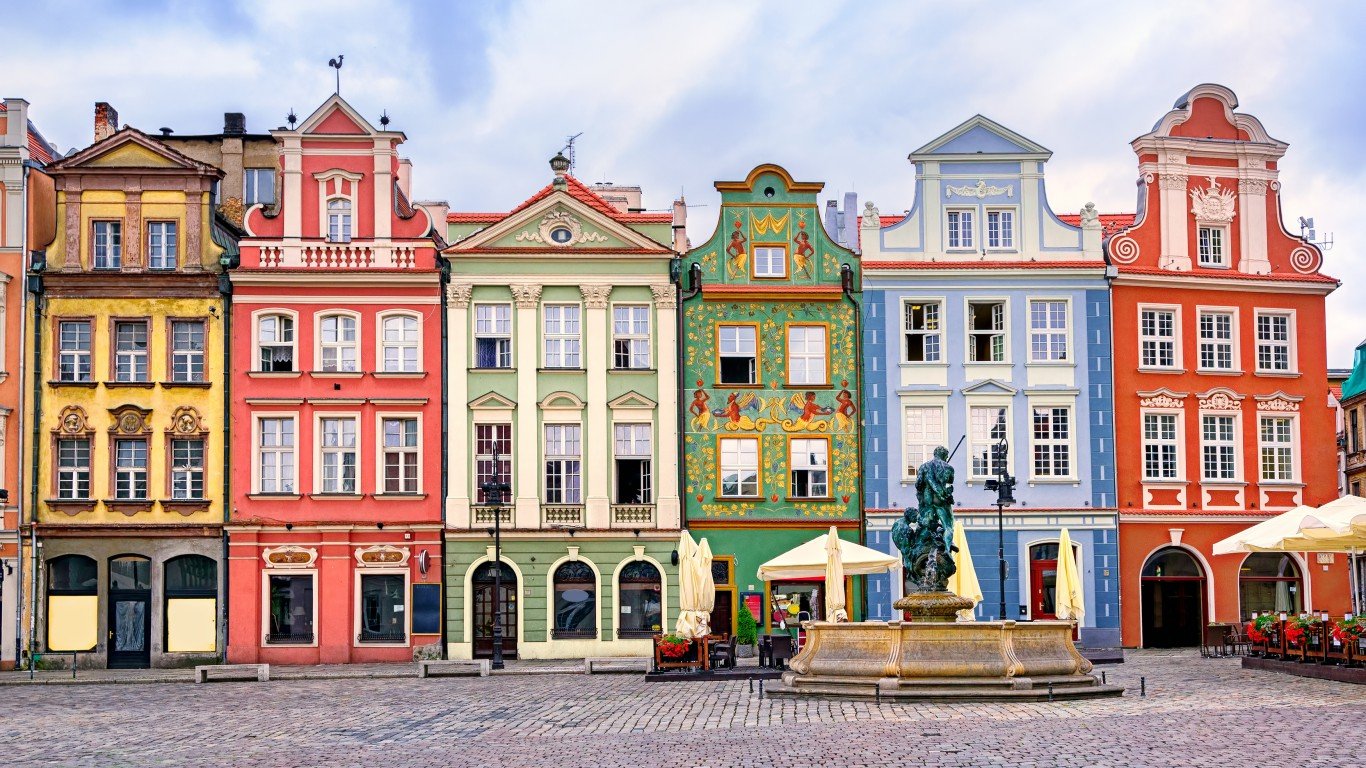
7. Poland
> Foreign-born unemployment rate: 4.7%
> Foreign-born participation rate: 76.6%
> GNI per capita: $30,140
> Population: 38.0 million
In a report measuring quality of life, inclusiveness, and other pull factors for immigrants, Poland ranks as one of the least attractive countries in the OECD. One factor deterring potential migrants may be the poor job market for foreign workers. Some 4.7% of Poland’s foreign labor force is unemployed, far more than the 3.9% unemployment rate for the native labor force.
Similar to what’s happening in nearby Hungary, anti-immigrant rhetoric stemming from the nationalist Law and Justice party, which came to power in Poland in 2015, may also discourage foreigners from moving there. Party leader JarosÅaw KaczyÅski, for example, has made frequent outspoken pronouncements against Muslim migrants. Foreign-born residents now constitute just 0.9% of the working-age population in Poland, the second smallest share of any OECD country.

6. Chile
> Foreign-born unemployment rate: 5.8%
> Foreign-born participation rate: 78.4%
> GNI per capita: $24,190
> Population: 18.7 million
As in many OECD nations, one factor that may deter foreign workers from migrating to Chile may be anti-immigrant sentiment associated with a recent spike in immigration. According to a survey by the National Institute of Human Rights, 68% of Chileans want to restrict immigration, and nearly half believe that immigrants take jobs from locals.
One of the most targeted groups are immigrants from Haiti. Haitians make up the sixth-largest foreign-born population in Chile, after Peru, Colombia, Venezuela, Bolivia, and Argentina. Reports of anti-Haitian sentiment have risen in conjunction with an influx of Haitian immigrants. In November 2018, the Chilean government began offering Haitians a free one-way ticket back to Haiti, flying two plane loads of Haitian immigrants home.
[in-text-ad]

5. Italy
> Foreign-born unemployment rate: 13.7%
> Foreign-born participation rate: 70.6%
> GNI per capita: $42,020
> Population: 60.4 million
One factor deterring potential migrants from Italy may be the lack of quality job opportunities for foreign-born workers. While 10.3% of native-born Italians are unemployed, 13.7% of the foreign-born labor force in Italy are — one of the larger disparities of any OECD country. Additionally, while 40.1% of native-born workers are employed in high-skilled positions such as managers, professionals, and technicians, just 13.6% of foreign-born workers are — the largest disparity of any OECD country other than Greece.
Italy also grants fewer foreign work permits per capita than any other European Union nation. According to a report by the Italian think tank Leone Moressa Foundation, Italy issued 0.23 permits to immigrants for every 1,000 existing residents in 2018, a fraction of the EU average of 2.24.

4. Israel
> Foreign-born unemployment rate: 3.5%
> Foreign-born participation rate: 81.6%
> GNI per capita: $39,830
> Population: 8.9 million
In 2016, Israel immigration authorities introduced stricter criteria for obtaining work permits. Permit recipients must now earn at least twice the average salary in Israel, and are required to receive their salary in an Israeli bank account, when the job does not require academic certification. Also, foreign workers employed in jobs that do not require academic certification are not permitted to request permits for their dependent family members.
In addition to the difficult immigration process, potential workers may be deterred from the lack of high-skilled jobs for foreign nationals in Israel. While 41.6% of native-born workers in Israel work in low- to medium-skilled jobs, 51.5% of foreign-born workers do. This represents one of the largest disparities of any OECD nation.

3. Greece
> Foreign-born unemployment rate: 28.6%
> Foreign-born participation rate: 73.9%
> GNI per capita: $29,410
> Population: 10.7 million
In a report measuring quality of life, inclusiveness, and other pull factors for immigrants, Greece ranks as one of the least attractive countries for foreign workers in the OECD. One factor deterring potential migrants from Greece may be the lack of advanced job opportunities for foreign workers. While 31.6% of native-born workers in Greece are employed in high-skilled occupations, just 9.7% of foreign-born workers are — the largest disparity of any OECD nation. Additionally, while 18.6% of the native-born labor force is unemployed, 28.6% of the foreign-born labor force is — each the largest such share of any OECD country, and one of the largest disparities.
[in-text-ad-2]

2. Mexico
> Foreign-born unemployment rate: 4.1%
> Foreign-born participation rate: 54.1%
> GNI per capita: $19,360
> Population: 126.2 million
Mexico is one of the most restrictive countries in the OECD for foreign workers. Under the Federal Labour Law, businesses are required to keep foreign workers to less than 10% of their total workforce. Heavy restrictions may deter some potential immigrants from seeking work in Mexico. Foreign individuals currently constitute just 0.5% of the working-age population in Mexico, the smallest share of any OECD nation.
Despite the heavy restrictions, foreign workers earn more on average than native workers in Mexico. According to data from the International Labour Organization, the average worker born outside the country earns 8,896 pesos ($460) per month, 2,591 pesos ($135) more than the average native-born worker.

1. Turkey
> Foreign-born unemployment rate: 12.1%
> Foreign-born participation rate: 53.9%
> GNI per capita: $27,470
> Population: 82.3 million
While restrictions on foreign work permits in Turkey have loosened in recent years, the country still has some of the strictest immigration policies of any OECD country. In most sectors, for example, Turkish businesses are required to employ five Turkish citizens for every foreign-born resident. Additionally, refugees cannot exceed 10% of a company’s workforce.
Turkey also has a history of worker’s rights abuses for low-skilled workers. Due to these abuses, which included the murders and arrests of several union leaders in 2018, Turkey ranked as one of the 10 worst countries on the International Trade Union Confederation’s Global RIghts Index. Currently, some 21.1% of foreign-born workers in Turkey are employed in low-skilled industries, more than the 14.4% share for native-born workers and one of the largest shares of any OECD nation.
Detailed Findings
“More generally,” Dumont continued, “the living conditions for the workers themselves and their family are key. In the OECD Talent Attractiveness Index, the possibility for the spouse to work, for the children to access and succeed in school, and, more generally, the quality of life are significant factors.”
Ease of immigration is also a major factor in attracting foreign workers. “Some of these countries also have complex, lengthy, and uncertain immigration procedures, which does not help,” Dumont said. According to the OECD, the average processing time for work visas — the number of days from when a prospective migrant initiates an immigration case to the date on which the individual is allowed to start working — ranges from 39 to 185 days in OECD countries.
Restrictive quotas on foreign labor can also make a country less attractive to potential migrants and effectively reduce immigration. In Turkey, for example, most businesses are required to employ five Turkish citizens for each foreign employee. In Mexico, businesses must employee nine Mexican nationals for every one foreigner.
Wealth is one of the largest determinants of overall quality of life. While the GNI per capita for OECD as a whole is higher than the global average, wealth fluctuates heavily within the OECD. The four countries with the lowest GNI per capita in the OECD — Mexico, Chile, Turkey, and Greece — each rank second, sixth, first, and third on this list, respectively.
Methodology
To determine the countries where you don’t want to work abroad, 24/7 Wall St. reviewed the attractiveness rank from the OECD Indicators of Talent Attractiveness report, as well as additional data from the OECD and the International Labour Organization. OECD countries were ranked based on the average of their perceived ability to attract individuals with masters or doctoral degrees and their perceived ability to attract foreign entrepreneurs, as determined by the OECD. Data on the foreign-born participation rate, native-born unemployment, and foreign-born unemployment are from the OECD and are for 2018 or the latest year available. Data on population and GNI per capita in international dollars are for 2018 and is from the World Bank. Data on foreign-born residents as a share of the working-age population 15 and older, educational attainment for the native-born and foreign-born populations aged 15 and up, and the share of the native-born and foreign-born workforce employed in occupations classified as low-, medium-, or high-skilled came from the International Labour Organization for 2018, or the earliest year available.
Take This Retirement Quiz To Get Matched With A Financial Advisor (Sponsored)
Take the quiz below to get matched with a financial advisor today.
Each advisor has been vetted by SmartAsset and is held to a fiduciary standard to act in your best interests.
Here’s how it works:
1. Answer SmartAsset advisor match quiz
2. Review your pre-screened matches at your leisure. Check out the
advisors’ profiles.
3. Speak with advisors at no cost to you. Have an introductory call on the phone or introduction in person and choose whom to work with in the future
Take the retirement quiz right here.
Thank you for reading! Have some feedback for us?
Contact the 24/7 Wall St. editorial team.


