More than 6.8 million COVID-19 cases have been confirmed in the U.S. as of Sept. 18, by far the most of any country. Though the spread of the novel coronavirus has slowed nationwide, six months into the pandemic many states are dealing with resurging outbreaks.
Most places that reported the worst outbreaks in the spring are doing relatively better now. For example, New York — and especially New York City, which was once the epicenter of the pandemic in the U.S. — now has one of the lowest case growth rates of any state. These are the states where the virus spread is slowing.
There is evidence that social distancing was likely a significant driver in decreasing the spread of COVID-19 in the U.S., especially in places like NYC. According to a recent study by researchers from Massachusetts General Hospital, keeping at least six feet apart, wearing a mask, and staying home as much as possible reduced the total number of COVID-19 cases by about 55,000 cases two weeks after implementing social distancing guidelines and orders. Three weeks later, social distancing reduced the number of cases by more than 600,000 cases.
After the initial spring outbreak, spikes in the number of new coronavirus began to appear in other parts of the country. While most of these places have recovered, there are signs of a second wave of new COVID-19 cases emerging in a handful of counties.
To determine the counties where COVID-19 is resurging, 24/7 Wall St. compiled COVID-19 cases and deaths in each U.S. county and county equivalent from state and local health departments. The places on this list are the only counties in the country that meet the following criteria:
- The county had a two-week period of growth in average daily new cases per capita that was at least 150% of the national average at some time between May 2 and Aug. 14
- The county had a below-average number of average daily new cases per capita between Aug. 15 and Aug. 29.
- The county again recently had an above-average number of average daily new cases between Aug. 30 and Sept. 13, the most recent period for which data is available.
Several factors may be contributing to the recent spate of local spikes in new coronavirus cases. Schools opening, workers returning to physical offices, and the relaxation of precautionary measures like face masks and hand washing may all lead to increased transmission rates in the fall. Here is how schools are reopening in every state. See also where every state is in its reopening plan.
Click here to see the places where COVID-19 is resurging
Click here to read our methodology
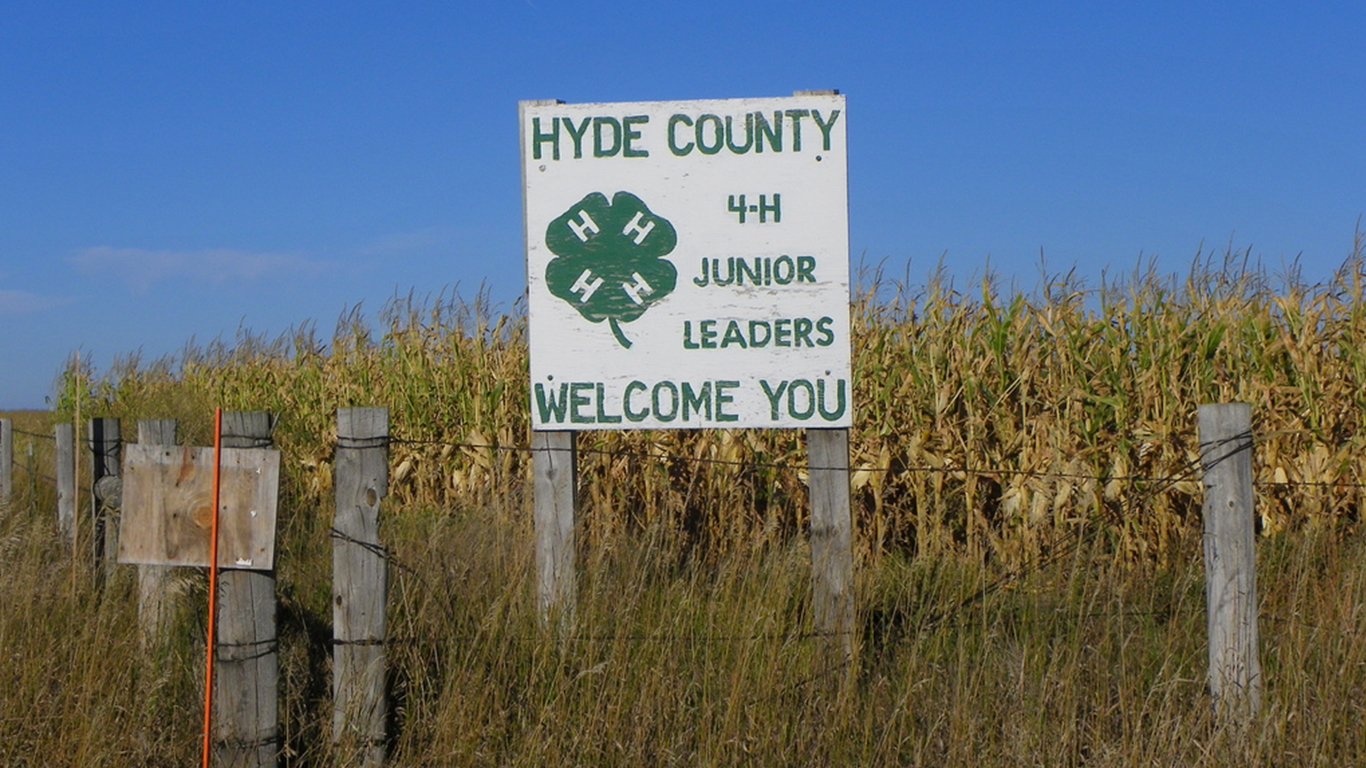
19. Hyde County, South Dakota
> Early pandemic peak daily growth rate: +10.0 new daily cases per 100,000 (Jun 1-15)
> Middle pandemic lull: +8.6 new daily cases per 100,000 (Aug 15-29)
> Most recent peak: +12.9 new cases per 100,000 (Aug 30 to Sep 13)
> Confirmed cases as of Sep 13: 601 per 100,000 — (total: 8)
> Deaths as of Sep 13: No deaths reported
> Population: 1,331
[in-text-ad]

18. DeKalb County, Indiana
> Early pandemic peak daily growth rate: +10.2 new daily cases per 100,000 (Jun 1-15)
> Middle pandemic lull: +10.0 new daily cases per 100,000 (Aug 15-29)
> Most recent peak: +13.5 new cases per 100,000 (Aug 30 to Sep 13)
> Confirmed cases as of Sep 13: 946 per 100,000 — (total: 404)
> Deaths as of Sep 13: 21 per 100,000 — (total: 9)
> Population: 42,704
[recirclink id=738560]
17. Winnebago County, Wisconsin
> Early pandemic peak daily growth rate: +10.8 new daily cases per 100,000 (Jun 1-15)
> Middle pandemic lull: +8.2 new daily cases per 100,000 (Aug 15-29)
> Most recent peak: +16.0 new cases per 100,000 (Aug 30 to Sep 13)
> Confirmed cases as of Sep 13: 1,175 per 100,000 — (total: 1,996)
> Deaths as of Sep 13: 13 per 100,000 — (total: 22)
> Population: 169,926

16. LaMoure County, North Dakota
> Early pandemic peak daily growth rate: +11.6 new daily cases per 100,000 (Jun 1-15)
> Middle pandemic lull: +4.4 new daily cases per 100,000 (Aug 15-29)
> Most recent peak: +19.5 new cases per 100,000 (Aug 30 to Sep 13)
> Confirmed cases as of Sep 13: 902 per 100,000 — (total: 37)
> Deaths as of Sep 13: No deaths reported
> Population: 4,100
[in-text-ad-2]
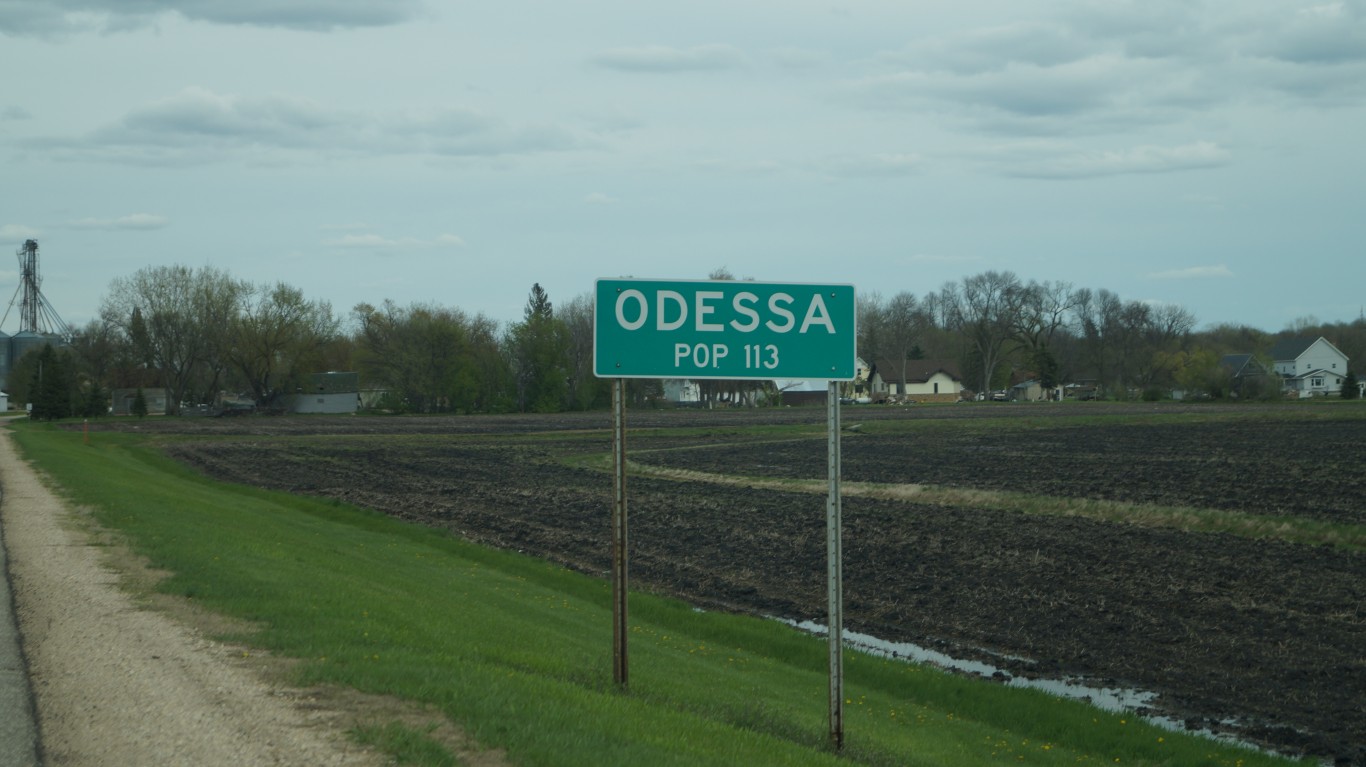
15. Big Stone County, Minnesota
> Early pandemic peak daily growth rate: +12.0 new daily cases per 100,000 (Jun 1-15)
> Middle pandemic lull: +11.8 new daily cases per 100,000 (Aug 15-29)
> Most recent peak: +17.3 new cases per 100,000 (Aug 30 to Sep 13)
> Confirmed cases as of Sep 13: 1,017 per 100,000 — (total: 51)
> Deaths as of Sep 13: No deaths reported
> Population: 5,016

14. Moody County, South Dakota
> Early pandemic peak daily growth rate: +12.4 new daily cases per 100,000 (May 2-16)
> Middle pandemic lull: +6.9 new daily cases per 100,000 (Aug 15-29)
> Most recent peak: +20.8 new cases per 100,000 (Aug 30 to Sep 13)
> Confirmed cases as of Sep 13: 968 per 100,000 — (total: 63)
> Deaths as of Sep 13: No deaths reported
> Population: 6,506
[in-text-ad]

13. Bowie County, Texas
> Early pandemic peak daily growth rate: +12.7 new daily cases per 100,000 (Jun 1 to Jun 15)
> Middle pandemic lull: +9.3 new daily cases per 100,000 (Aug 15-29)
> Most recent peak: +17.4 new cases per 100,000 (Aug 30 to Sep 13)
> Confirmed cases as of Sep 13: 1,255 per 100,000 — (total: 1,178)
> Deaths as of Sep 13: 49 per 100,000 — (total: 46)
> Population: 93,858
[recirclink id=737899]

12. Steele County, Minnesota
> Early pandemic peak daily growth rate: +13.0 new daily cases per 100,000 (May 17-31)
> Middle pandemic lull: +9.8 new daily cases per 100,000 (Aug 15-29)
> Most recent peak: +14.4 new cases per 100,000 (Aug 30 to Sep 13)
> Confirmed cases as of Sep 13: 1,352 per 100,000 — (total: 496)
> Deaths as of Sep 13: 5 per 100,000 — (total: 2)
> Population: 36,676
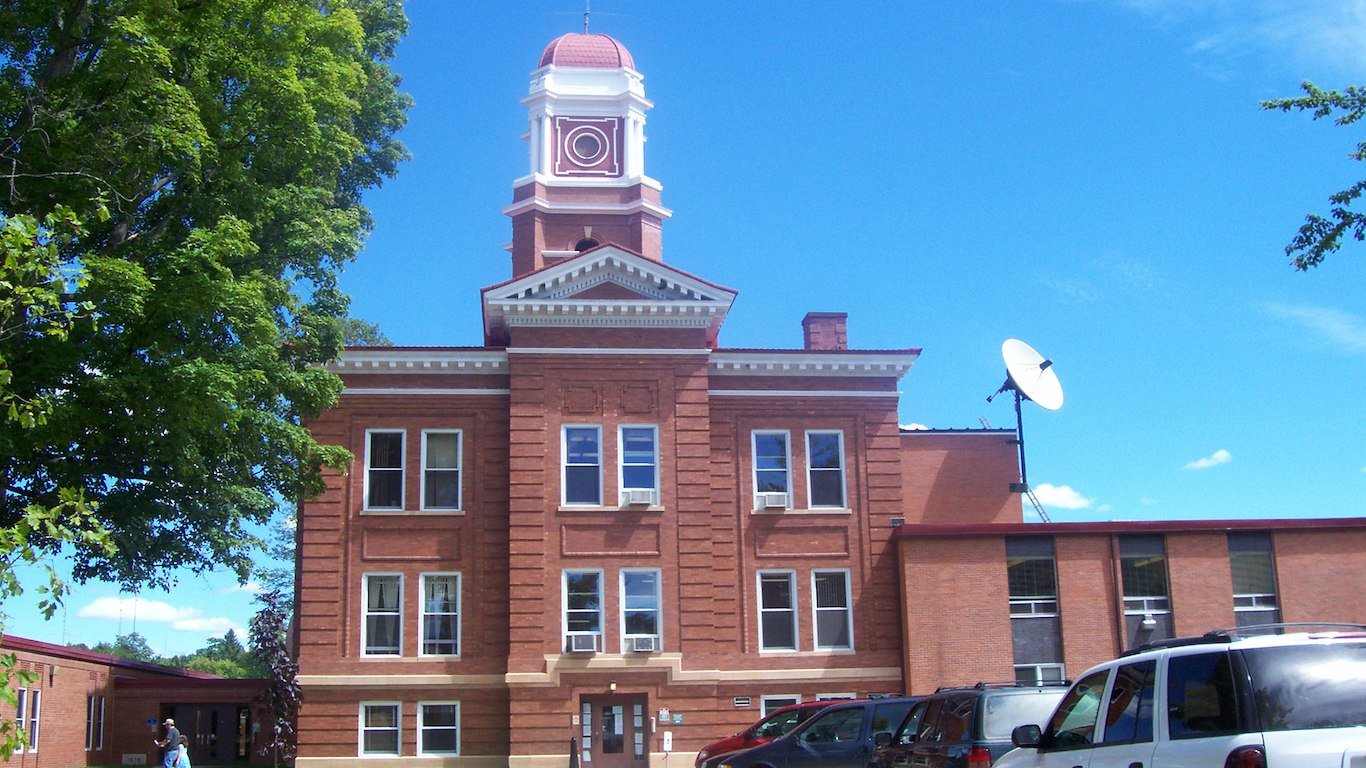
11. Forest County, Wisconsin
> Early pandemic peak daily growth rate: +13.3 new daily cases per 100,000 (May 17-31)
> Middle pandemic lull: +6.1 new daily cases per 100,000 (Aug 15-29)
> Most recent peak: +42.7 new cases per 100,000 (Aug 30 to Sep 13)
> Confirmed cases as of Sep 13: 1,708 per 100,000 — (total: 154)
> Deaths as of Sep 13: 44 per 100,000 — (total: 4)
> Population: 9,018
[in-text-ad-2]
10. Rockingham County, Virginia
> Early pandemic peak daily growth rate: +13.4 new daily cases per 100,000 (May 2-16)
> Middle pandemic lull: +5.5 new daily cases per 100,000 (Aug 15-29)
> Most recent peak: +15.8 new cases per 100,000 (Aug 30 to Sep 13)
> Confirmed cases as of Sep 13: 1,589 per 100,000 — (total: 1,262)
> Deaths as of Sep 13: 25 per 100,000 — (total: 20)
> Population: 79,444
9. Chippewa County, Minnesota
> Early pandemic peak daily growth rate: +14.0 new daily cases per 100,000 (May 17-31)
> Middle pandemic lull: +11.6 new daily cases per 100,000 (Aug 15-29)
> Most recent peak: +19.1 new cases per 100,000 (Aug 30 to Sep 13)
> Confirmed cases as of Sep 13: 1,407 per 100,000 — (total: 169)
> Deaths as of Sep 13: 8 per 100,000 — (total: 1)
> Population: 12,010
[in-text-ad]
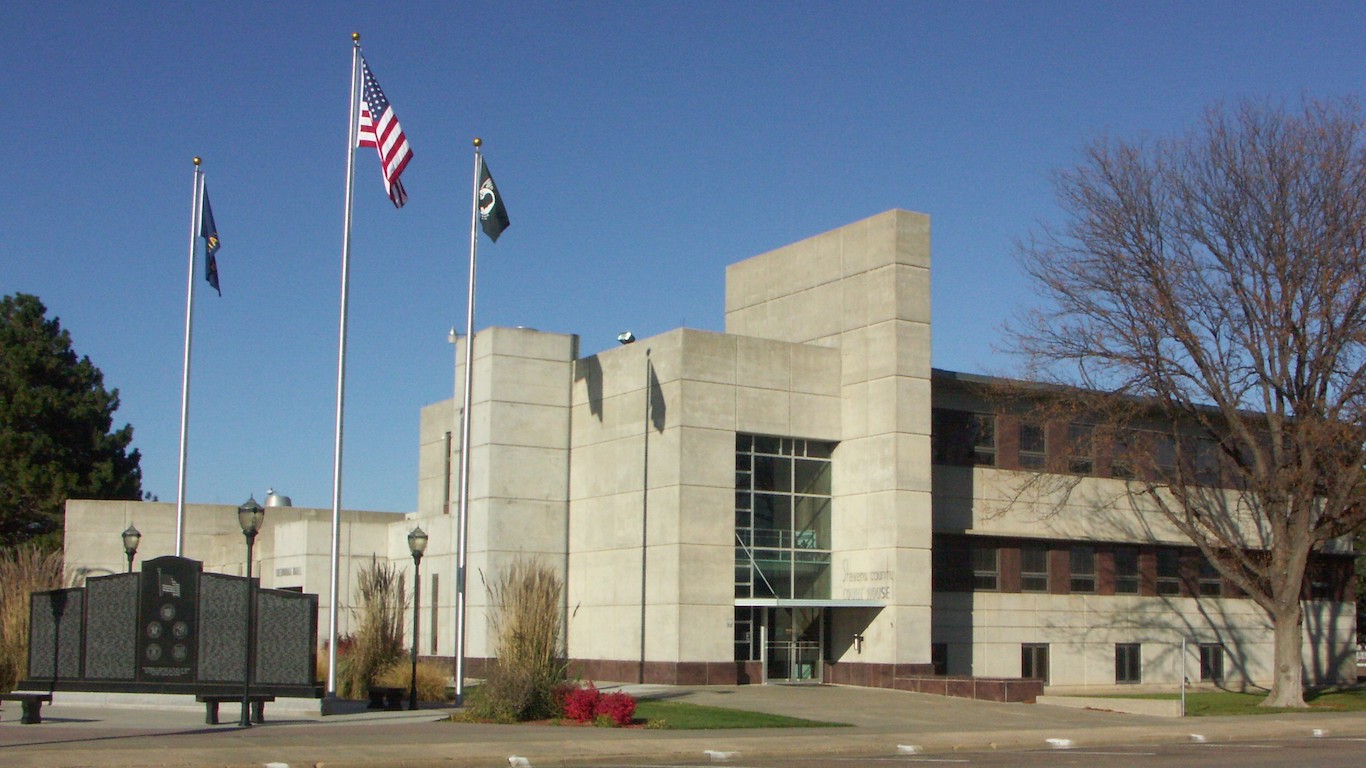
8. Stevens County, Kansas
> Early pandemic peak daily growth rate: +14.7 new daily cases per 100,000 (May 2-16)
> Middle pandemic lull: +7.0 new daily cases per 100,000 (Aug 15-29)
> Most recent peak: +25.0 new cases per 100,000 (Aug 30 to Sep 13)
> Confirmed cases as of Sep 13: 1,319 per 100,000 — (total: 75)
> Deaths as of Sep 13: No deaths reported
> Population: 5,686
[recirclink id=737779]
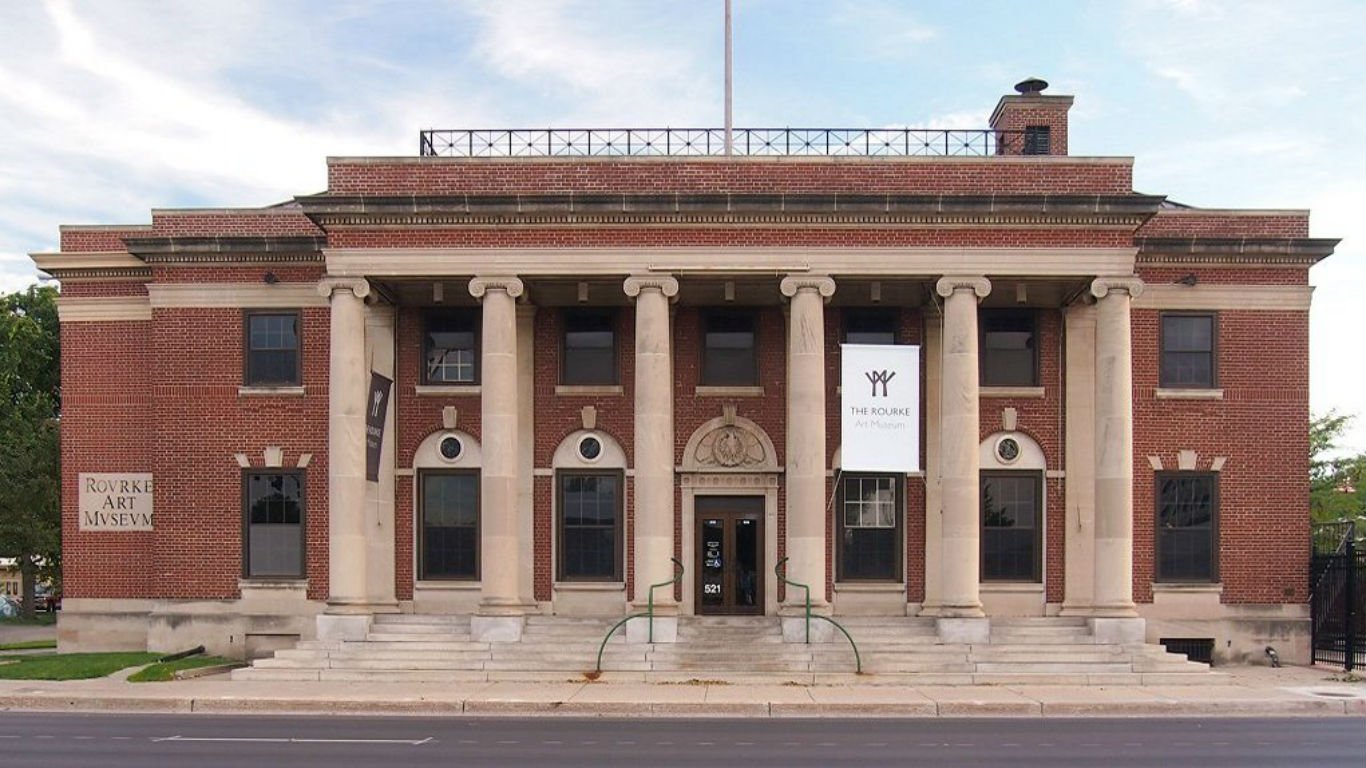
7. Clay County, Minnesota
> Early pandemic peak daily growth rate: +15.4 new daily cases per 100,000 (May 17-31)
> Middle pandemic lull: +5.8 new daily cases per 100,000 (Aug 15-29)
> Most recent peak: +22.9 new cases per 100,000 (Aug 30 to Sep 13)
> Confirmed cases as of Sep 13: 1,801 per 100,000 — (total: 1,131)
> Deaths as of Sep 13: 64 per 100,000 — (total: 40)
> Population: 62,801

6. La Crosse County, Wisconsin
> Early pandemic peak daily growth rate: +15.9 new daily cases per 100,000 (Jun 16-30)
> Middle pandemic lull: +9.3 new daily cases per 100,000 (Aug 15-29)
> Most recent peak: +22.5 new cases per 100,000 (Aug 30 to Sep 13)
> Confirmed cases as of Sep 13: 1,488 per 100,000 — (total: 1,754)
> Deaths as of Sep 13: 2 per 100,000 — (total: 2)
> Population: 117,850
[in-text-ad-2]
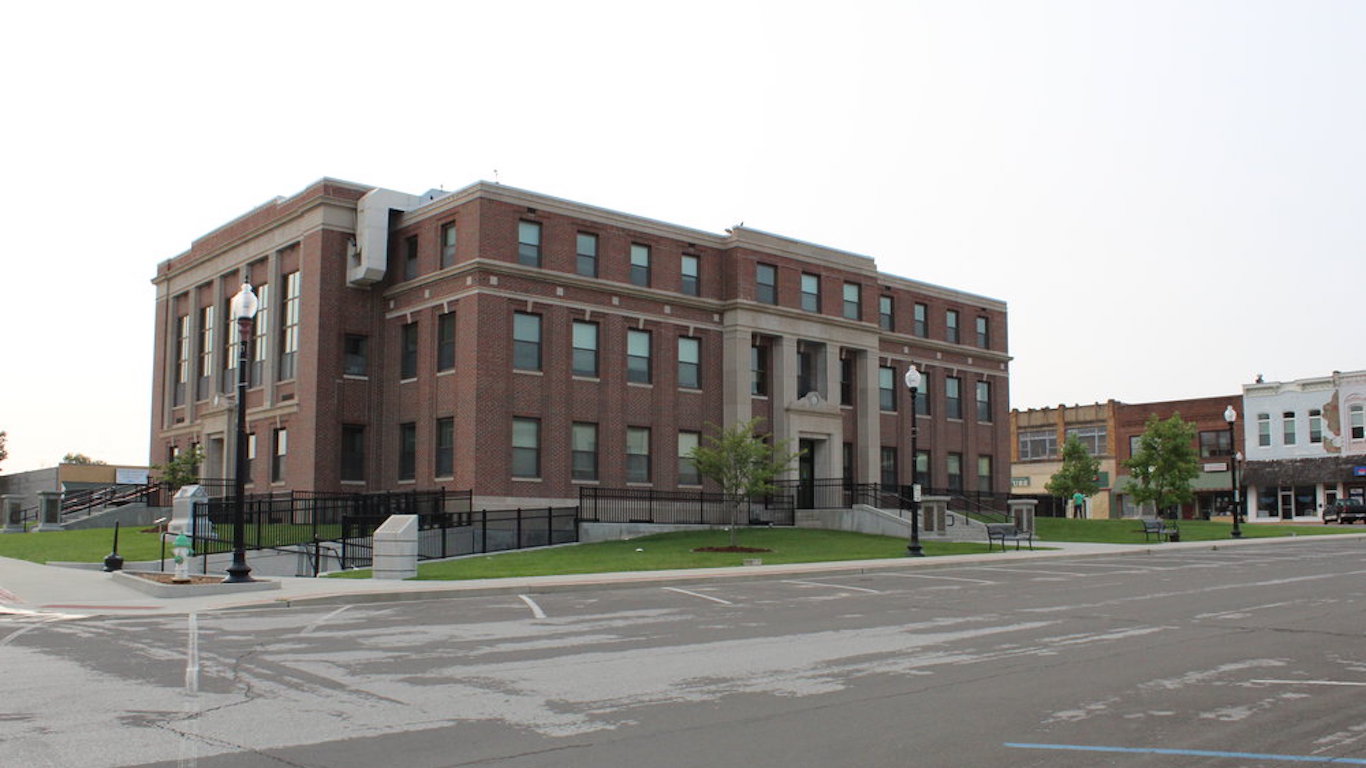
5. Audrain County, Missouri
> Early pandemic peak daily growth rate: +17.8 new daily cases per 100,000 (May 17-31)
> Middle pandemic lull: +11.0 new daily cases per 100,000 (Aug 15-29)
> Most recent peak: +21.9 new cases per 100,000 (Aug 30 to Sep 13)
> Confirmed cases as of Sep 13: 1,337 per 100,000 — (total: 344)
> Deaths as of Sep 13: 8 per 100,000 — (total: 2)
> Population: 25,735
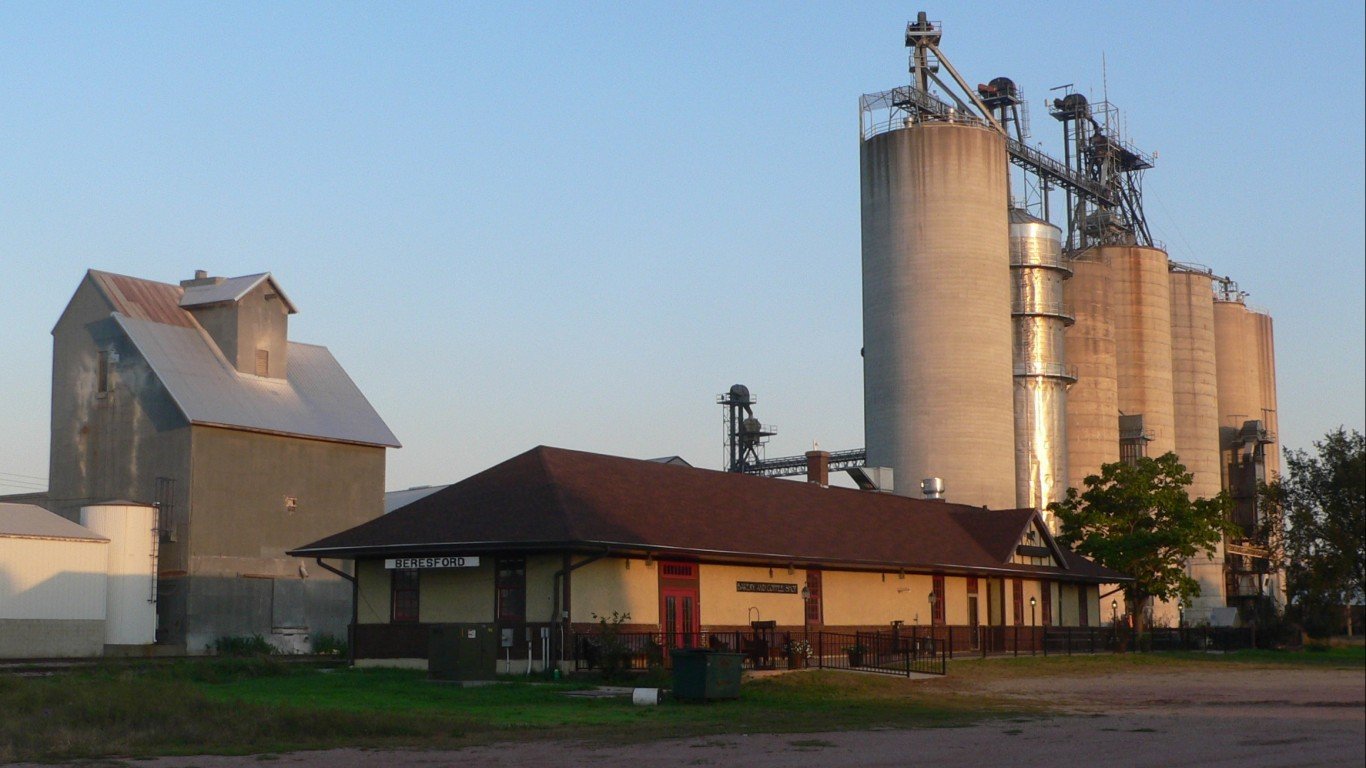
4. Union County, South Dakota
> Early pandemic peak daily growth rate: +18.0 new daily cases per 100,000 (May 2-16)
> Middle pandemic lull: +10.8 new daily cases per 100,000 (Aug 15-29)
> Most recent peak: +26.9 new cases per 100,000 (Aug 30 to Sep 13)
> Confirmed cases as of Sep 13: 2,102 per 100,000 — (total: 319)
> Deaths as of Sep 13: 33 per 100,000 — (total: 5)
> Population: 15,177
[in-text-ad]

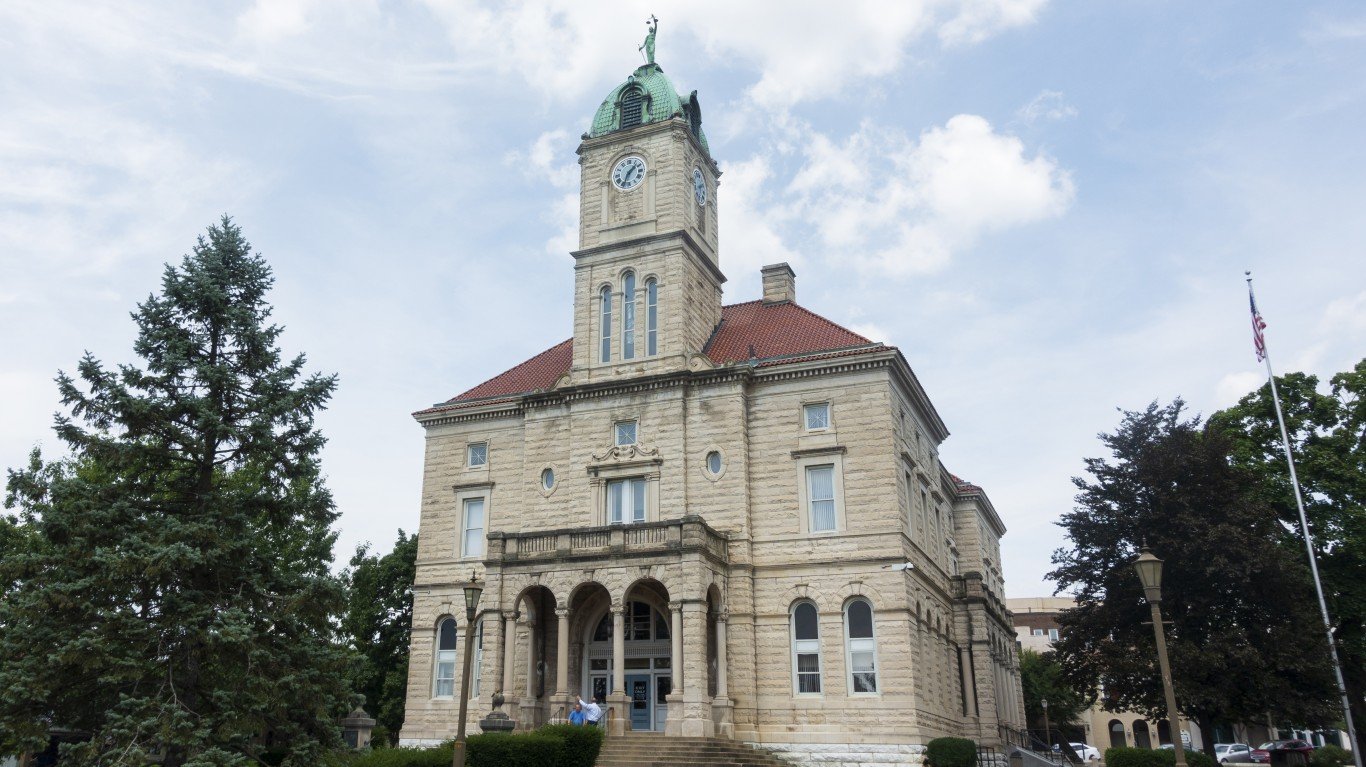
3. Harrisonburg, Virginia
> Early pandemic peak daily growth rate: +25.2 new daily cases per 100,000 (May 2-16)
> Middle pandemic lull: +11.4 new daily cases per 100,000 (Aug 15-29)
> Most recent peak: +105.7 new cases per 100,000 (Aug 30 to Sep 13)
> Confirmed cases as of Sep 13: 4,023 per 100,000 — (total: 2,148)
> Deaths as of Sep 13: 64 per 100,000 — (total: 34)
> Population: 53,391
[recirclink id=737106]
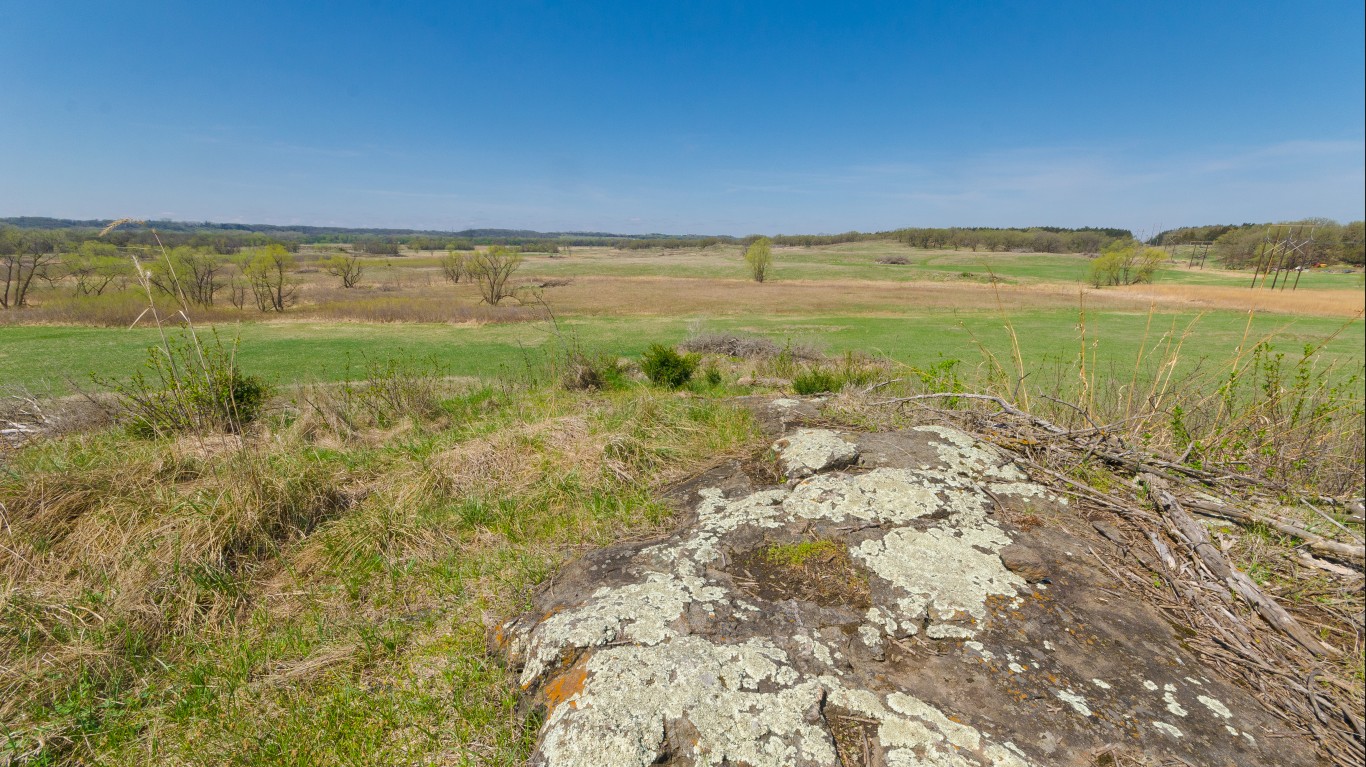
2. Foster County, North Dakota
> Early pandemic peak daily growth rate: +32.7 new daily cases per 100,000 (Jul 31 to Aug 14)
> Middle pandemic lull: +6.1 new daily cases per 100,000 (Aug 15-29)
> Most recent peak: +34.4 new cases per 100,000 (Aug 30 to Sep 13)
> Confirmed cases as of Sep 13: 1,581 per 100,000 — (total: 52)
> Deaths as of Sep 13: No deaths reported
> Population: 3,290
1. Crawford County, Kansas
> Early pandemic peak daily growth rate: +36.7 new daily cases per 100,000 (Jun 16-30)
> Middle pandemic lull: +8.0 new daily cases per 100,000 (Aug 15-29)
> Most recent peak: +50.4 new cases per 100,000 (Aug 30 to Sep 13)
> Confirmed cases as of Sep 13: 1,920 per 100,000 — (total: 751)
> Deaths as of Sep 13: No deaths reported
> Population: 39,108
Methodology
To determine the counties where COVID-19 is resurging, 24/7 Wall St. reviewed data on confirmed COVID-19 cases from local and state health departments. Counties were chosen that met the following criteria: the county had a two-week period of growth in average daily new cases that was at least 150% of the national average (at the time) some time between May 2 and August 14; the county had a below-average number of average daily new cases between Aug. 15 and Aug. 29; and the county again recently had an above-average number of average daily new cases between Aug. 30 and Sept. 13, the most recent period for which data is available.
The case growth in the last two weeks must also be greater than or equal to the case growth in the peak two-week identified for the summer months. These criteria are meant to identify counties in which the growth in new COVID-19 cases spiked during the summer, returned to normal levels, and again spiked in recent weeks. Data on population came from the U.S. Census Bureau and are five-year estimates for 2018.
Contact [email protected] for any questions or corrections.