More than 7.5 million COVID-19 cases have been confirmed in the U.S. as of Oct. 7, by far the most of any country. Though the spread of the novel coronavirus has slowed nationwide, six months since the U.S. declared a national emergency many areas are dealing with resurging outbreaks.
To determine the counties where COVID-19 is resurging — counties in which the growth in new COVID-19 cases spiked during the summer, returned to normal levels, and spiked again in recent weeks — 24/7 Wall St. compiled COVID-19 cases and deaths data in each U.S. county and county equivalent from state and local health departments.
Most places that reported the worst outbreaks in the spring and early summer are doing relatively better now. Southern states that led the country in case growth in early July, like Georgia, South Carolina, and Florida, for example, now have some of the lowest case growth rates of any state. These are the states where the virus spread is slowing.
There is evidence that social distancing was likely a significant driver in decreasing the spread of COVID-19 in the U.S. According to a recent study by researchers from Massachusetts General Hospital, statewide guidelines to keep at least 6 feet apart, wear a mask, and stay home as much as possible reduced the total number of COVID-19 infections by about 55,000 cases within two weeks of the implementation of the measures. Within three weeks, social distancing had reduced the number of cases by more than 600,000 cases.
Despite these improvements, signs of a resurgence in new COVID-19 cases are emerging in a handful of counties. Factors like schools opening, workers returning to physical offices, and the relaxation of precautionary measures like face masks and hand washing may be contributing to the recent spate of local spikes in new coronavirus cases. Here is how schools are managing coronavirus in each state.
Click here to see the places where COVID-19 is resurging.
Click here to see our methodology.

19. Stephenson County, Illinois
> Early pandemic peak daily growth rate: +13.3 new daily cases per 100,000 (May 2 to May 16)
> Middle pandemic lull: +7.4 new daily cases per 100,000 (Aug 30 to Sep 19)
> Most recent peak: +16.6 new cases per 100,000 (Sep 20 to Oct 4)
> Confirmed cases as of Oct 4: 1,279 per 100,000 — (total: 581)
> Deaths as of Oct 4: 7
> Population: 45,433
[in-text-ad]

18. Summit County, Colorado
> Early pandemic peak daily growth rate: +12.8 new daily cases per 100,000 (May 2 to May 16)
> Middle pandemic lull: +5.4 new daily cases per 100,000 (Aug 30 to Sep 19)
> Most recent peak: +17.1 new cases per 100,000 (Sep 20 to Oct 4)
> Confirmed cases as of Oct 4: 1,600 per 100,000 — (total: 487)
> Deaths as of Oct 4: 4
> Population: 30,429
[recirclink id=800100]
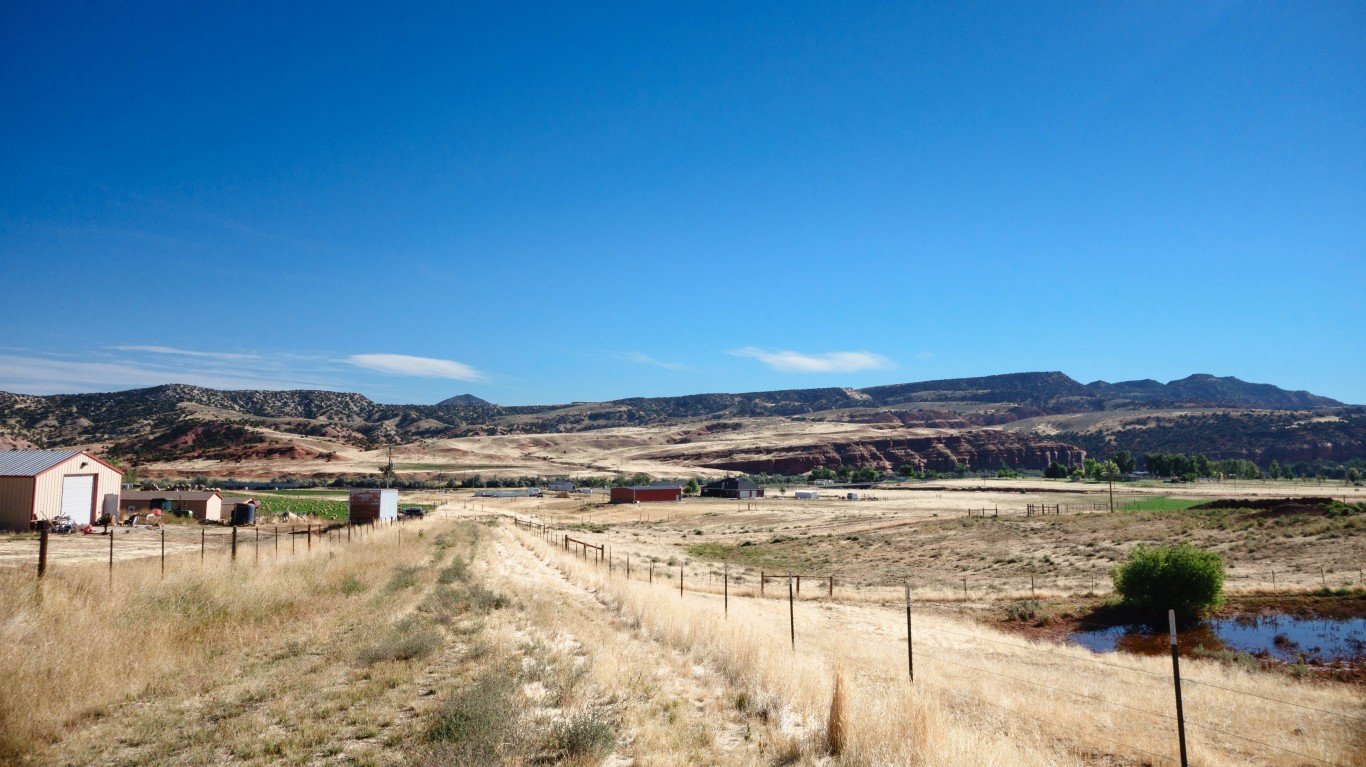
17. Fremont County, Wyoming
> Early pandemic peak daily growth rate: +15.9 new daily cases per 100,000 (May 2 to May 16)
> Middle pandemic lull: +6.6 new daily cases per 100,000 (Aug 30 to Sep 19)
> Most recent peak: +18.7 new cases per 100,000 (Sep 20 to Oct 4)
> Confirmed cases as of Oct 4: 1,976 per 100,000 — (total: 792)
> Deaths as of Oct 4: 14
> Population: 40,076
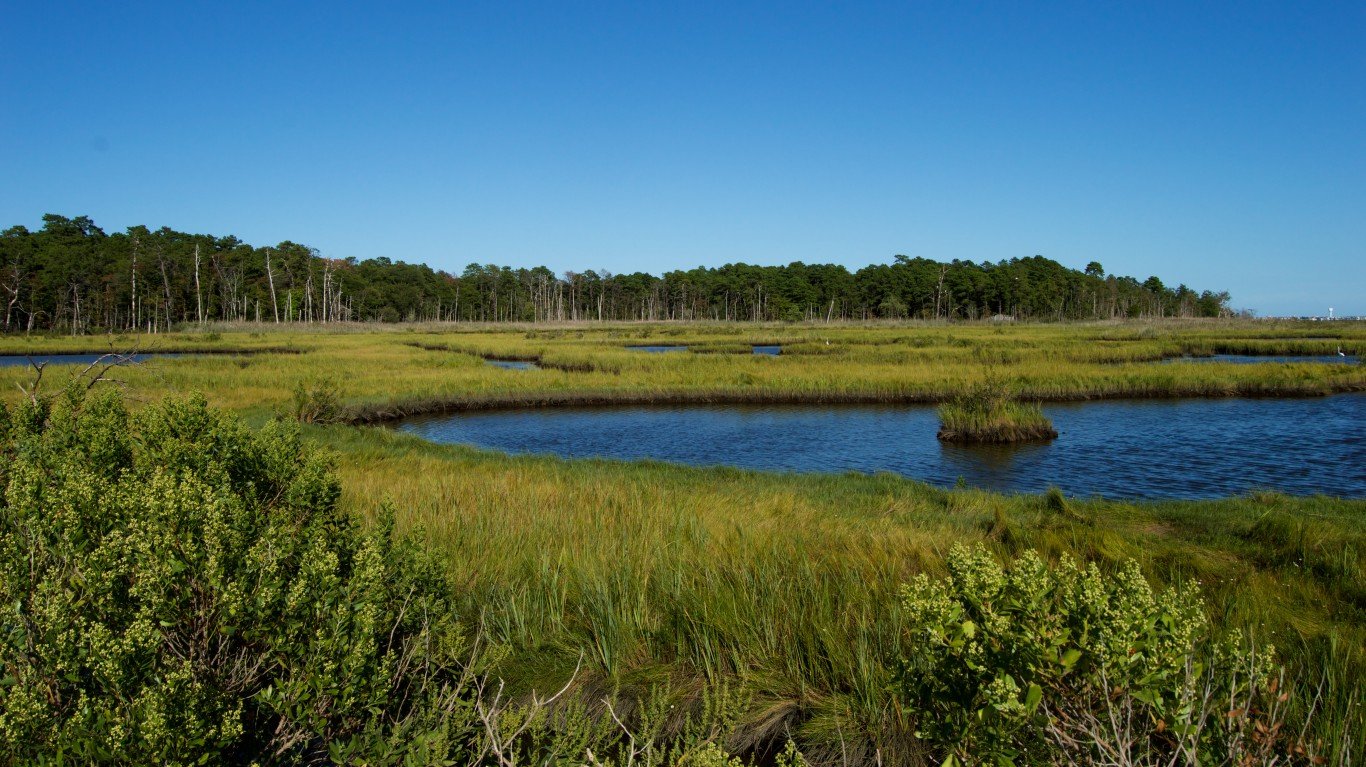
16. Ocean County, New Jersey
> Early pandemic peak daily growth rate: +17.2 new daily cases per 100,000 (May 2 to May 16)
> Middle pandemic lull: +7.3 new daily cases per 100,000 (Aug 30 to Sep 19)
> Most recent peak: +20.9 new cases per 100,000 (Sep 20 to Oct 4)
> Confirmed cases as of Oct 4: 2,406 per 100,000 — (total: 14,244)
> Deaths as of Oct 4: 1,050
> Population: 591,939
[in-text-ad-2]
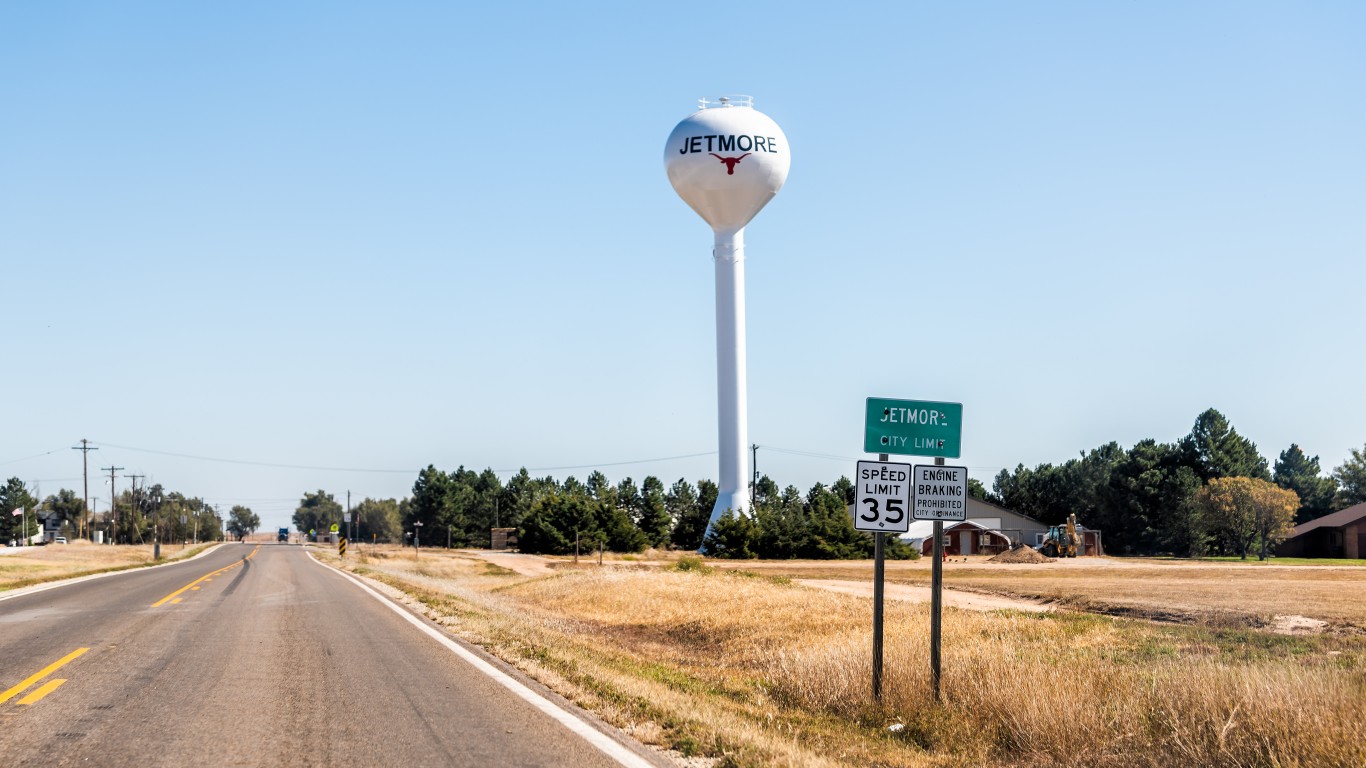
15. Hodgeman County, Kansas
> Early pandemic peak daily growth rate: +12.9 new daily cases per 100,000 (Jun 16 to Jun 30)
> Middle pandemic lull: +2.2 new daily cases per 100,000 (Aug 30 to Sep 19)
> Most recent peak: +24.8 new cases per 100,000 (Sep 20 to Oct 4)
> Confirmed cases as of Oct 4: 1,140 per 100,000 — (total: 21)
> Deaths as of Oct 4: No deaths reported
> Population: 1,842
14. Sully County, South Dakota
> Early pandemic peak daily growth rate: +23.6 new daily cases per 100,000 (Aug 15 to Aug 29)
> Middle pandemic lull: +2.0 new daily cases per 100,000 (Aug 30 to Sep 19)
> Most recent peak: +25.0 new cases per 100,000 (Sep 20 to Oct 4)
> Confirmed cases as of Oct 4: 1,202 per 100,000 — (total: 16)
> Deaths as of Oct 4: No deaths reported
> Population: 1,331
[in-text-ad]

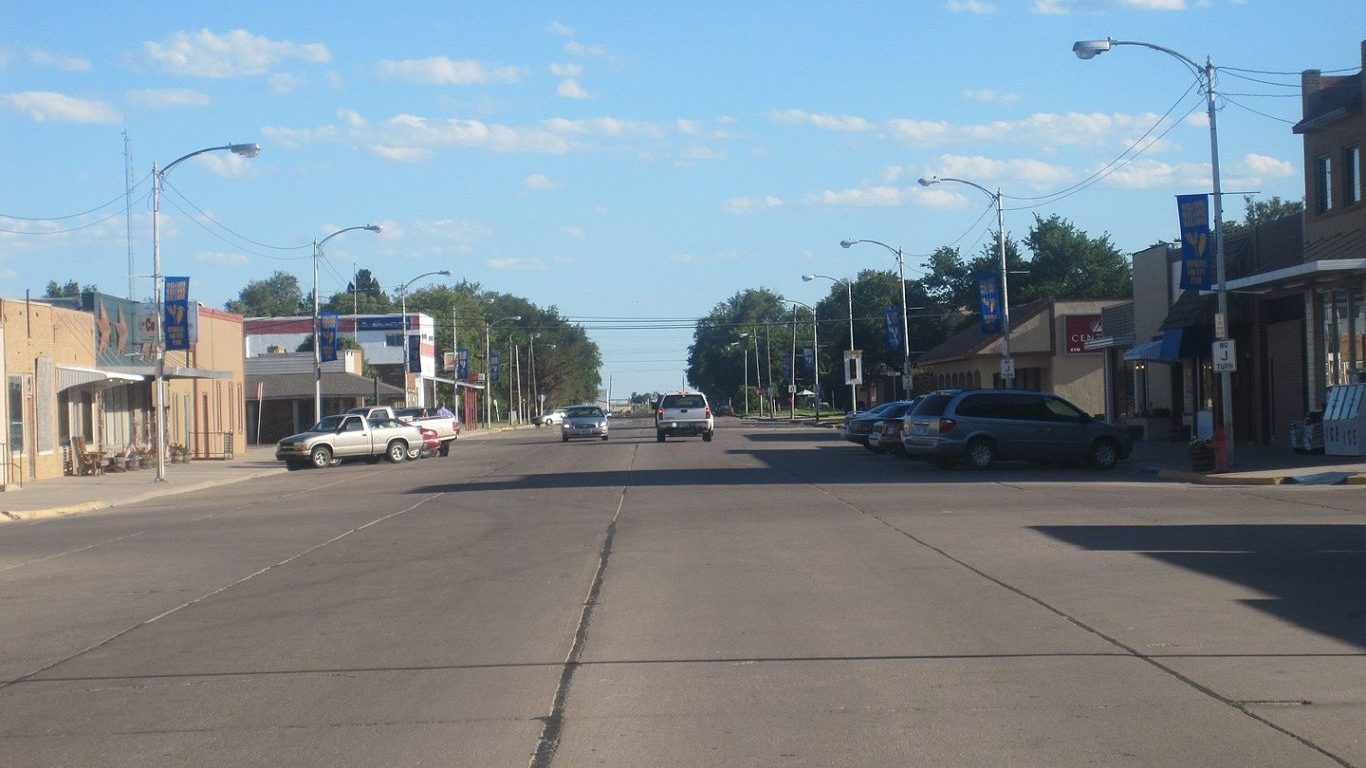
13. Gray County, Kansas
> Early pandemic peak daily growth rate: +18.8 new daily cases per 100,000 (Jul 16 to Jul 30)
> Middle pandemic lull: +7.1 new daily cases per 100,000 (Aug 30 to Sep 19)
> Most recent peak: +25.2 new cases per 100,000 (Sep 20 to Oct 4)
> Confirmed cases as of Oct 4: 1,656 per 100,000 — (total: 100)
> Deaths as of Oct 4: No deaths reported
> Population: 6,037
[recirclink id=770188]

12. Hamilton County, Texas
> Early pandemic peak daily growth rate: +27.2 new daily cases per 100,000 (Jul 31 to Aug 14)
> Middle pandemic lull: +7.3 new daily cases per 100,000 (Aug 30 to Sep 19)
> Most recent peak: +29.7 new cases per 100,000 (Sep 20 to Oct 4)
> Confirmed cases as of Oct 4: 1,862 per 100,000 — (total: 154)
> Deaths as of Oct 4: 4
> Population: 8,269
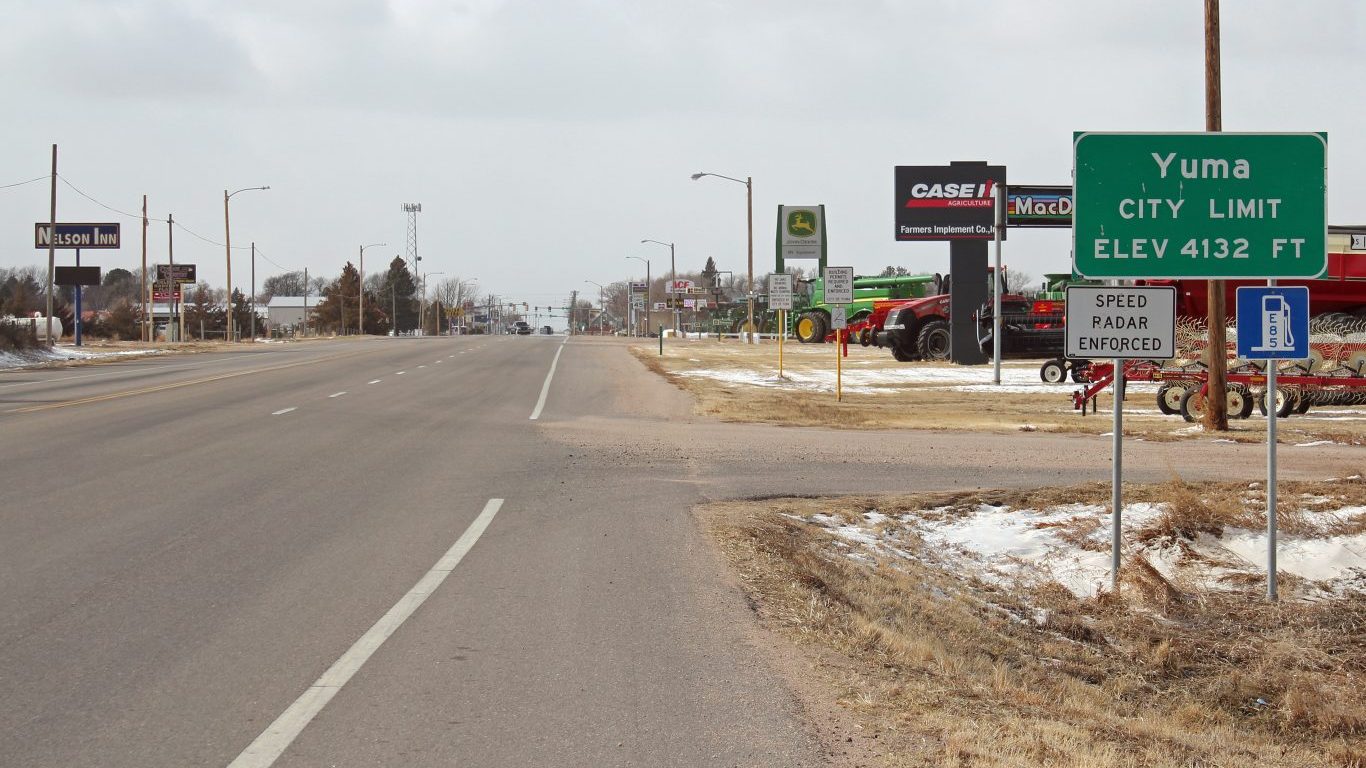
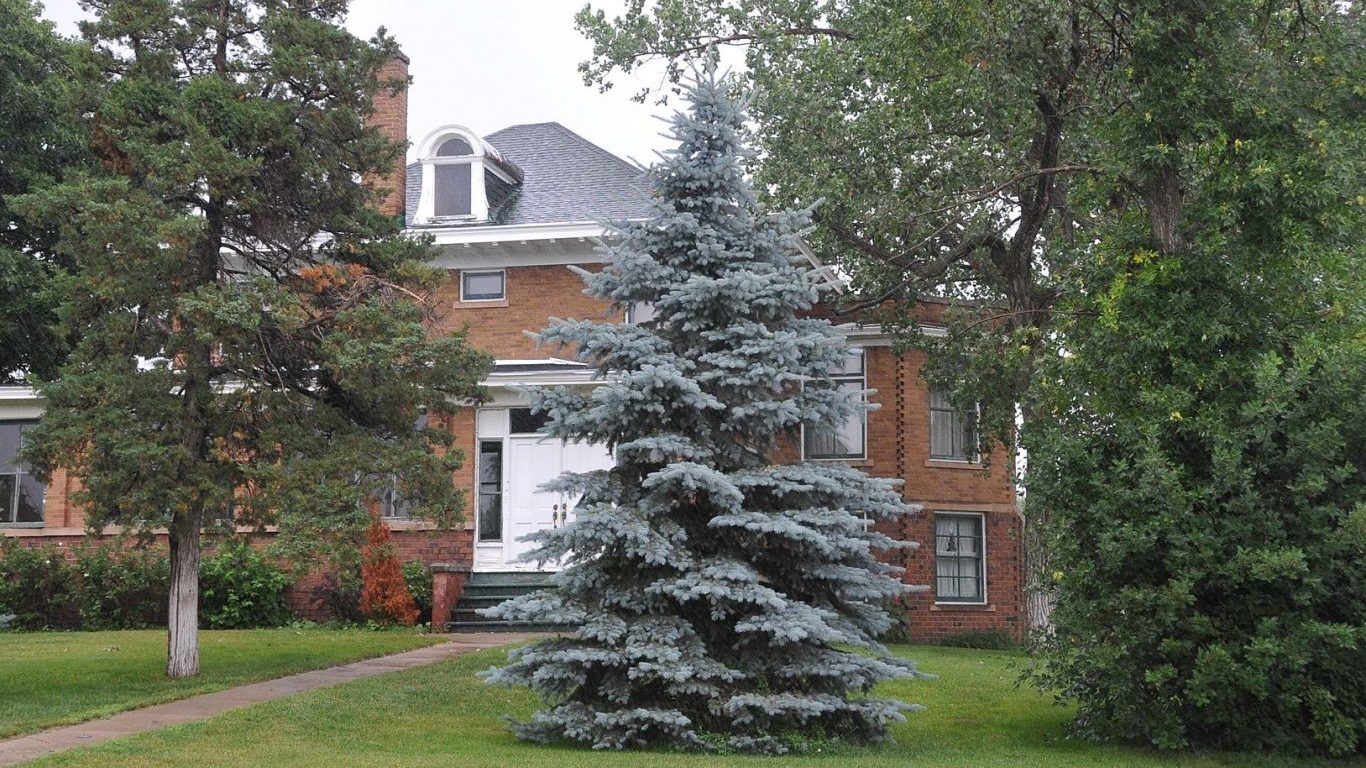
11. Yuma County, Colorado
> Early pandemic peak daily growth rate: +14.7 new daily cases per 100,000 (Jun 1 to Jun 15)
> Middle pandemic lull: +7.2 new daily cases per 100,000 (Aug 30 to Sep 19)
> Most recent peak: +32.1 new cases per 100,000 (Sep 20 to Oct 4)
> Confirmed cases as of Oct 4: 1,311 per 100,000 — (total: 132)
> Deaths as of Oct 4: 1
> Population: 10,069
[in-text-ad-2]
10. Haskell County, Kansas
> Early pandemic peak daily growth rate: +15.1 new daily cases per 100,000 (May 2 to May 16)
> Middle pandemic lull: +5.7 new daily cases per 100,000 (Aug 30 to Sep 19)
> Most recent peak: +34.6 new cases per 100,000 (Sep 20 to Oct 4)
> Confirmed cases as of Oct 4: 1,804 per 100,000 — (total: 73)
> Deaths as of Oct 4: No deaths reported
> Population: 4,047

9. Tallapoosa County, Alabama
> Early pandemic peak daily growth rate: +21.5 new daily cases per 100,000 (Jul 16 to Jul 30)
> Middle pandemic lull: +5.3 new daily cases per 100,000 (Aug 30 to Sep 19)
> Most recent peak: +35.7 new cases per 100,000 (Sep 20 to Oct 4)
> Confirmed cases as of Oct 4: 2,941 per 100,000 — (total: 1,195)
> Deaths as of Oct 4: 85
> Population: 40,636
[in-text-ad]
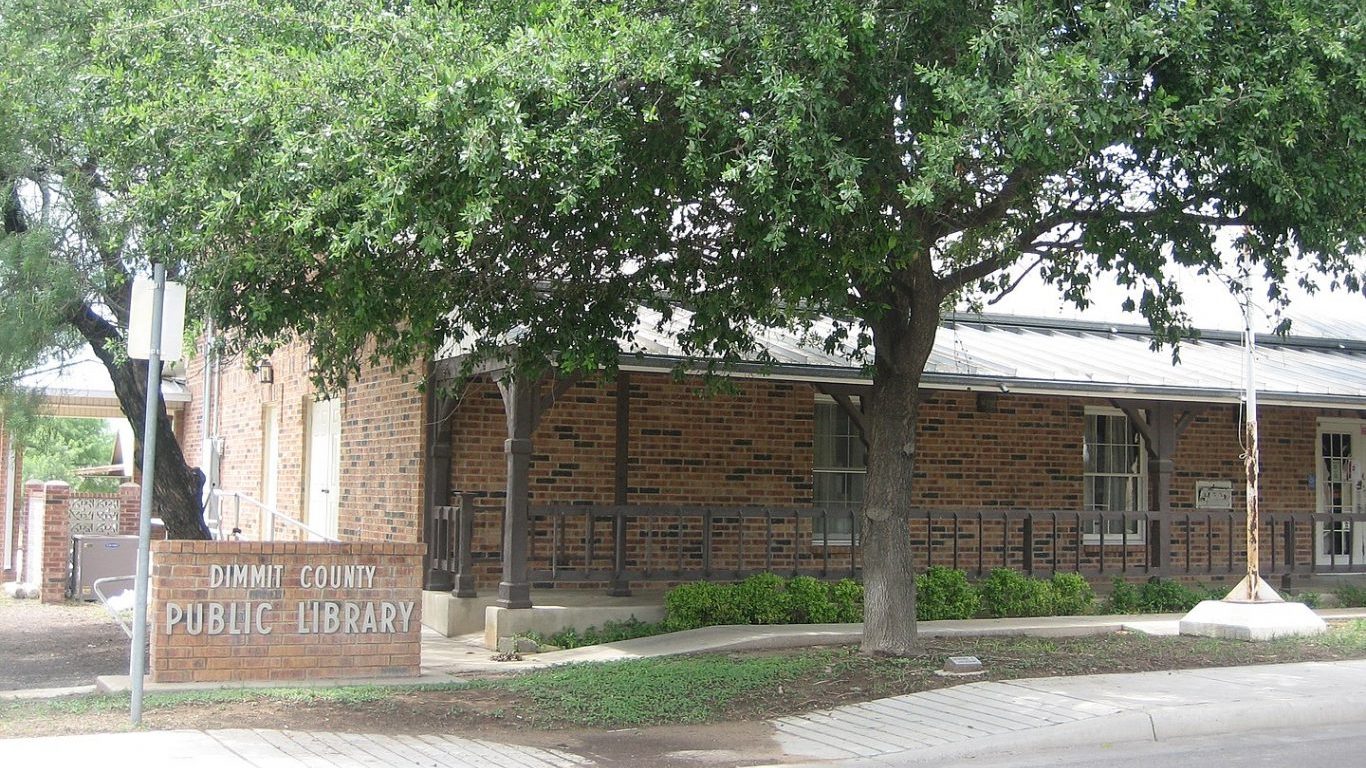
8. Dimmit County, Texas
> Early pandemic peak daily growth rate: +38.5 new daily cases per 100,000 (Jul 16 to Jul 30)
> Middle pandemic lull: +7.3 new daily cases per 100,000 (Aug 30 to Sep 19)
> Most recent peak: +41.2 new cases per 100,000 (Sep 20 to Oct 4)
> Confirmed cases as of Oct 4: 2,420 per 100,000 — (total: 258)
> Deaths as of Oct 4: 7
> Population: 10,663
[recirclink id=800388]
7. Cassia County, Idaho
> Early pandemic peak daily growth rate: +33.0 new daily cases per 100,000 (Jul 1 to Jul 15)
> Middle pandemic lull: +7.8 new daily cases per 100,000 (Aug 30 to Sep 19)
> Most recent peak: +45.0 new cases per 100,000 (Sep 20 to Oct 4)
> Confirmed cases as of Oct 4: 3,413 per 100,000 — (total: 806)
> Deaths as of Oct 4: 6
> Population: 23,615
6. Monroe County, Alabama
> Early pandemic peak daily growth rate: +29.9 new daily cases per 100,000 (Jul 16 to Jul 30)
> Middle pandemic lull: +0.3 new daily cases per 100,000 (Aug 30 to Sep 19)
> Most recent peak: +45.6 new cases per 100,000 (Sep 20 to Oct 4)
> Confirmed cases as of Oct 4: 2,775 per 100,000 — (total: 597)
> Deaths as of Oct 4: 8
> Population: 21,512
[in-text-ad-2]

5. Sanborn County, South Dakota
> Early pandemic peak daily growth rate: +23.5 new daily cases per 100,000 (May 17 to May 31)
> Middle pandemic lull: +7.4 new daily cases per 100,000 (Aug 30 to Sep 19)
> Most recent peak: +46.3 new cases per 100,000 (Sep 20 to Oct 4)
> Confirmed cases as of Oct 4: 1,675 per 100,000 — (total: 40)
> Deaths as of Oct 4: No deaths reported
> Population: 2,388

4. Chambers County, Alabama
> Early pandemic peak daily growth rate: +25.3 new daily cases per 100,000 (Jul 1 to Jul 15)
> Middle pandemic lull: +1.7 new daily cases per 100,000 (Aug 30 to Sep 19)
> Most recent peak: +62.8 new cases per 100,000 (Sep 20 to Oct 4)
> Confirmed cases as of Oct 4: 3,562 per 100,000 — (total: 1,205)
> Deaths as of Oct 4: 42
> Population: 33,826
[in-text-ad]

3. Barbour County, Alabama
> Early pandemic peak daily growth rate: +33.6 new daily cases per 100,000 (Jul 16 to Jul 30)
> Middle pandemic lull: +1.5 new daily cases per 100,000 (Aug 30 to Sep 19)
> Most recent peak: +69.7 new cases per 100,000 (Sep 20 to Oct 4)
> Confirmed cases as of Oct 4: 3,572 per 100,000 — (total: 921)
> Deaths as of Oct 4: 7
> Population: 25,782
[recirclink id=800463]

2. Guadalupe County, Texas
> Early pandemic peak daily growth rate: +21.7 new daily cases per 100,000 (Jul 16 to Jul 30)
> Middle pandemic lull: +2.3 new daily cases per 100,000 (Aug 30 to Sep 19)
> Most recent peak: +71.5 new cases per 100,000 (Sep 20 to Oct 4)
> Confirmed cases as of Oct 4: 2,348 per 100,000 — (total: 3,643)
> Deaths as of Oct 4: 78
> Population: 155,137

1. Covington County, Alabama
> Early pandemic peak daily growth rate: +38.3 new daily cases per 100,000 (Jul 16 to Jul 30)
> Middle pandemic lull: +5.0 new daily cases per 100,000 (Aug 30 to Sep 19)
> Most recent peak: +104.8 new cases per 100,000 (Sep 20 to Oct 4)
> Confirmed cases as of Oct 4: 3,957 per 100,000 — (total: 1,478)
> Deaths as of Oct 4: 28
> Population: 37,351
Methodology:
To determine the counties where COVID-19 is resurging — counties in which the growth in new COVID-19 cases spiked during the summer, returned to normal levels, and spiked again in recent weeks — 24/7 Wall St. compiled COVID-19 cases and deaths data in each U.S. county and county equivalent from state and local health departments. The places on this list are the only counties in the country that meet the following criteria:
The county had a two-week period of growth in average daily new cases per capita that was at least 150% of the national average some time between May 2 and Aug. 29.
The number of average daily new cases per capita in the county from Aug. 30 to Sept. 19 was at least 150% less than the national growth rate.
The county again recently had an above-average number of average daily new cases per capita between Sept. 20 and Oct. 4, the most recent two-week period for which data is available.
To determine the counties where COVID-19 is resurging, 24/7 Wall St. reviewed data on confirmed COVID-19 cases from local and state health departments. Counties were chosen that met the following criteria: the county had a two-week period of growth in average daily new cases per capita that was at least 150% of the national average (at the time) some time between May 2 and Aug. 29; the number of average daily new cases per capita from Aug. 30 to Sept. 19 was at least 150% less than the national growth rate; and the county again recently had an above-average number of average daily new cases per capita between Sept. 20 and Oct. 4, the most recent two-week period for which data is available.
The case growth in the last two weeks must also be greater than or equal to the case growth in the peak two-week identified for the summer months. These criteria are meant to identify counties in which the growth in new COVID-19 cases spiked during the summer, returned to normal levels, and spiked again in recent weeks. Data on population came from the U.S. Census Bureau and are five-year estimates for 2018.
Contact [email protected] for any questions or corrections.