There are 3,143 counties and county equivalents in the 50 U.S. states, according to the Census Bureau. Of those, 704 of those are completely rural, meaning 100% of their population lives in rural areas. In another 29 counties, 0% of the population lives in rural areas. Depending on their rurality, counties can be mostly urban or mostly rural.
In recent years, some rural counties have undergone a boom in residents – bucking the overall trend of rural areas bleeding residents. A recent reason for counties growing could be the pandemic forcing people to reassess where they live and work, with telework enabling employees to reside anywhere without the hassle of a tedious commute in or into a crowded city.
Other reasons could include availability of cheaper housing outside major urban areas, or simply the fact that rural counties have smaller populations to begin with, so any number of newcomers would significantly boost their headcount. This is America’s fastest growing county.
To determine the 50 rural counties that stopped shrinking, 24/7 Wall St. reviewed historical population data from the U.S. Census Bureau. Counties that reported overall population decline from 1960 to 2010 were ranked based on percentage increase in population from 2010 to 2020. Only counties with at least 50% of the population residing in rural areas were considered.
Whatever the reason, these 50 mostly rural counties have attracted residents in the past decade, some of them growing at a faster pace than the national growth over that time. Unfortunately, it doesn’t reverse the longer term trend.
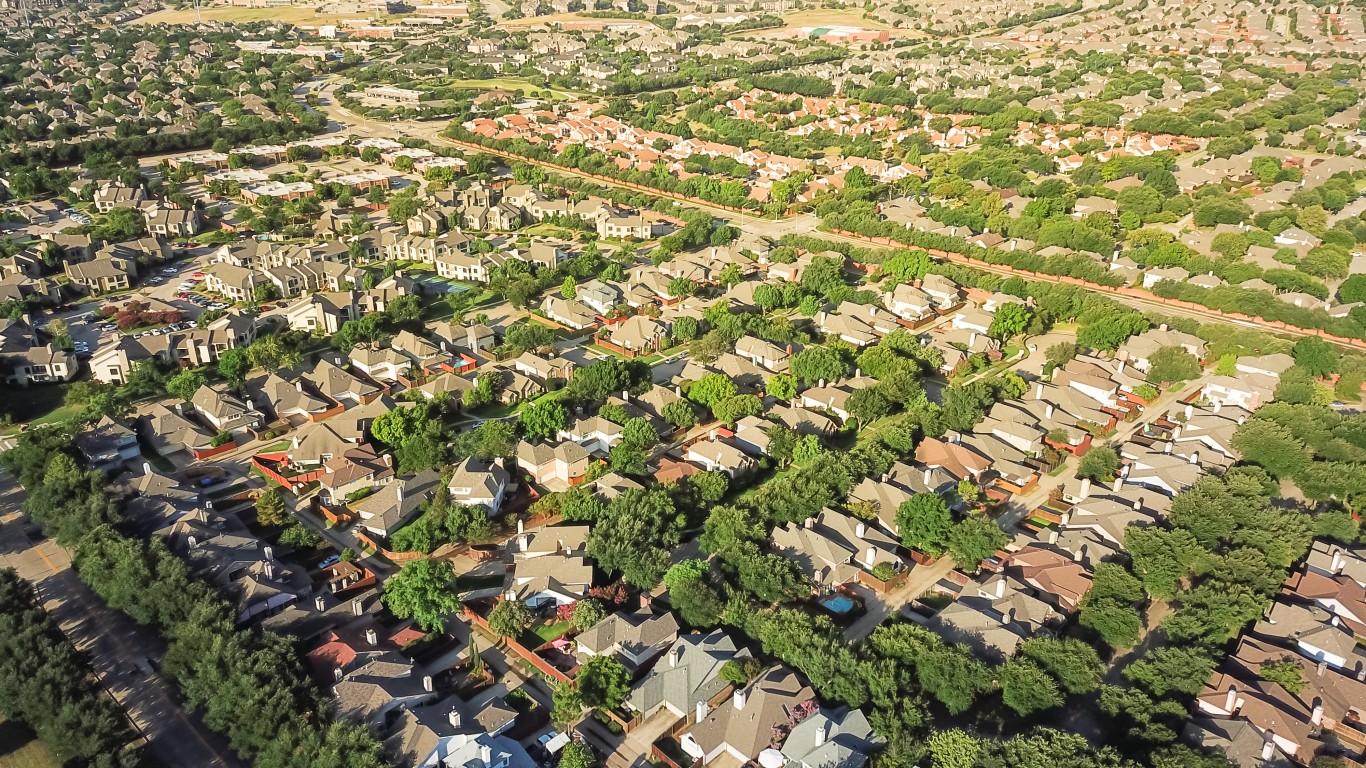
Citing statistics from the Census Bureau, a Pew Charitable Trusts report estimates rural areas were hit with a 0.5% decline in population between 2010 and 2020, losing 226,000 people. Cities and suburban areas, meanwhile, gained 21 million, an 8% increase. Some of those leaving certain counties are probably hightailing it to the 25 cities Americans are flocking to.
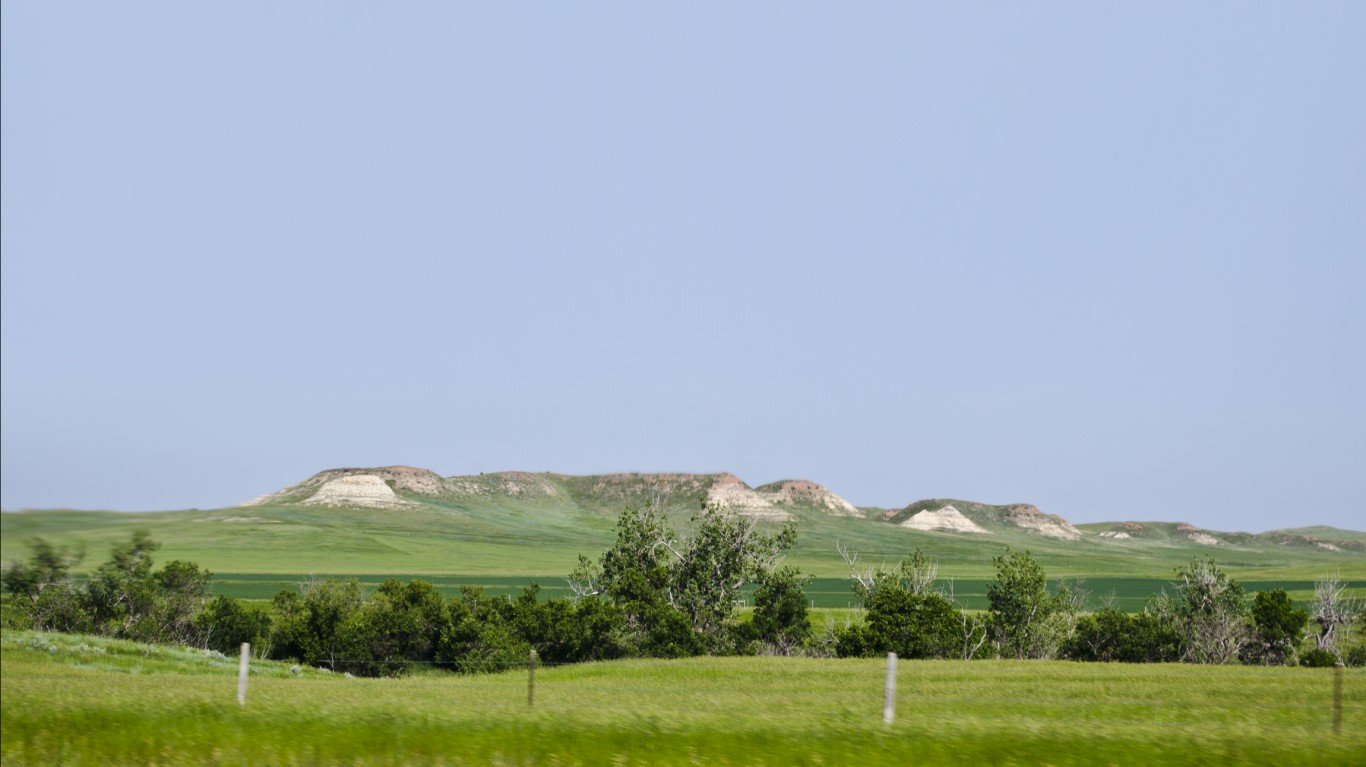
According to the 2010 Decennial Census, 60 million people, or roughly 19% of the U.S. population, resided in a rural area. But what exactly constitutes a rural area? The Census Bureau defines any region not classified as urbanized or an urban cluster as rural. An urbanized area is one with a population of 50,000 or more, while an urban cluster is home to between 2,500 to less than 50,000 people.
Still, “although less than one-fifth of the U.S. population lives in rural areas, these areas encompass about 97% of the total land area in the United States,” the Census Bureau notes.
On this list, the rural counties that stopped shrinking are located mostly in the West, Midwest, and South, with 11 in North Dakota and seven in Nebraska. No county in the densely-populated Eastern Seaboard states or California made the ranking.
Topping the list is McKenzie County in western North Dakota on the border of Montana. Between 2010 and 2020, its population skyrocketed nearly 140%, pushing its population to more than 15,000 residents. Several counties on the list have fewer than 1,000 residents, including Petroleum County in Montana with 500 and Loup County in Nebraska with 650.
Click here to see the 50 shrinking rural counties that are now growing
Click here to read our detailed methodology

50. Aleutians West Census Area, Alaska
> Population increase, 2010 to 2020: +2.1%
> Population decline, 1960 to 2010: -7.5%
> Real per capita income, 1959: Not available
> Real per capita income, 2019: $39,647
> Total population, 2020: 5,680
[in-text-ad]

49. Petroleum County, Montana
> Population increase, 2010 to 2020: +2.2%
> Population decline, 1960 to 2010: -45.3%
> Real per capita income, 1959: $13,486
> Real per capita income, 2019: $31,177
> Total population, 2020: 500
[recirclink id=949894]

48. Wallowa County, Oregon
> Population increase, 2010 to 2020: +2.4%
> Population decline, 1960 to 2010: -1.3%
> Real per capita income, 1959: $13,511
> Real per capita income, 2019: $30,485
> Total population, 2020: 7,181
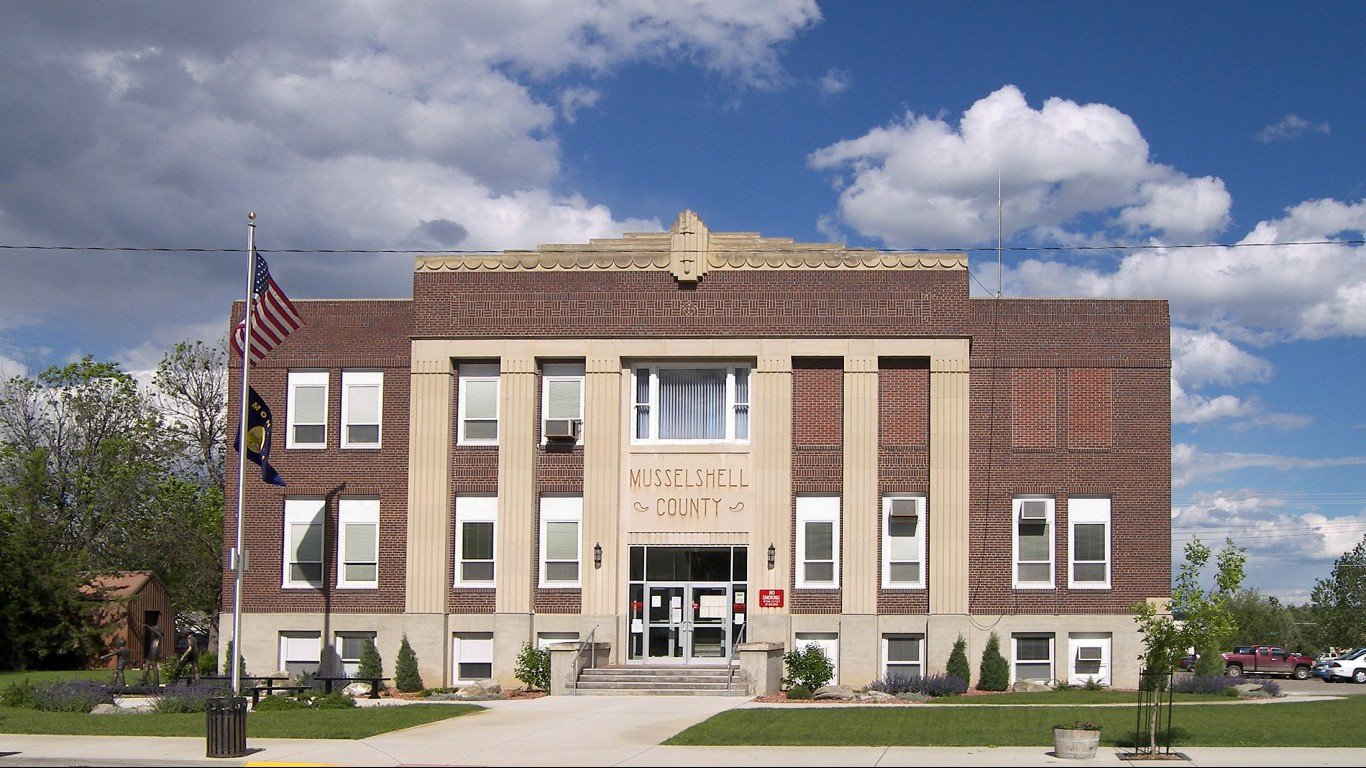
47. Musselshell County, Montana
> Population increase, 2010 to 2020: +2.5%
> Population decline, 1960 to 2010: -6.8%
> Real per capita income, 1959: $14,709
> Real per capita income, 2019: $24,979
> Total population, 2020: 4,669
[in-text-ad-2]
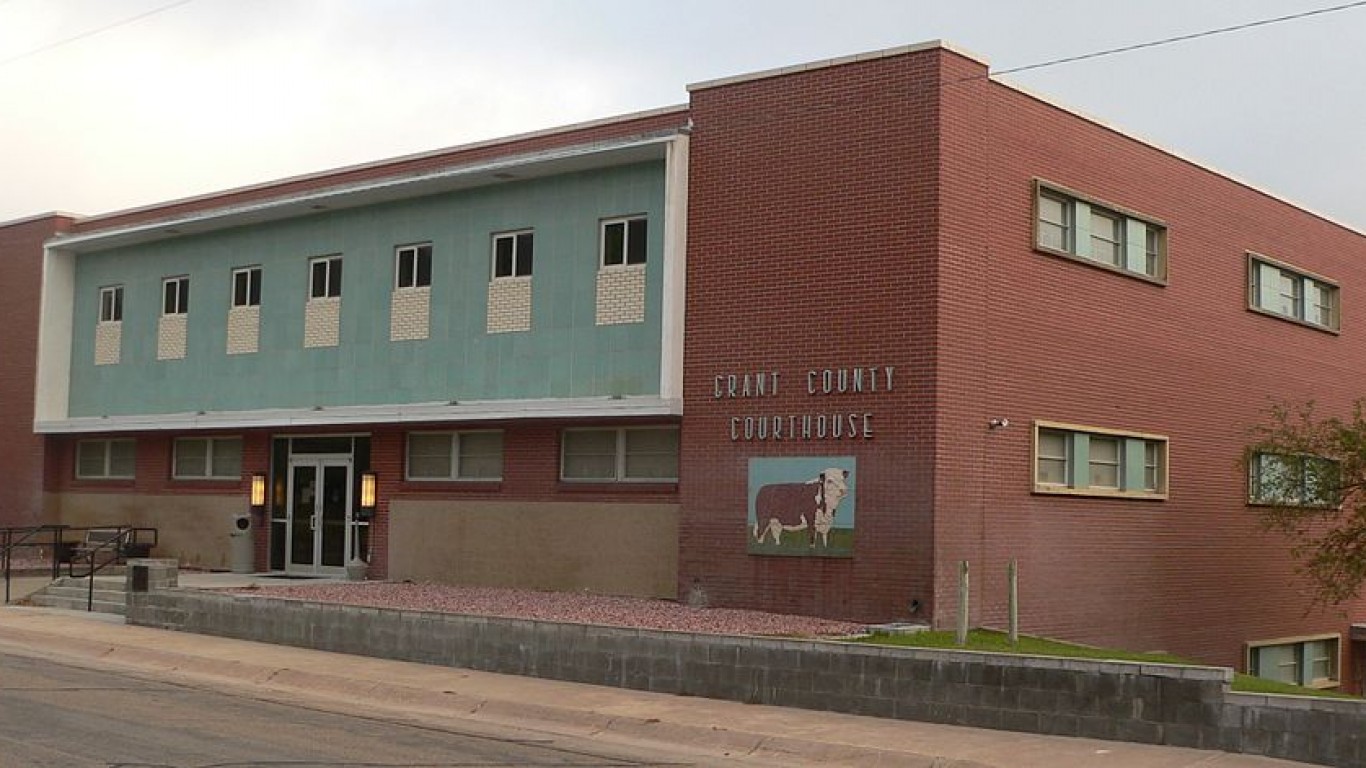
46. Grant County, Nebraska
> Population increase, 2010 to 2020: +2.6%
> Population decline, 1960 to 2010: -39.1%
> Real per capita income, 1959: $9,668
> Real per capita income, 2019: $23,264
> Total population, 2020: 630

45. Sargent County, North Dakota
> Population increase, 2010 to 2020: +2.6%
> Population decline, 1960 to 2010: -44.4%
> Real per capita income, 1959: $7,022
> Real per capita income, 2019: $37,105
> Total population, 2020: 3,913
[in-text-ad]
44. Kearney County, Nebraska
> Population increase, 2010 to 2020: +2.7%
> Population decline, 1960 to 2010: -1.6%
> Real per capita income, 1959: $8,964
> Real per capita income, 2019: $31,094
> Total population, 2020: 6,652
[recirclink id=989112]

43. Pope County, Minnesota
> Population increase, 2010 to 2020: +2.8%
> Population decline, 1960 to 2010: -7.9%
> Real per capita income, 1959: $11,560
> Real per capita income, 2019: $34,166
> Total population, 2020: 11,277
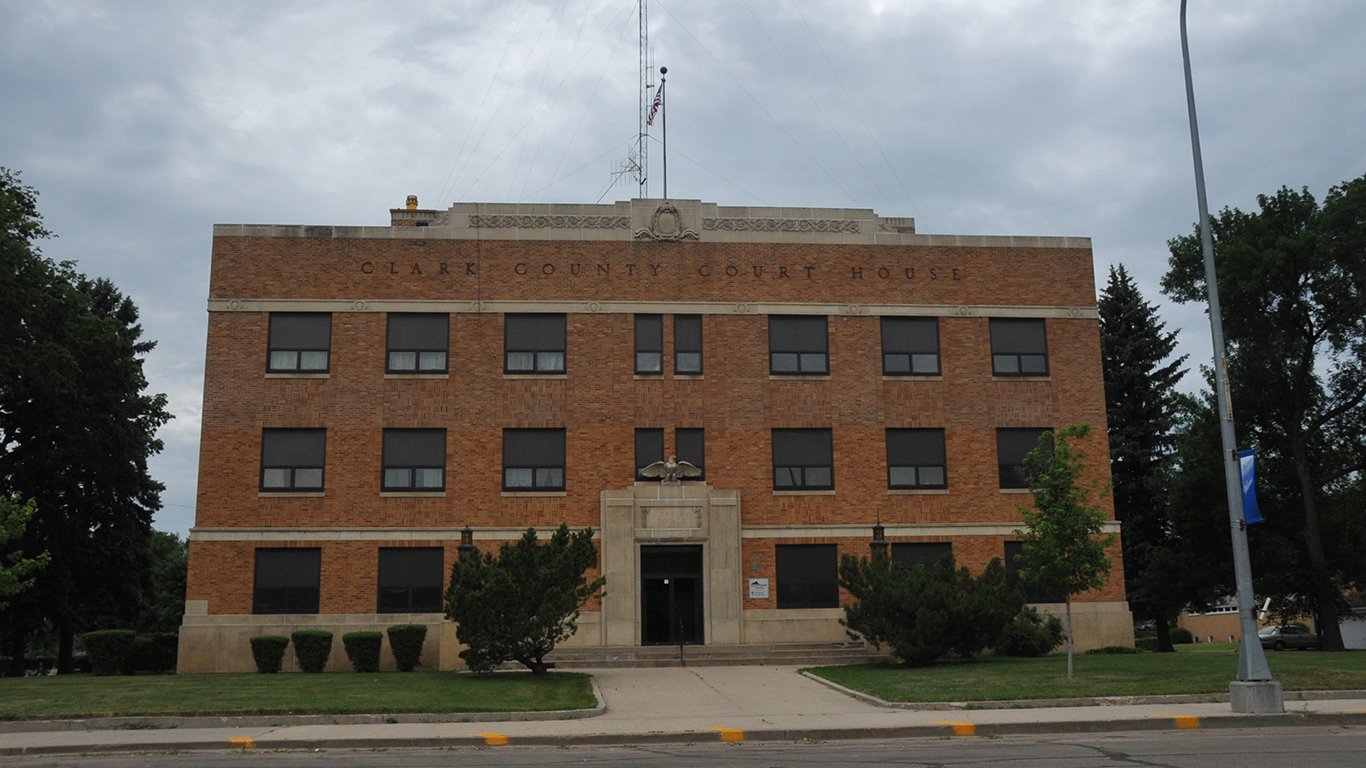
42. Clark County, South Dakota
> Population increase, 2010 to 2020: +2.8%
> Population decline, 1960 to 2010: -48.2%
> Real per capita income, 1959: $7,257
> Real per capita income, 2019: $30,991
> Total population, 2020: 3,802
[in-text-ad-2]

41. Bear Lake County, Idaho
> Population increase, 2010 to 2020: +2.9%
> Population decline, 1960 to 2010: -16.5%
> Real per capita income, 1959: $13,682
> Real per capita income, 2019: $26,378
> Total population, 2020: 6,143

40. Teton County, Montana
> Population increase, 2010 to 2020: +2.9%
> Population decline, 1960 to 2010: -16.7%
> Real per capita income, 1959: $11,795
> Real per capita income, 2019: $28,022
> Total population, 2020: 6,249
[in-text-ad]

39. Huerfano County, Colorado
> Population increase, 2010 to 2020: +3.0%
> Population decline, 1960 to 2010: -15.1%
> Real per capita income, 1959: $28,648
> Real per capita income, 2019: $25,140
> Total population, 2020: 6,883
[recirclink id=983373]

38. Mellette County, South Dakota
> Population increase, 2010 to 2020: +3.1%
> Population decline, 1960 to 2010: -23.9%
> Real per capita income, 1959: $12,152
> Real per capita income, 2019: $13,784
> Total population, 2020: 2,089

37. Davis County, Iowa
> Population increase, 2010 to 2020: +3.1%
> Population decline, 1960 to 2010: -4.6%
> Real per capita income, 1959: $13,350
> Real per capita income, 2019: $29,387
> Total population, 2020: 9,051
[in-text-ad-2]

36. Golden Valley County, North Dakota
> Population increase, 2010 to 2020: +3.3%
> Population decline, 1960 to 2010: -45.7%
> Real per capita income, 1959: $10,171
> Real per capita income, 2019: $33,111
> Total population, 2020: 1,737

35. Howard County, Nebraska
> Population increase, 2010 to 2020: +3.3%
> Population decline, 1960 to 2010: -4.0%
> Real per capita income, 1959: $12,904
> Real per capita income, 2019: $27,489
> Total population, 2020: 6,488
[in-text-ad]

34. Loup County, Nebraska
> Population increase, 2010 to 2020: +3.5%
> Population decline, 1960 to 2010: -42.8%
> Real per capita income, 1959: $11,618
> Real per capita income, 2019: $27,726
> Total population, 2020: 650
[recirclink id=1008724]
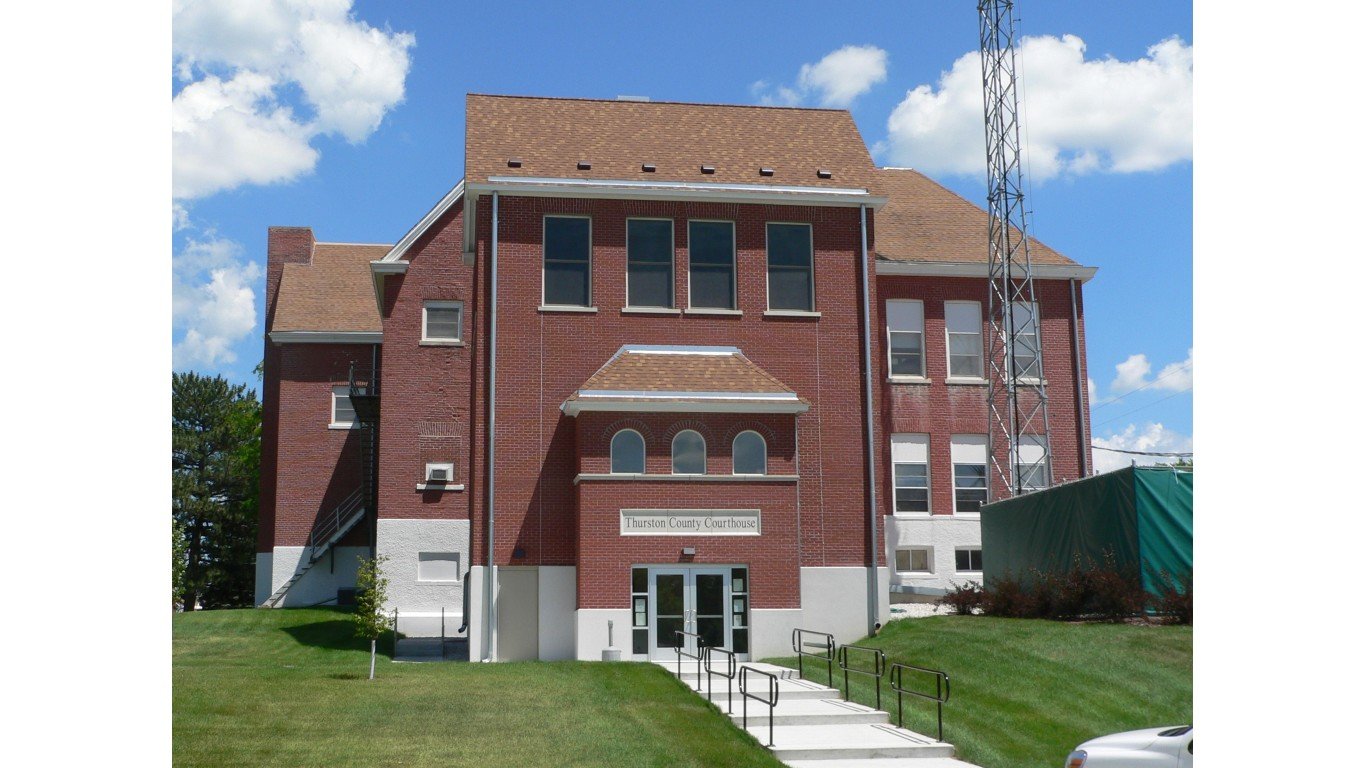
33. Thurston County, Nebraska
> Population increase, 2010 to 2020: +3.6%
> Population decline, 1960 to 2010: -3.7%
> Real per capita income, 1959: $13,001
> Real per capita income, 2019: $20,141
> Total population, 2020: 7,220

32. Clearwater County, Minnesota
> Population increase, 2010 to 2020: +3.6%
> Population decline, 1960 to 2010: -1.8%
> Real per capita income, 1959: $12,702
> Real per capita income, 2019: $27,178
> Total population, 2020: 9,017
[in-text-ad-2]

31. Wallace County, Kansas
> Population increase, 2010 to 2020: +3.8%
> Population decline, 1960 to 2010: -28.5%
> Real per capita income, 1959: $10,492
> Real per capita income, 2019: $27,966
> Total population, 2020: 1,536
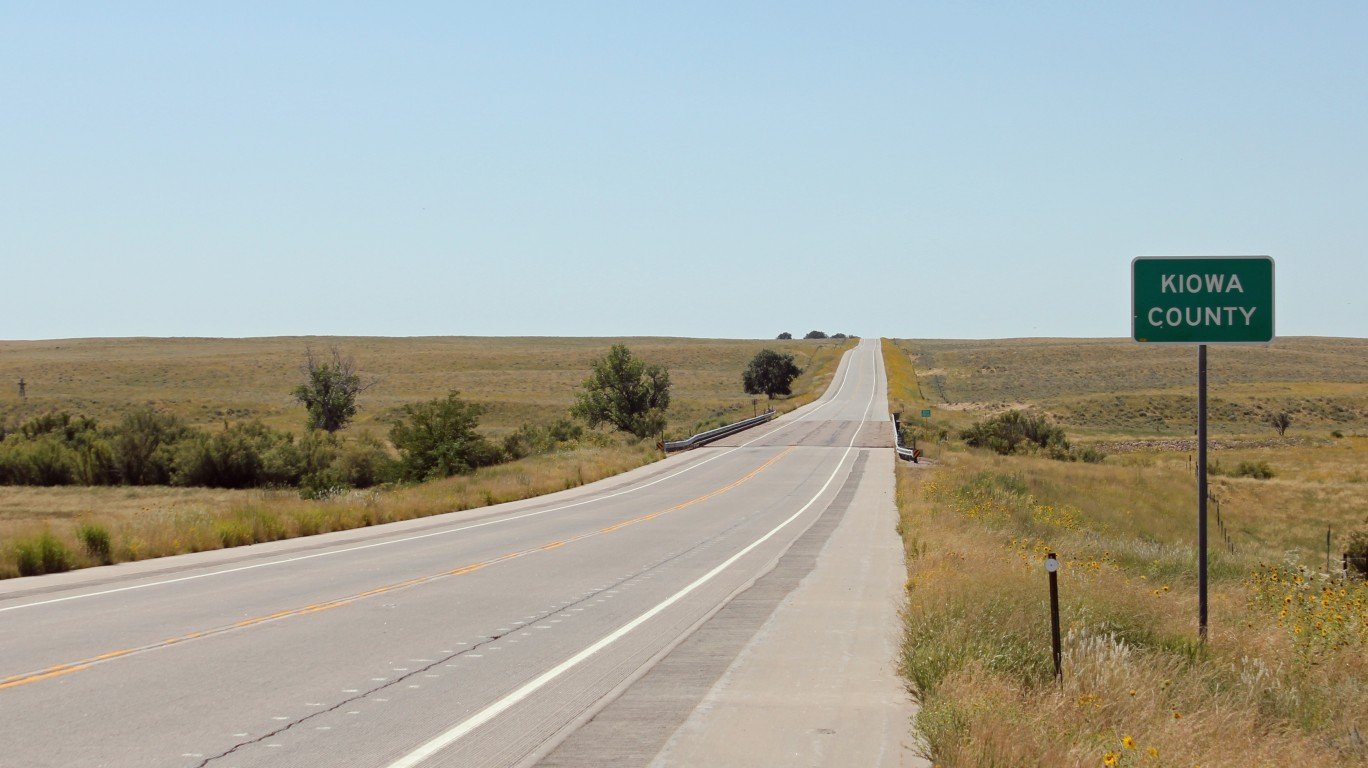
30. Kiowa County, Colorado
> Population increase, 2010 to 2020: +3.8%
> Population decline, 1960 to 2010: -42.1%
> Real per capita income, 1959: $18,422
> Real per capita income, 2019: $25,937
> Total population, 2020: 1,458
[in-text-ad]

29. Oliver County, North Dakota
> Population increase, 2010 to 2020: +4.6%
> Population decline, 1960 to 2010: -29.5%
> Real per capita income, 1959: $10,226
> Real per capita income, 2019: $35,565
> Total population, 2020: 1,926
[recirclink id=1013388]

28. McLean County, North Dakota
> Population increase, 2010 to 2020: +4.6%
> Population decline, 1960 to 2010: -35.9%
> Real per capita income, 1959: $10,696
> Real per capita income, 2019: $36,428
> Total population, 2020: 9,416

27. Hanson County, South Dakota
> Population increase, 2010 to 2020: +4.7%
> Population decline, 1960 to 2010: -27.3%
> Real per capita income, 1959: $8,478
> Real per capita income, 2019: $24,948
> Total population, 2020: 3,489
[in-text-ad-2]

26. Lincoln County, Washington
> Population increase, 2010 to 2020: +4.9%
> Population decline, 1960 to 2010: -3.2%
> Real per capita income, 1959: $13,608
> Real per capita income, 2019: $28,891
> Total population, 2020: 11,090

25. Lavaca County, Texas
> Population increase, 2010 to 2020: +4.9%
> Population decline, 1960 to 2010: -4.5%
> Real per capita income, 1959: $7,614
> Real per capita income, 2019: $32,188
> Total population, 2020: 20,216
[in-text-ad]

24. Gilliam County, Oregon
> Population increase, 2010 to 2020: +5.1%
> Population decline, 1960 to 2010: -38.7%
> Real per capita income, 1959: $14,078
> Real per capita income, 2019: $26,482
> Total population, 2020: 1,975
[recirclink id=949894]

23. Jenkins County, Georgia
> Population increase, 2010 to 2020: +5.1%
> Population decline, 1960 to 2010: -9.1%
> Real per capita income, 1959: $5,866
> Real per capita income, 2019: $15,531
> Total population, 2020: 8,746

22. Marshall County, South Dakota
> Population increase, 2010 to 2020: +5.2%
> Population decline, 1960 to 2010: -30.3%
> Real per capita income, 1959: $9,604
> Real per capita income, 2019: $32,472
> Total population, 2020: 4,884
[in-text-ad-2]

21. Harding County, South Dakota
> Population increase, 2010 to 2020: +5.2%
> Population decline, 1960 to 2010: -47.4%
> Real per capita income, 1959: $6,358
> Real per capita income, 2019: $31,819
> Total population, 2020: 1,311

20. Hamlin County, South Dakota
> Population increase, 2010 to 2020: +5.4%
> Population decline, 1960 to 2010: -6.2%
> Real per capita income, 1959: $11,884
> Real per capita income, 2019: $28,822
> Total population, 2020: 6,234
[in-text-ad]

19. McHenry County, North Dakota
> Population increase, 2010 to 2020: +5.4%
> Population decline, 1960 to 2010: -51.3%
> Real per capita income, 1959: $6,560
> Real per capita income, 2019: $36,980
> Total population, 2020: 5,695
[recirclink id=989112]

18. San Juan County, Colorado
> Population increase, 2010 to 2020: +5.6%
> Population decline, 1960 to 2010: -16.6%
> Real per capita income, 1959: $8,754
> Real per capita income, 2019: $34,502
> Total population, 2020: 748

17. Garfield County, Montana
> Population increase, 2010 to 2020: +6.4%
> Population decline, 1960 to 2010: -39.8%
> Real per capita income, 1959: $13,090
> Real per capita income, 2019: $28,541
> Total population, 2020: 1,268
[in-text-ad-2]

16. Carter County, Montana
> Population increase, 2010 to 2020: +6.6%
> Population decline, 1960 to 2010: -53.5%
> Real per capita income, 1959: $11,148
> Real per capita income, 2019: $28,577
> Total population, 2020: 1,235

15. Burke County, North Dakota
> Population increase, 2010 to 2020: +7.4%
> Population decline, 1960 to 2010: -66.5%
> Real per capita income, 1959: $13,810
> Real per capita income, 2019: $39,350
> Total population, 2020: 2,118
[in-text-ad]

14. Upton County, Texas
> Population increase, 2010 to 2020: +8.5%
> Population decline, 1960 to 2010: -46.5%
> Real per capita income, 1959: $10,016
> Real per capita income, 2019: $25,447
> Total population, 2020: 3,623
[recirclink id=983373]

13. Borden County, Texas
> Population increase, 2010 to 2020: +9.3%
> Population decline, 1960 to 2010: -40.0%
> Real per capita income, 1959: $12,387
> Real per capita income, 2019: $34,028
> Total population, 2020: 706

12. Divide County, North Dakota
> Population increase, 2010 to 2020: +9.5%
> Population decline, 1960 to 2010: -62.6%
> Real per capita income, 1959: $9,441
> Real per capita income, 2019: $40,184
> Total population, 2020: 2,277
[in-text-ad-2]

11. Stewart County, Georgia
> Population increase, 2010 to 2020: +9.7%
> Population decline, 1960 to 2010: -17.3%
> Real per capita income, 1959: $9,709
> Real per capita income, 2019: $16,705
> Total population, 2020: 6,689

10. Costilla County, Colorado
> Population increase, 2010 to 2020: +11.1%
> Population decline, 1960 to 2010: -16.4%
> Real per capita income, 1959: $7,169
> Real per capita income, 2019: $21,732
> Total population, 2020: 3,921
[in-text-ad]

9. Banner County, Nebraska
> Population increase, 2010 to 2020: +13.1%
> Population decline, 1960 to 2010: -45.2%
> Real per capita income, 1959: $14,999
> Real per capita income, 2019: $27,552
> Total population, 2020: 786
[recirclink id=1008724]

8. Billings County, North Dakota
> Population increase, 2010 to 2020: +13.7%
> Population decline, 1960 to 2010: -48.2%
> Real per capita income, 1959: $8,688
> Real per capita income, 2019: $42,071
> Total population, 2020: 890
7. Thomas County, Nebraska
> Population increase, 2010 to 2020: +14.2%
> Population decline, 1960 to 2010: -40.0%
> Real per capita income, 1959: $8,956
> Real per capita income, 2019: $36,572
> Total population, 2020: 739
[in-text-ad-2]

6. Sterling County, Texas
> Population increase, 2010 to 2020: +15.7%
> Population decline, 1960 to 2010: -3.4%
> Real per capita income, 1959: $14,554
> Real per capita income, 2019: $28,757
> Total population, 2020: 1,315

5. Martin County, Texas
> Population increase, 2010 to 2020: +20.9%
> Population decline, 1960 to 2010: -5.1%
> Real per capita income, 1959: $12,733
> Real per capita income, 2019: $30,548
> Total population, 2020: 5,816
[in-text-ad]

4. Dunn County, North Dakota
> Population increase, 2010 to 2020: +26.3%
> Population decline, 1960 to 2010: -44.3%
> Real per capita income, 1959: $9,523
> Real per capita income, 2019: $42,691
> Total population, 2020: 4,465
[recirclink id=1013388]

3. Mountrail County, North Dakota
> Population increase, 2010 to 2020: +36.2%
> Population decline, 1960 to 2010: -23.5%
> Real per capita income, 1959: $9,620
> Real per capita income, 2019: $36,364
> Total population, 2020: 10,502

2. Loving County, Texas
> Population increase, 2010 to 2020: +115.5%
> Population decline, 1960 to 2010: -62.8%
> Real per capita income, 1959: $11,554
> Real per capita income, 2019: $33,624
> Total population, 2020: 181
[in-text-ad-2]
1. McKenzie County, North Dakota
> Population increase, 2010 to 2020: +137.7%
> Population decline, 1960 to 2010: -12.1%
> Real per capita income, 1959: $7,443
> Real per capita income, 2019: $36,690
> Total population, 2020: 15,242
Methodology
To determine the rural counties that stopped shrinking, 24/7 Wall St. reviewed historical population data from the U.S. Census Bureau’s Decennial Census of Population and Housing and Population and Housing Unit Estimates programs. Counties that reported overall population decline from 1960 to 2010 were ranked based on percentage increase in population from 2010 to 2020. Only counties with at least 50% of the population residing in rural areas were considered.
Data on the percentage of the population in rural areas came from the Census Bureau and are for 2010. Supplemental data on per capita income in 1959 came from the Census Bureau and were adjusted from 1989 dollars to 2019 dollars using the Bureau of Labor Statistics’ Consumer Price Index for all urban consumers. Data on per capita income in 2019 came from the Census Bureau’s 2019 American Community Survey and are five-year estimates.
Contact [email protected] for any questions or corrections.