The U.S. property crime rate fell for the 19th consecutive year in 2020 – a bright spot in an otherwise bleak year defined largely by the COVID-19 pandemic and a historic surge in deadly violence.
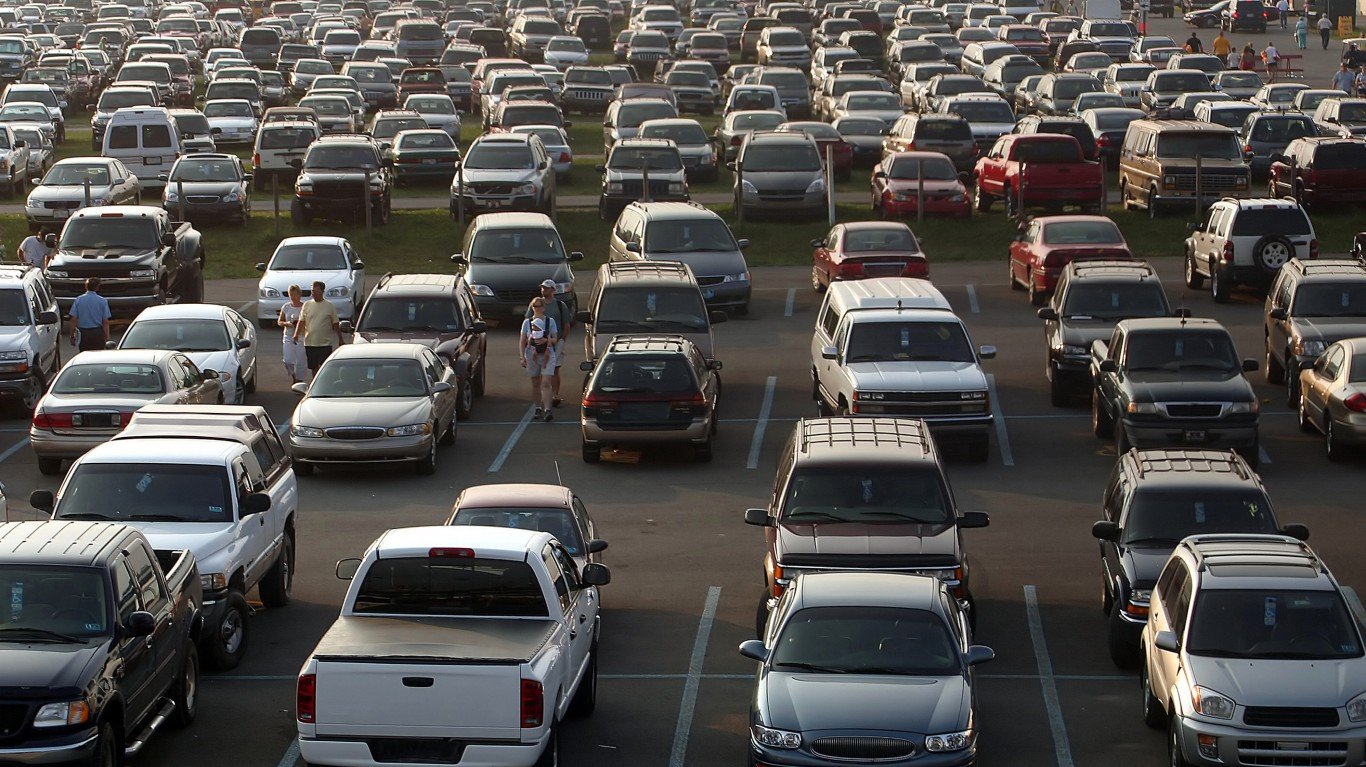
Property crime is made up of three categories of offenses: larceny, defined as the unlawful taking of property; burglary, or the illegal entry of a structure to commit a crime; and vehicle theft, which can be either the theft, or the attempted theft, of a vehicle, such a car or ATV. Here is a look at the city in every state where your car is most likely to be stolen.
There were a total 6.5 million property crimes reported in the U.S. in 2020, or 1,958 for every 100,000 people, a decrease of 172 incidents per 100,000 people from the previous year. Not all parts of the country benefited from the decline, however. Many cities across the country bucked the national trend and reported a year-over-year surge in property crime.
Using data from the FBI’s 2020 Uniform Crime Report, 24/7 Wall St. identified the 50 cities where property crime is soaring. Cities are ranked by the year-over-year change in property crimes reported for every 100,000 residents.
Despite the decline in much of the country, property crimes remain the most common of the most serious crimes tracked by the FBI, known as Part I offenses. Each year, property crimes result in the loss of tens of billions of dollars worth of property – much of which is never recovered.
In every city on this list, the property crime rate increased by more than 400 incidents per 100,000 people in 2020. Most of the cities that reported the largest increase in the property crime rate are in the Western United States, including 12 in Washington state alone. All but six of the cities on this list have a higher overall property crime rate than the U.S. as a whole.
Click here for the US cities where property crime is soaring

50. Eugene, Oregon
> 1-yr. change in property crime rate: 428.9 more crimes per 100k people
> Property crimes reported in 2020: 6,980 — 66th highest of 1,037 cities
> Property crimes reported in 2019: 6,184 — 84th highest of 1,037 cities
> Property crimes per 100K people in 2020: 3,999.7 — 91st highest of 1,037 cities
> Property crimes per 100K people in 2019: 3,570.8 — 172nd highest of 1,037 cities
> Population: 168,302
[in-text-ad]
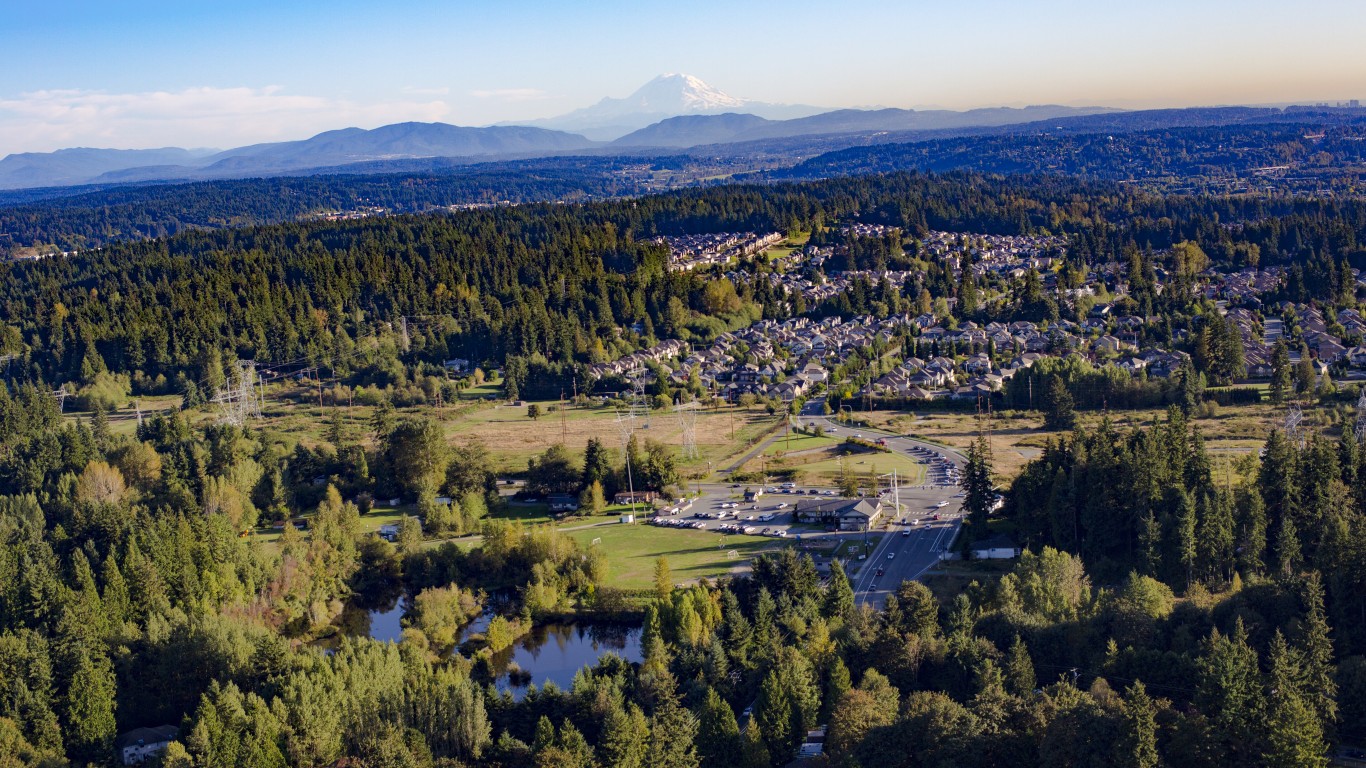
49. Bothell, Washington
> 1-yr. change in property crime rate: 429.7 more crimes per 100k people
> Property crimes reported in 2020: 1,187 — 509th highest of 1,037 cities
> Property crimes reported in 2019: 964 — 393rd lowest of 1,037 cities
> Property crimes per 100K people in 2020: 2,456.4 — 370th highest of 1,037 cities
> Property crimes per 100K people in 2019: 2,026.7 — 462nd lowest of 1,037 cities
> Population: 45,749
[recirclink id=1015043]

48. Lake Oswego, Oregon
> 1-yr. change in property crime rate: 434.6 more crimes per 100k people
> Property crimes reported in 2020: 659 — 271st lowest of 1,037 cities
> Property crimes reported in 2019: 481 — 154th lowest of 1,037 cities
> Property crimes per 100K people in 2020: 1,640.5 — 364th lowest of 1,037 cities
> Property crimes per 100K people in 2019: 1,205.9 — 165th lowest of 1,037 cities
> Population: 39,127
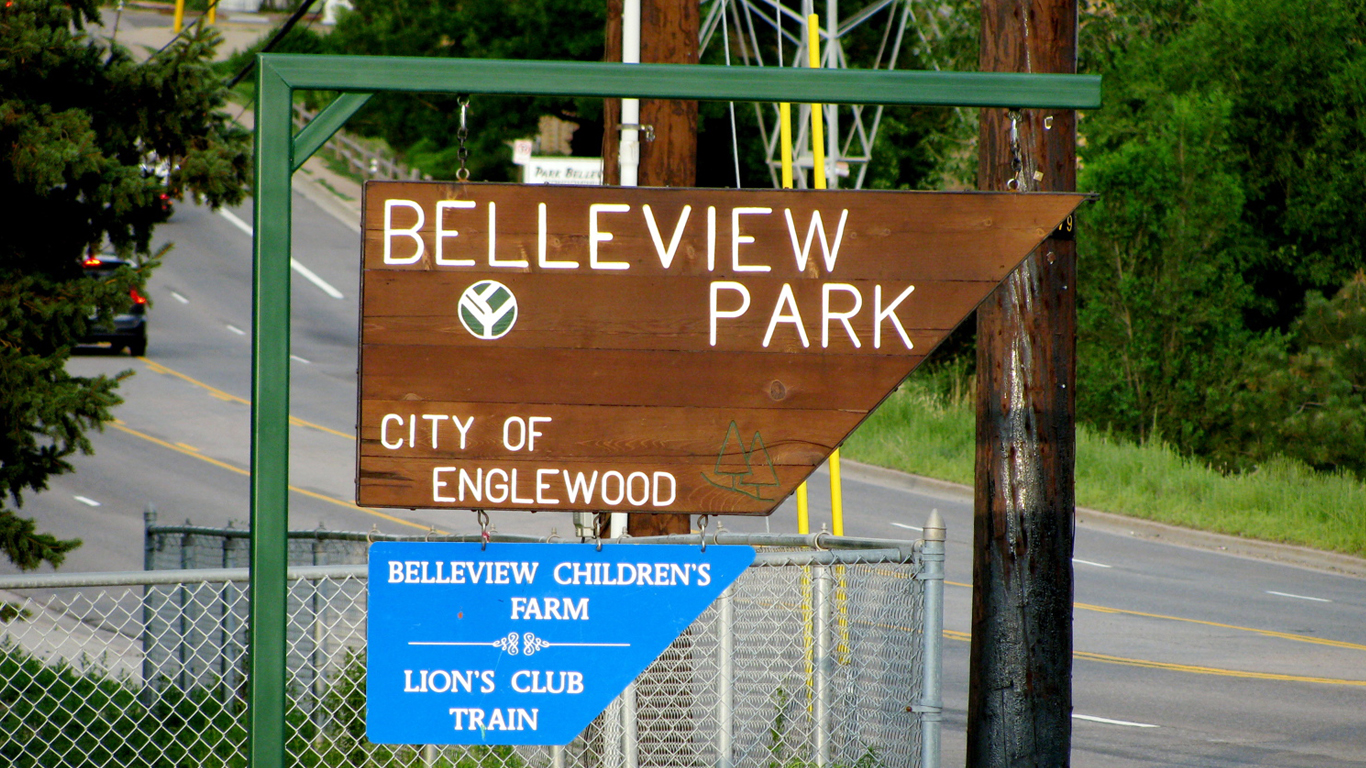
47. Englewood, Colorado
> 1-yr. change in property crime rate: 442.8 more crimes per 100k people
> Property crimes reported in 2020: 2,010 — 302nd highest of 1,037 cities
> Property crimes reported in 2019: 1,843 — 365th highest of 1,037 cities (tied)
> Property crimes per 100K people in 2020: 5,667.7 — 17th highest of 1,037 cities
> Property crimes per 100K people in 2019: 5,225.0 — 37th highest of 1,037 cities
> Population: 34,259
[in-text-ad-2]

46. Des Moines, Washington
> 1-yr. change in property crime rate: 449.4 more crimes per 100k people
> Property crimes reported in 2020: 1,152 — 506th lowest of 1,037 cities (tied)
> Property crimes reported in 2019: 1,007 — 412th lowest of 1,037 cities
> Property crimes per 100K people in 2020: 3,528.1 — 139th highest of 1,037 cities
> Property crimes per 100K people in 2019: 3,078.8 — 272nd highest of 1,037 cities
> Population: 31,734
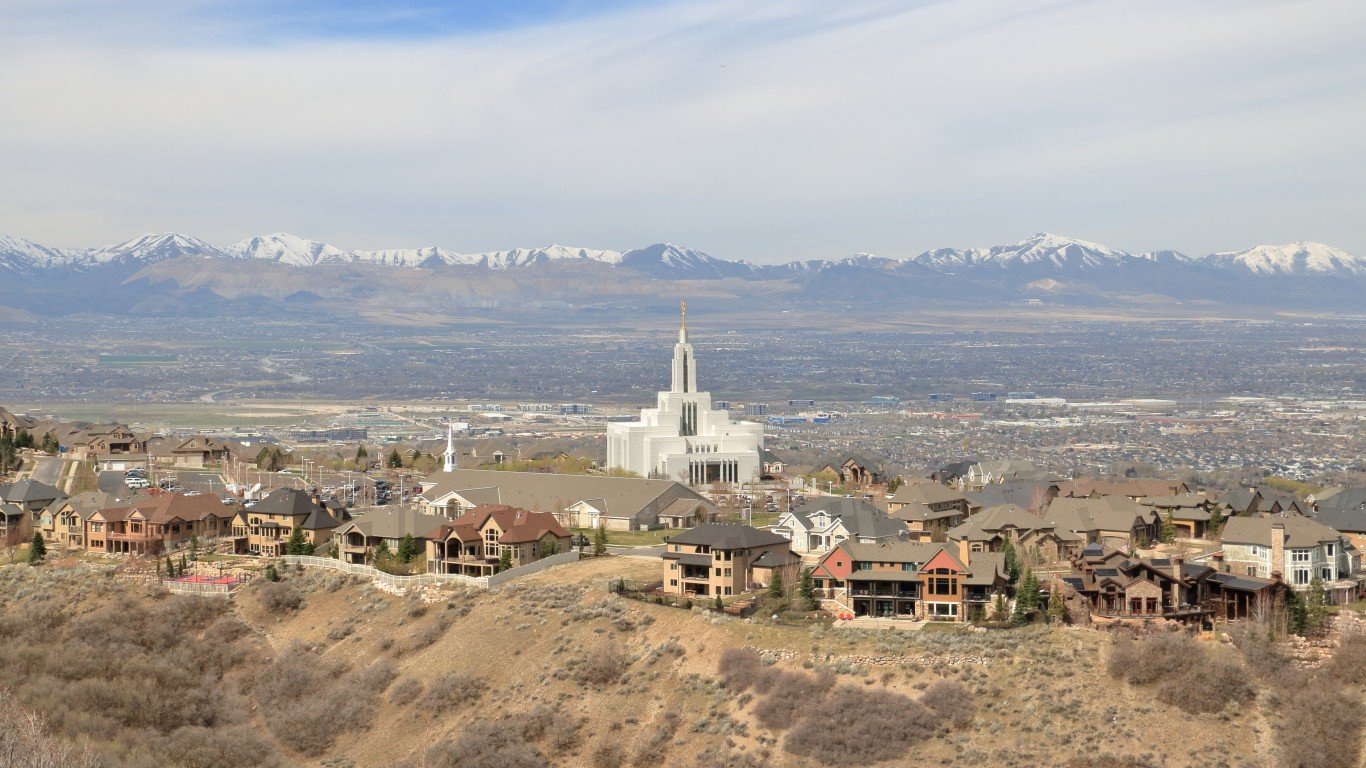
45. Draper, Utah
> 1-yr. change in property crime rate: 462.3 more crimes per 100k people
> Property crimes reported in 2020: 1,138 — 495th lowest of 1,037 cities (tied)
> Property crimes reported in 2019: 906 — 365th lowest of 1,037 cities (tied)
> Property crimes per 100K people in 2020: 2,307.1 — 421st highest of 1,037 cities
> Property crimes per 100K people in 2019: 1,844.8 — 399th lowest of 1,037 cities
> Population: 48,000
[in-text-ad]

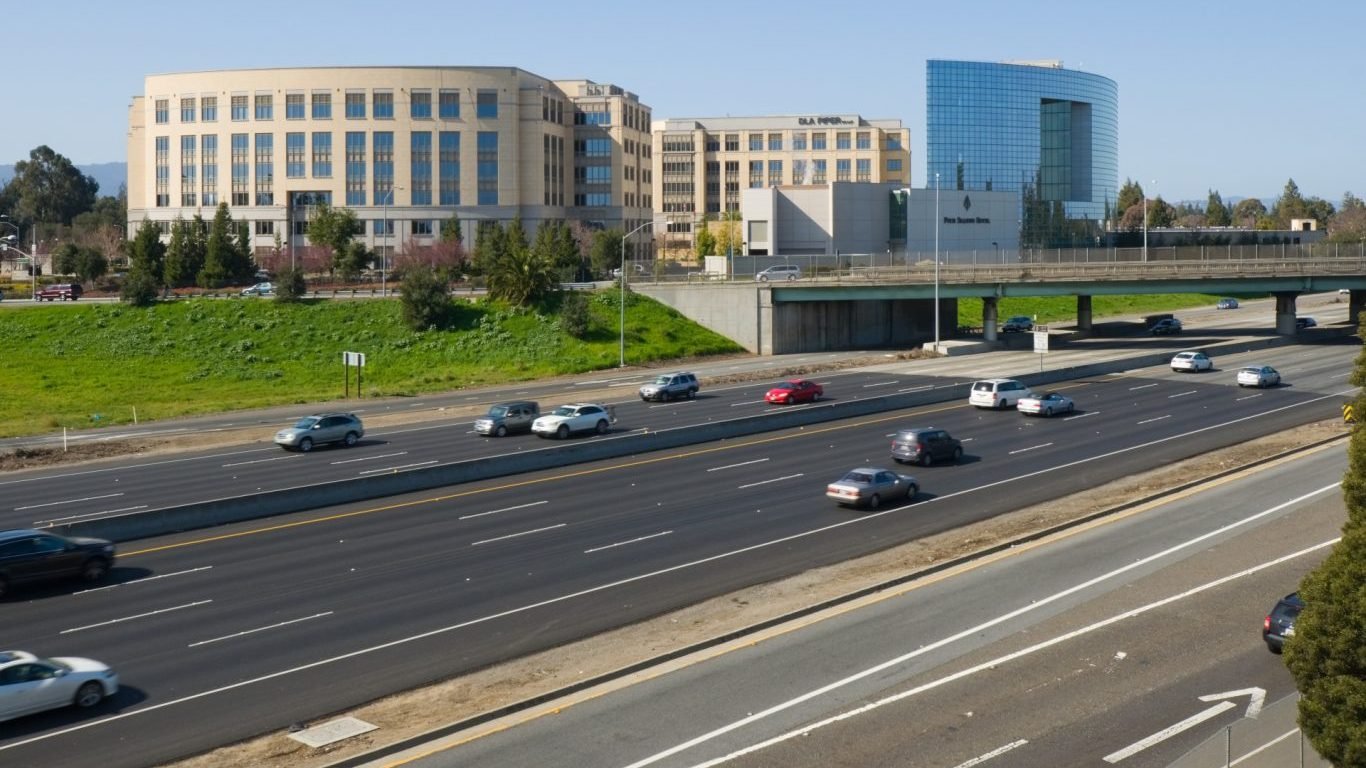
44. Fremont, California
> 1-yr. change in property crime rate: 465.0 more crimes per 100k people
> Property crimes reported in 2020: 5,722 — 84th highest of 1,037 cities
> Property crimes reported in 2019: 4,523 — 114th highest of 1,037 cities
> Property crimes per 100K people in 2020: 2,342.6 — 403rd highest of 1,037 cities
> Property crimes per 100K people in 2019: 1,877.6 — 410th lowest of 1,037 cities
> Population: 235,740
[recirclink id=1030620]

43. Aurora, Colorado
> 1-yr. change in property crime rate: 472.8 more crimes per 100k people
> Property crimes reported in 2020: 13,079 — 37th highest of 1,037 cities
> Property crimes reported in 2019: 11,106 — 49th highest of 1,037 cities
> Property crimes per 100K people in 2020: 3,390.8 — 161st highest of 1,037 cities
> Property crimes per 100K people in 2019: 2,918.0 — 309th highest of 1,037 cities
> Population: 369,111

42. Yukon, Oklahoma
> 1-yr. change in property crime rate: 474.8 more crimes per 100k people
> Property crimes reported in 2020: 583 — 221st lowest of 1,037 cities (tied)
> Property crimes reported in 2019: 438 — 128th lowest of 1,037 cities
> Property crimes per 100K people in 2020: 2,028.9 — 515th lowest of 1,037 cities
> Property crimes per 100K people in 2019: 1,554.1 — 294th lowest of 1,037 cities
> Population: 26,943
[in-text-ad-2]
41. East Palo Alto, California
> 1-yr. change in property crime rate: 477.0 more crimes per 100k people
> Property crimes reported in 2020: 669 — 279th lowest of 1,037 cities
> Property crimes reported in 2019: 533 — 181st lowest of 1,037 cities (tied)
> Property crimes per 100K people in 2020: 2,272.5 — 431st highest of 1,037 cities
> Property crimes per 100K people in 2019: 1,795.5 — 388th lowest of 1,037 cities
> Population: 29,593
![]()
40. Clearfield, Utah
> 1-yr. change in property crime rate: 477.1 more crimes per 100k people
> Property crimes reported in 2020: 525 — 187th lowest of 1,037 cities (tied)
> Property crimes reported in 2019: 369 — 88th lowest of 1,037 cities
> Property crimes per 100K people in 2020: 1,622.5 — 355th lowest of 1,037 cities
> Property crimes per 100K people in 2019: 1,145.4 — 146th lowest of 1,037 cities
> Population: 31,364
[in-text-ad]

39. Pacifica, California
> 1-yr. change in property crime rate: 479.8 more crimes per 100k people
> Property crimes reported in 2020: 715 — 302nd lowest of 1,037 cities (tied)
> Property crimes reported in 2019: 533 — 181st lowest of 1,037 cities (tied)
> Property crimes per 100K people in 2020: 1,848.6 — 456th lowest of 1,037 cities
> Property crimes per 100K people in 2019: 1,368.8 — 228th lowest of 1,037 cities
> Population: 38,984
[recirclink id=1033410]
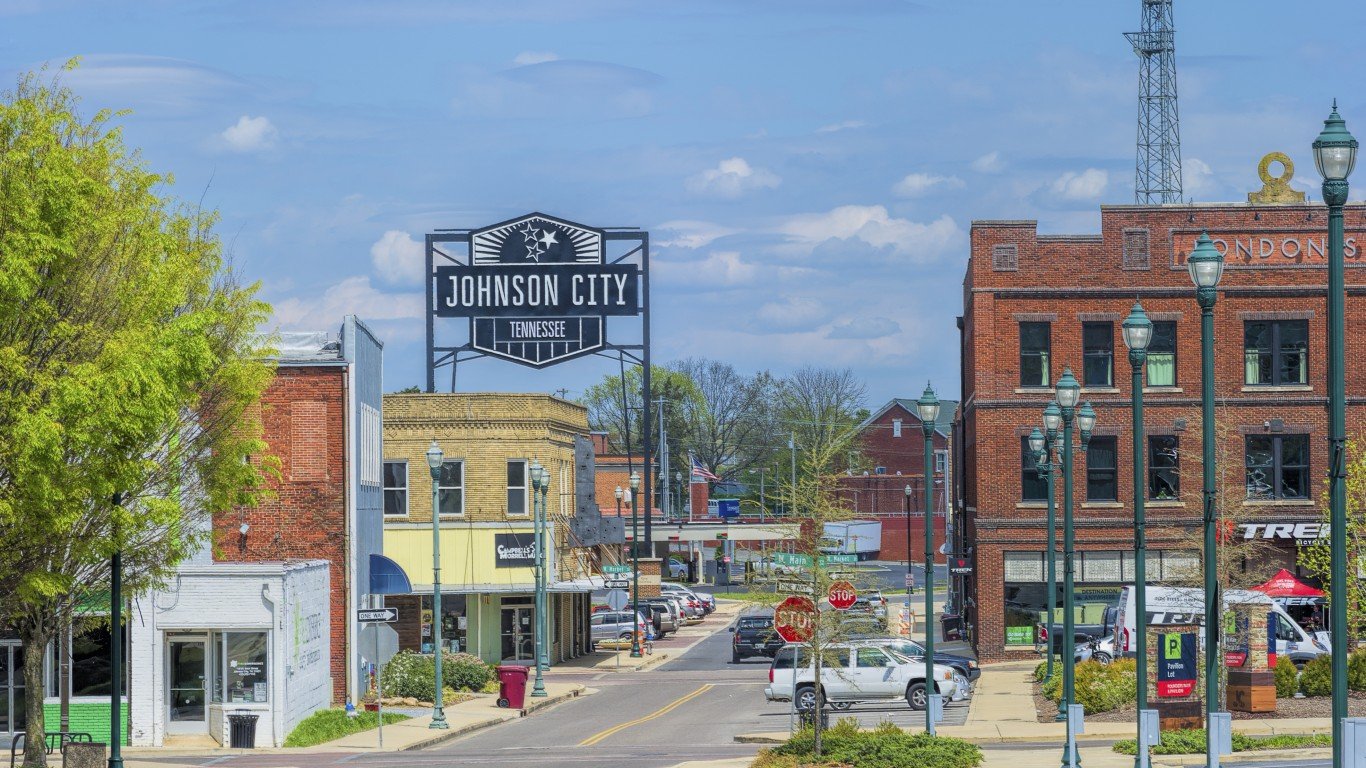
38. Johnson City, Tennessee
> 1-yr. change in property crime rate: 480.9 more crimes per 100k people
> Property crimes reported in 2020: 2,717 — 217th highest of 1,037 cities
> Property crimes reported in 2019: 2,390 — 266th highest of 1,037 cities (tied)
> Property crimes per 100K people in 2020: 4,037.6 — 87th highest of 1,037 cities
> Property crimes per 100K people in 2019: 3,556.7 — 173rd highest of 1,037 cities
> Population: 66,515

37. Leawood, Kansas
> 1-yr. change in property crime rate: 484.9 more crimes per 100k people
> Property crimes reported in 2020: 571 — 215th lowest of 1,037 cities (tied)
> Property crimes reported in 2019: 401 — 110th lowest of 1,037 cities (tied)
> Property crimes per 100K people in 2020: 1,628.9 — 359th lowest of 1,037 cities
> Property crimes per 100K people in 2019: 1,144.0 — 145th lowest of 1,037 cities
> Population: 34,670
[in-text-ad-2]

36. Lakewood, Washington
> 1-yr. change in property crime rate: 495.8 more crimes per 100k people
> Property crimes reported in 2020: 2,620 — 225th highest of 1,037 cities
> Property crimes reported in 2019: 2,296 — 279th highest of 1,037 cities
> Property crimes per 100K people in 2020: 4,264.9 — 66th highest of 1,037 cities
> Property crimes per 100K people in 2019: 3,769.1 — 142nd highest of 1,037 cities
> Population: 60,111
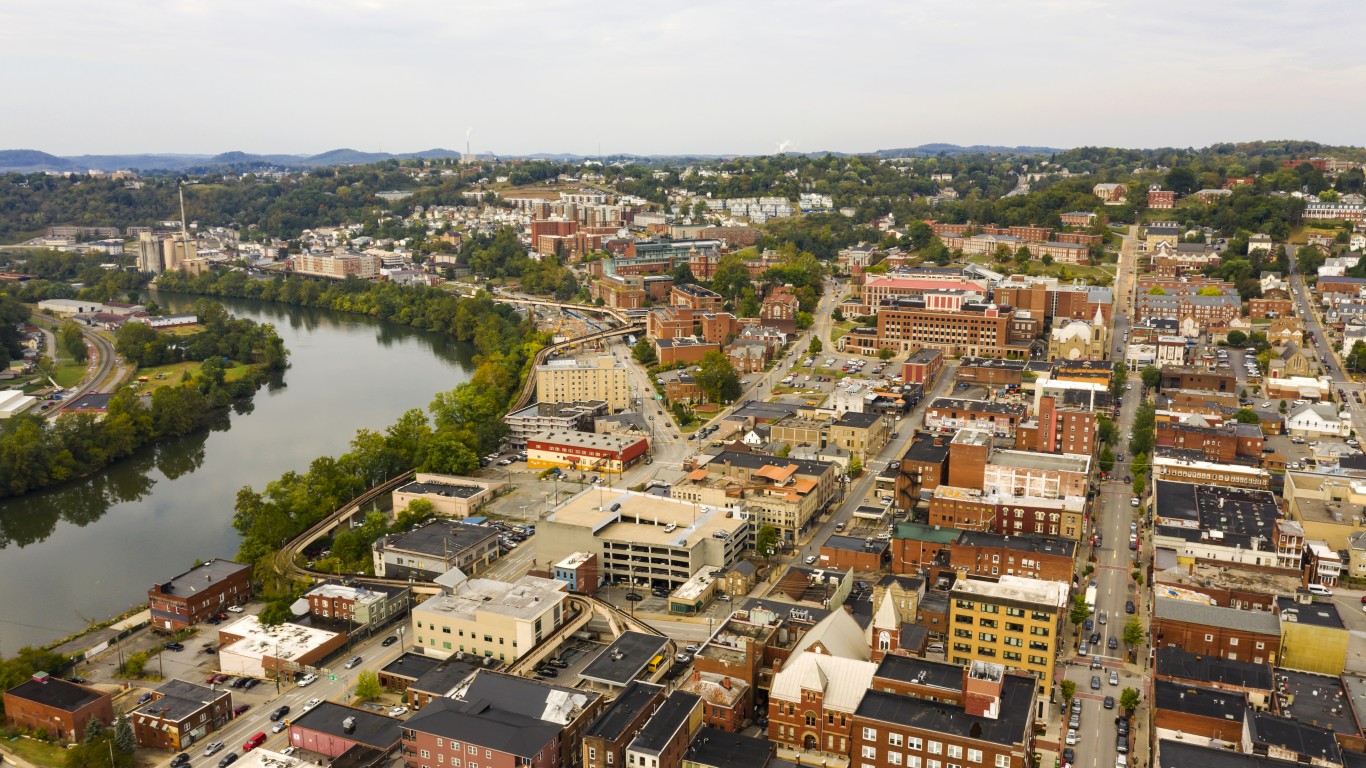
35. Morgantown, West Virginia
> 1-yr. change in property crime rate: 503.4 more crimes per 100k people
> Property crimes reported in 2020: 636 — 252nd lowest of 1,037 cities (tied)
> Property crimes reported in 2019: 489 — 157th lowest of 1,037 cities
> Property crimes per 100K people in 2020: 2,066.6 — 511th highest of 1,037 cities
> Property crimes per 100K people in 2019: 1,563.2 — 299th lowest of 1,037 cities
> Population: 30,712
[in-text-ad]

34. Bismarck, North Dakota
> 1-yr. change in property crime rate: 511.9 more crimes per 100k people
> Property crimes reported in 2020: 2,471 — 240th highest of 1,037 cities
> Property crimes reported in 2019: 2,079 — 311th highest of 1,037 cities
> Property crimes per 100K people in 2020: 3,294.8 — 177th highest of 1,037 cities
> Property crimes per 100K people in 2019: 2,782.9 — 347th highest of 1,037 cities
> Population: 72,777
[recirclink id=1039645]

33. Racine, Wisconsin
> 1-yr. change in property crime rate: 522.3 more crimes per 100k people
> Property crimes reported in 2020: 1,381 — 438th highest of 1,037 cities
> Property crimes reported in 2019: 990 — 407th lowest of 1,037 cities
> Property crimes per 100K people in 2020: 1,803.5 — 438th lowest of 1,037 cities
> Property crimes per 100K people in 2019: 1,281.2 — 185th lowest of 1,037 cities
> Population: 77,081

32. Yakima, Washington
> 1-yr. change in property crime rate: 538.9 more crimes per 100k people
> Property crimes reported in 2020: 3,220 — 172nd highest of 1,037 cities
> Property crimes reported in 2019: 2,723 — 230th highest of 1,037 cities
> Property crimes per 100K people in 2020: 3,430.6 — 153rd highest of 1,037 cities
> Property crimes per 100K people in 2019: 2,891.6 — 315th highest of 1,037 cities
> Population: 93,413
[in-text-ad-2]
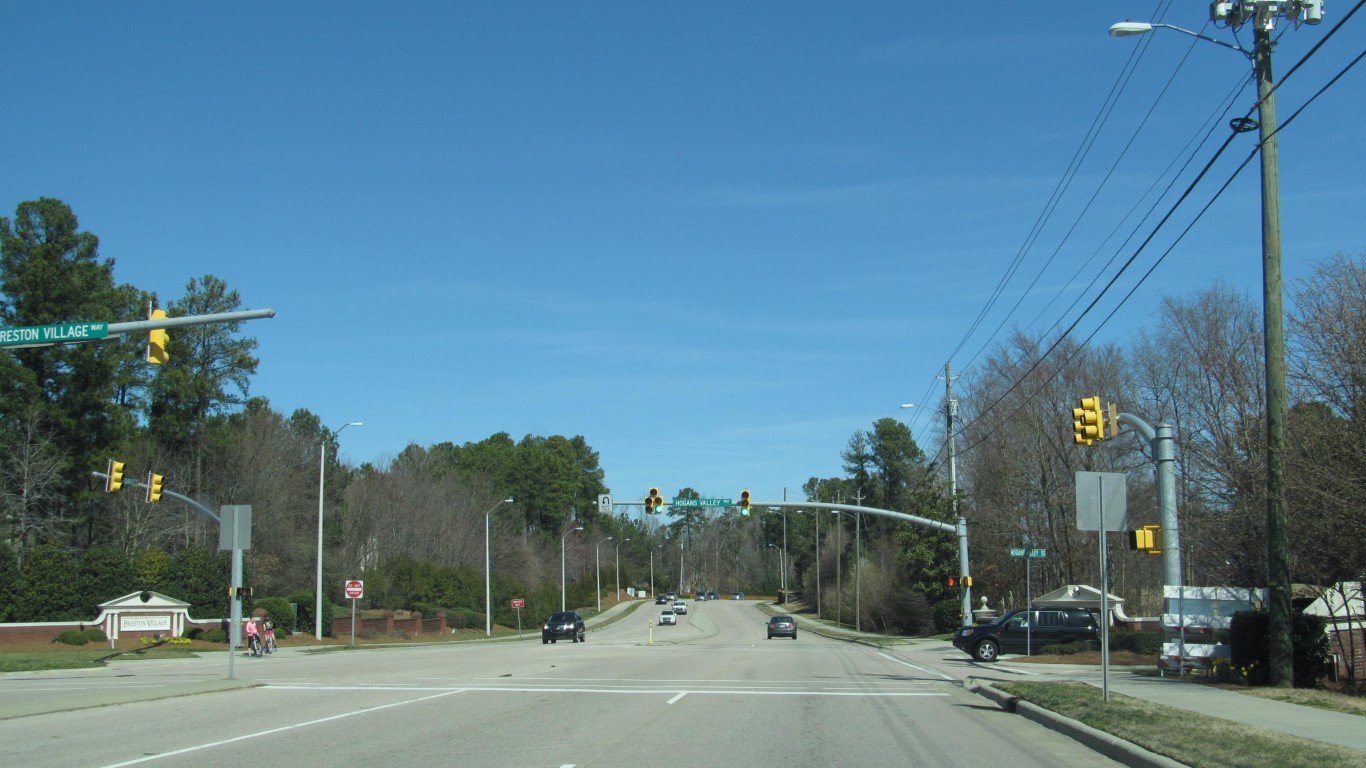
31. Kannapolis, North Carolina
> 1-yr. change in property crime rate: 541.5 more crimes per 100k people
> Property crimes reported in 2020: 1,460 — 414th highest of 1,037 cities (tied)
> Property crimes reported in 2019: 1,154 — 486th lowest of 1,037 cities (tied)
> Property crimes per 100K people in 2020: 2,816.5 — 277th highest of 1,037 cities
> Property crimes per 100K people in 2019: 2,275.0 — 487th highest of 1,037 cities
> Population: 48,630

30. Richland, Washington
> 1-yr. change in property crime rate: 566.7 more crimes per 100k people
> Property crimes reported in 2020: 1,553 — 392nd highest of 1,037 cities
> Property crimes reported in 2019: 1,199 — 503rd lowest of 1,037 cities
> Property crimes per 100K people in 2020: 2,615.8 — 327th highest of 1,037 cities
> Property crimes per 100K people in 2019: 2,049.1 — 472nd lowest of 1,037 cities
> Population: 56,399
[in-text-ad]
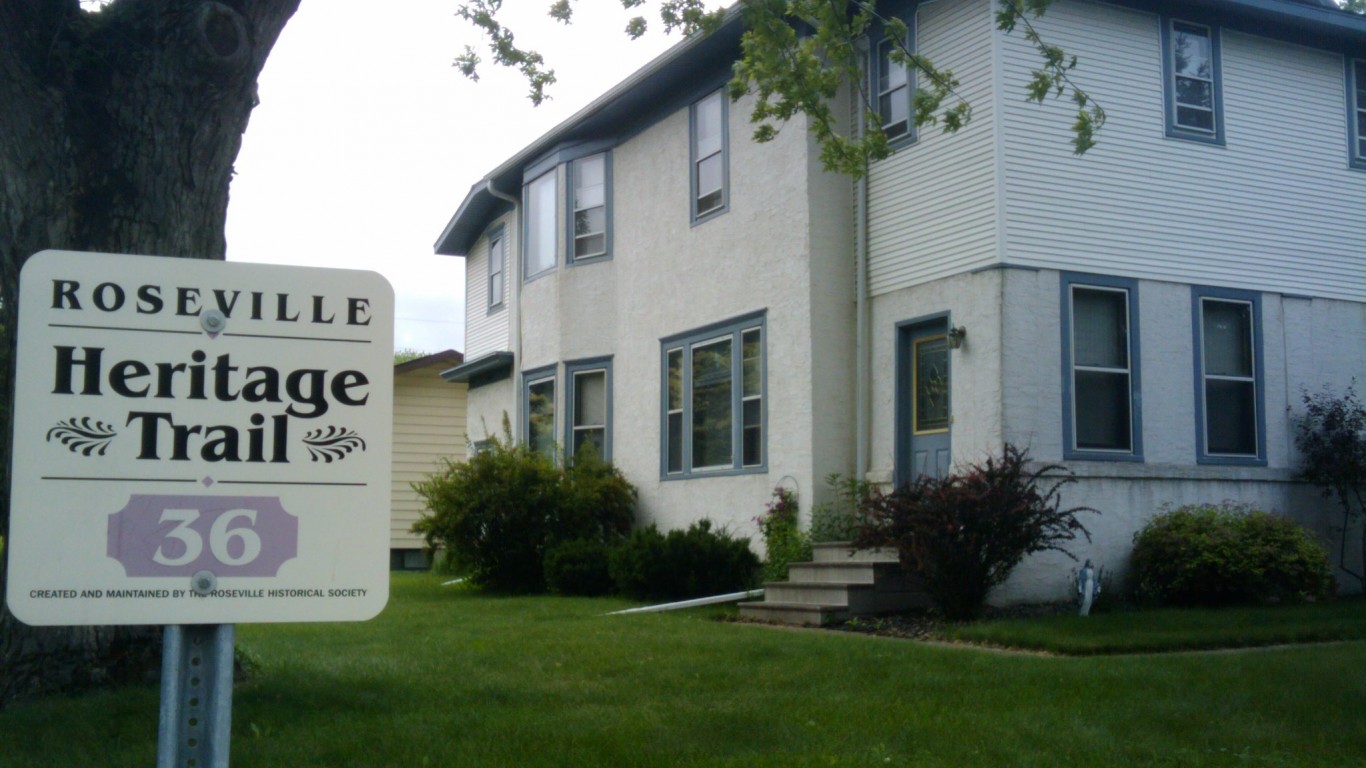
29. Roseville, Minnesota
> 1-yr. change in property crime rate: 573.7 more crimes per 100k people
> Property crimes reported in 2020: 2,370 — 254th highest of 1,037 cities
> Property crimes reported in 2019: 2,164 — 295th highest of 1,037 cities (tied)
> Property crimes per 100K people in 2020: 6,462.2 — 6th highest of 1,037 cities
> Property crimes per 100K people in 2019: 5,888.4 — 17th highest of 1,037 cities
> Population: 36,026
[recirclink id=1055273]
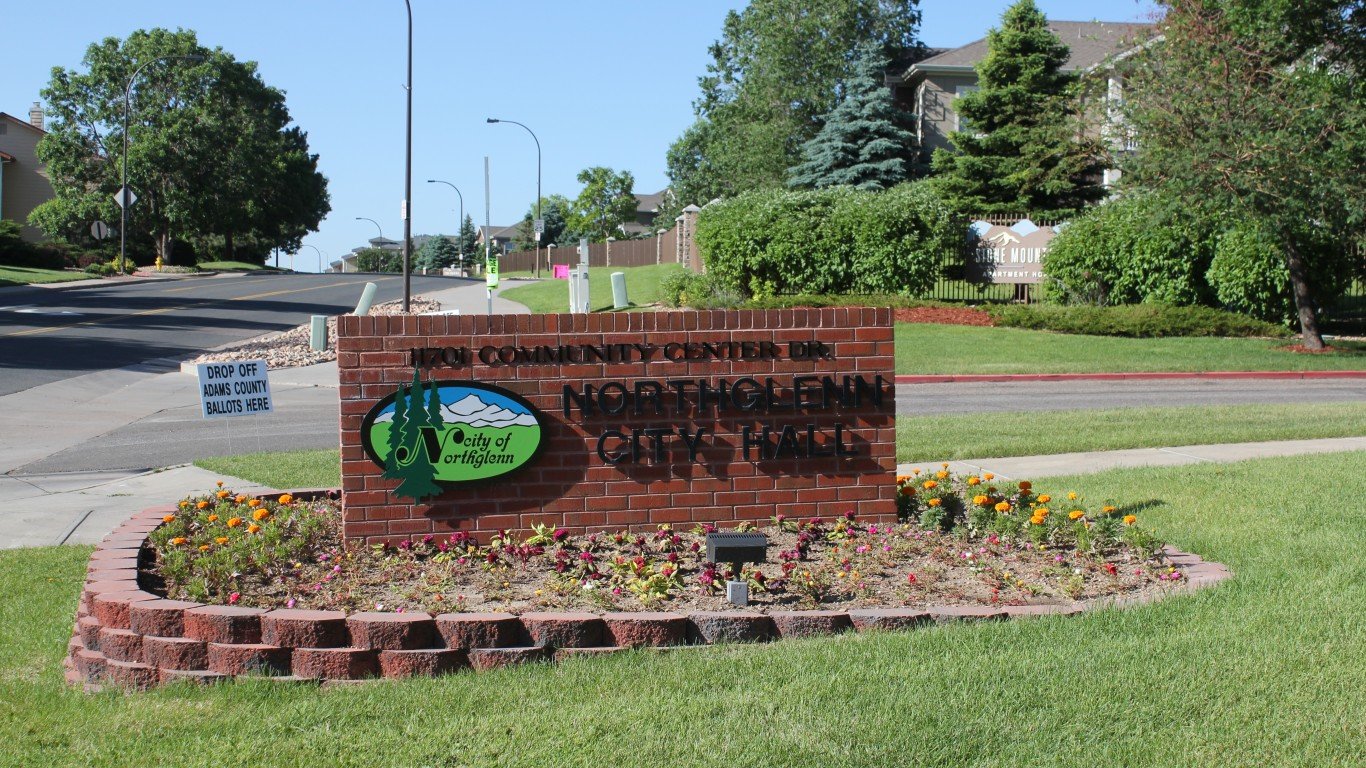
28. Northglenn, Colorado
> 1-yr. change in property crime rate: 577.3 more crimes per 100k people
> Property crimes reported in 2020: 1,447 — 420th highest of 1,037 cities (tied)
> Property crimes reported in 2019: 1,229 — 510th lowest of 1,037 cities
> Property crimes per 100K people in 2020: 3,695.0 — 114th highest of 1,037 cities
> Property crimes per 100K people in 2019: 3,117.7 — 264th highest of 1,037 cities
> Population: 38,973
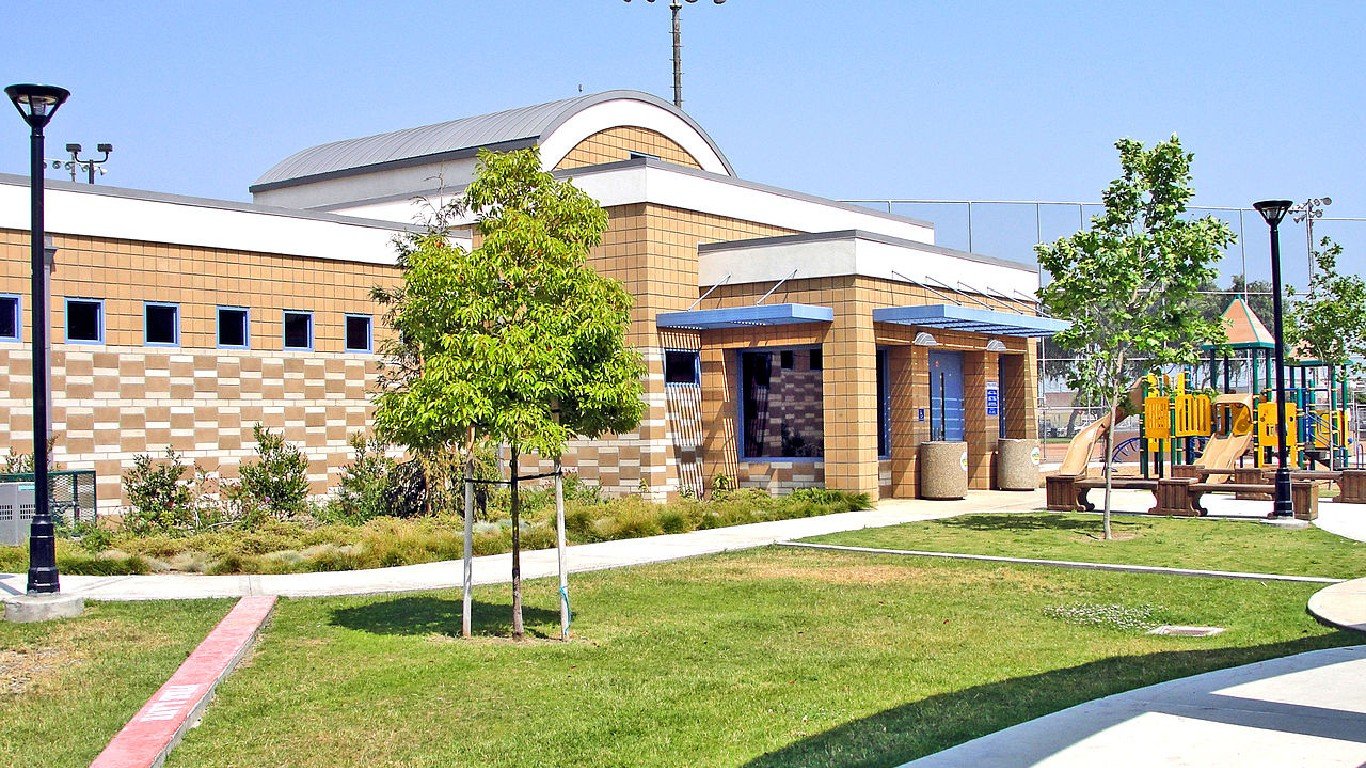
27. Maywood, California
> 1-yr. change in property crime rate: 619.7 more crimes per 100k people
> Property crimes reported in 2020: 459 — 160th lowest of 1,037 cities
> Property crimes reported in 2019: 296 — 54th lowest of 1,037 cities (tied)
> Property crimes per 100K people in 2020: 1,704.5 — 392nd lowest of 1,037 cities
> Property crimes per 100K people in 2019: 1,084.8 — 126th lowest of 1,037 cities
> Population: 27,332
[in-text-ad-2]

26. Sandy, Utah
> 1-yr. change in property crime rate: 646.9 more crimes per 100k people
> Property crimes reported in 2020: 2,979 — 192nd highest of 1,037 cities (tied)
> Property crimes reported in 2019: 2,368 — 271st highest of 1,037 cities
> Property crimes per 100K people in 2020: 3,068.3 — 222nd highest of 1,037 cities
> Property crimes per 100K people in 2019: 2,421.3 — 440th highest of 1,037 cities
> Population: 96,127

25. Billings, Montana
> 1-yr. change in property crime rate: 682.4 more crimes per 100k people
> Property crimes reported in 2020: 5,249 — 92nd highest of 1,037 cities
> Property crimes reported in 2019: 4,499 — 115th highest of 1,037 cities
> Property crimes per 100K people in 2020: 4,765.0 — 41st highest of 1,037 cities
> Property crimes per 100K people in 2019: 4,082.7 — 106th highest of 1,037 cities
> Population: 109,595
[in-text-ad]
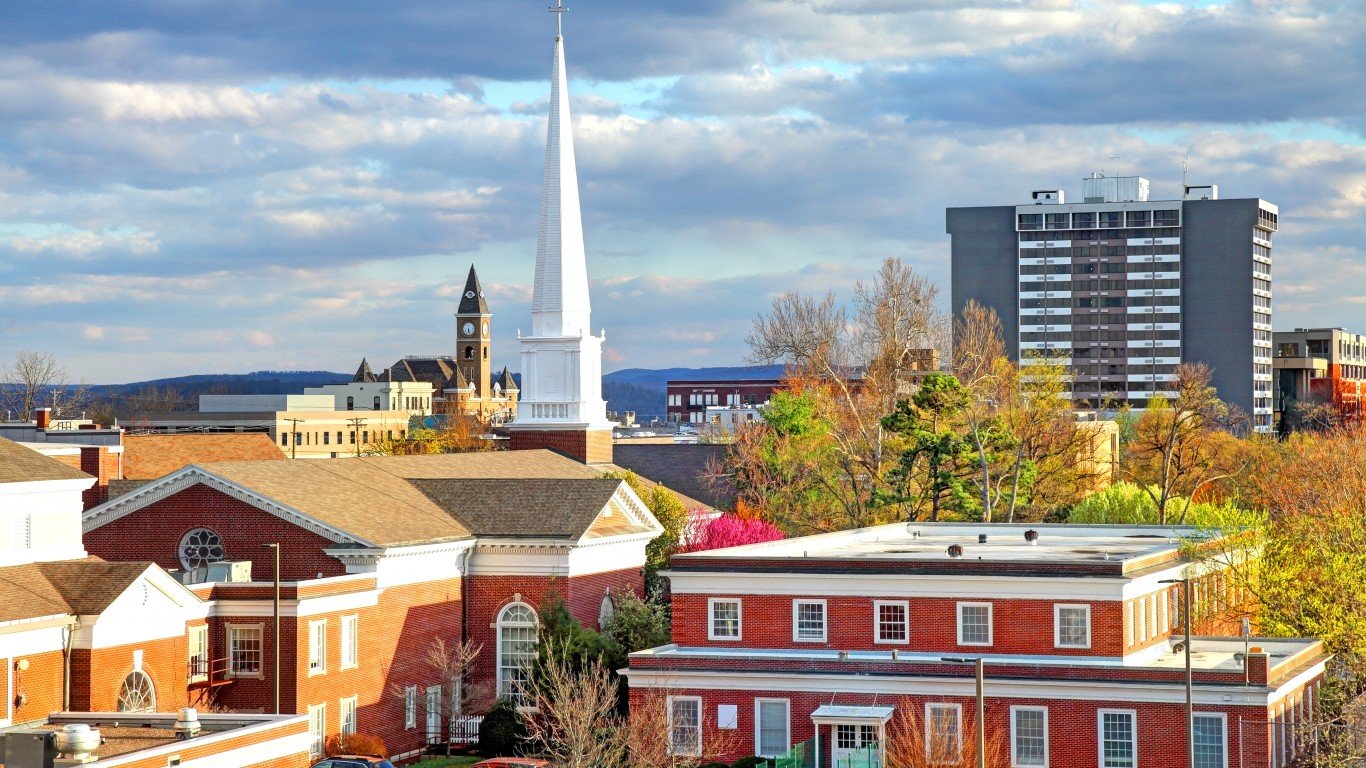
24. Fayetteville, Arkansas
> 1-yr. change in property crime rate: 684.9 more crimes per 100k people
> Property crimes reported in 2020: 4,611 — 103rd highest of 1,037 cities
> Property crimes reported in 2019: 3,966 — 146th highest of 1,037 cities
> Property crimes per 100K people in 2020: 5,166.3 — 22nd highest of 1,037 cities
> Property crimes per 100K people in 2019: 4,481.4 — 71st highest of 1,037 cities
> Population: 85,166
[recirclink id=1015043]

23. Edmonds, Washington
> 1-yr. change in property crime rate: 690.8 more crimes per 100k people
> Property crimes reported in 2020: 1,201 — 502nd highest of 1,037 cities
> Property crimes reported in 2019: 909 — 368th lowest of 1,037 cities
> Property crimes per 100K people in 2020: 2,797.3 — 282nd highest of 1,037 cities
> Property crimes per 100K people in 2019: 2,106.5 — 492nd lowest of 1,037 cities
> Population: 42,040

22. Shoreline, Washington
> 1-yr. change in property crime rate: 706.5 more crimes per 100k people
> Property crimes reported in 2020: 1,515 — 399th highest of 1,037 cities
> Property crimes reported in 2019: 1,104 — 452nd lowest of 1,037 cities
> Property crimes per 100K people in 2020: 2,636.1 — 319th highest of 1,037 cities
> Property crimes per 100K people in 2019: 1,929.5 — 425th lowest of 1,037 cities
> Population: 56,267
[in-text-ad-2]
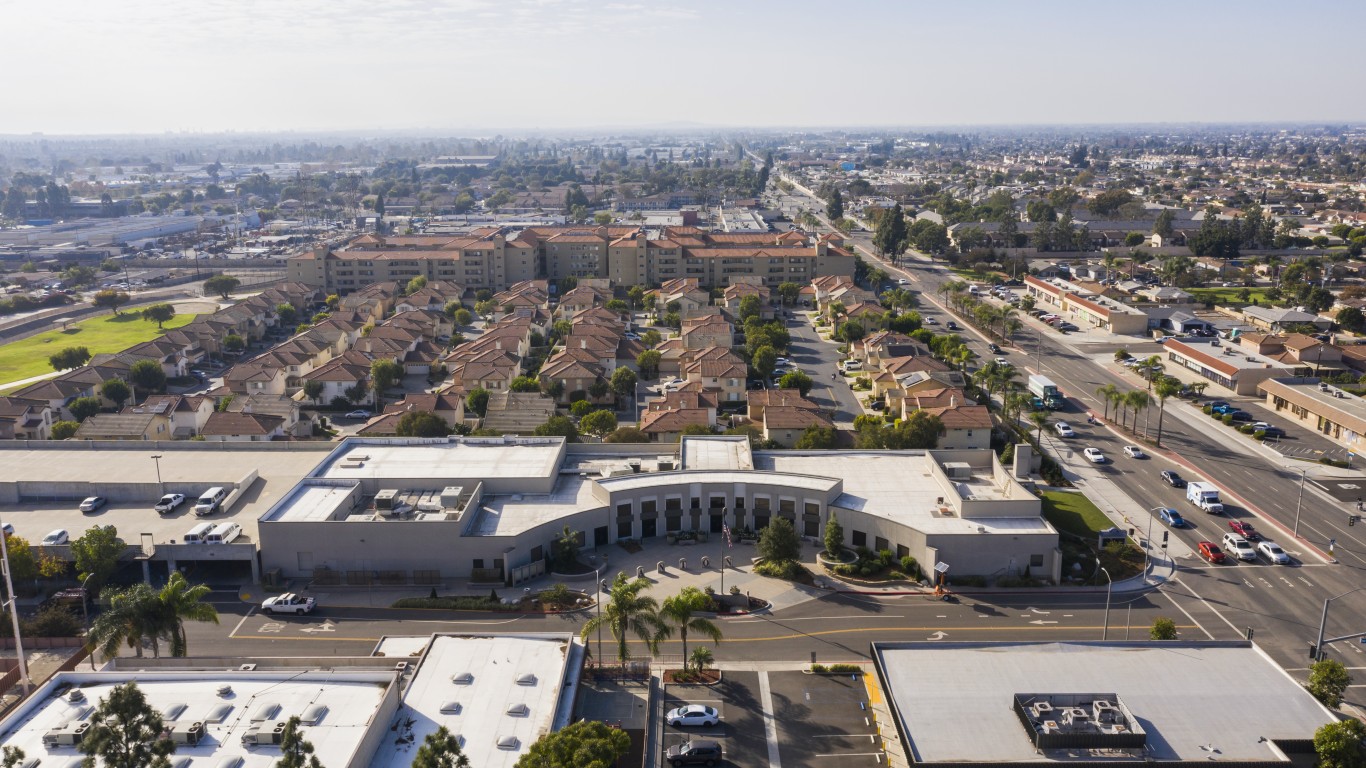
21. Stanton, California
> 1-yr. change in property crime rate: 732.4 more crimes per 100k people
> Property crimes reported in 2020: 804 — 346th lowest of 1,037 cities
> Property crimes reported in 2019: 526 — 175th lowest of 1,037 cities (tied)
> Property crimes per 100K people in 2020: 2,106.6 — 498th highest of 1,037 cities
> Property crimes per 100K people in 2019: 1,374.2 — 232nd lowest of 1,037 cities
> Population: 38,377
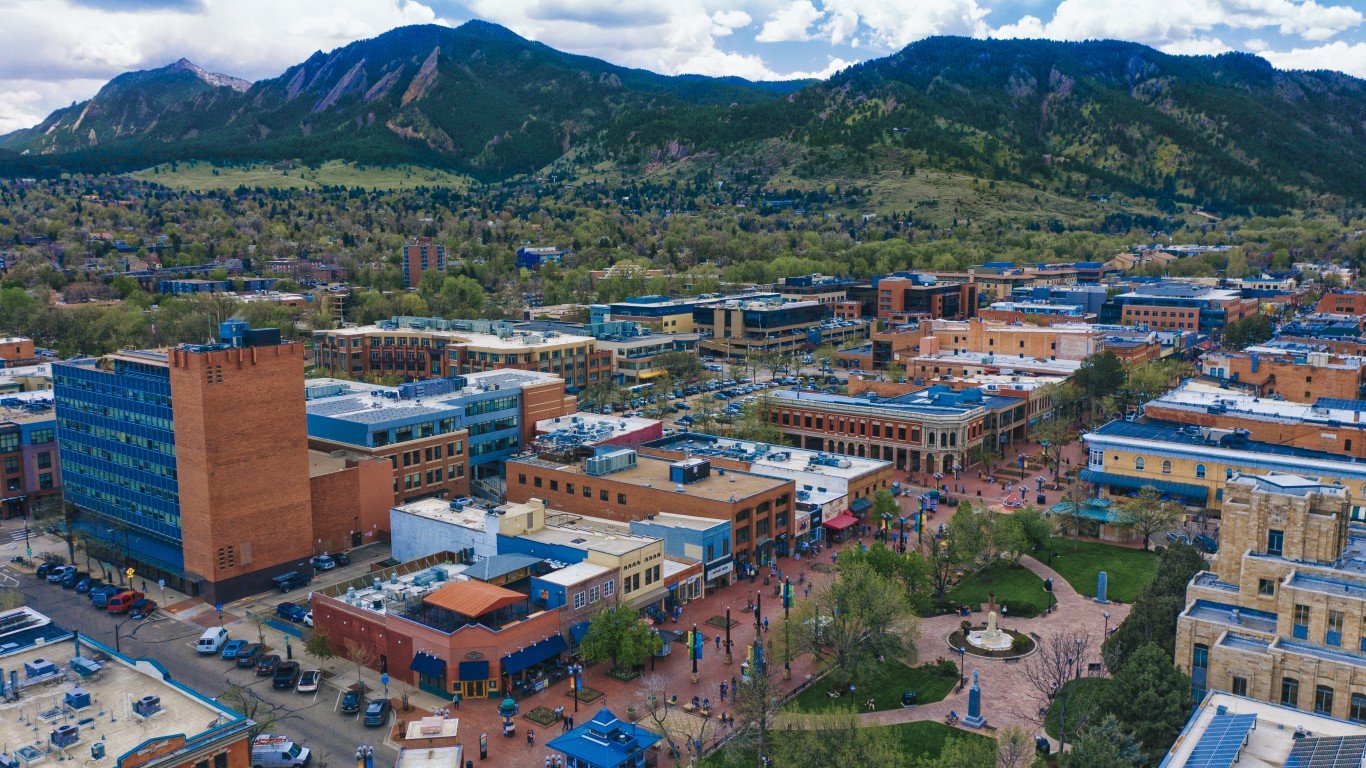
20. Boulder, Colorado
> 1-yr. change in property crime rate: 744.0 more crimes per 100k people
> Property crimes reported in 2020: 4,019 — 123rd highest of 1,037 cities
> Property crimes reported in 2019: 3,284 — 184th highest of 1,037 cities
> Property crimes per 100K people in 2020: 3,770.2 — 106th highest of 1,037 cities
> Property crimes per 100K people in 2019: 3,026.2 — 280th highest of 1,037 cities
> Population: 106,392
[in-text-ad]

19. Grand Junction, Colorado
> 1-yr. change in property crime rate: 772.1 more crimes per 100k people
> Property crimes reported in 2020: 2,966 — 195th highest of 1,037 cities
> Property crimes reported in 2019: 2,463 — 256th highest of 1,037 cities
> Property crimes per 100K people in 2020: 4,623.6 — 48th highest of 1,037 cities
> Property crimes per 100K people in 2019: 3,851.5 — 130th highest of 1,037 cities
> Population: 62,062
[recirclink id=1030620]
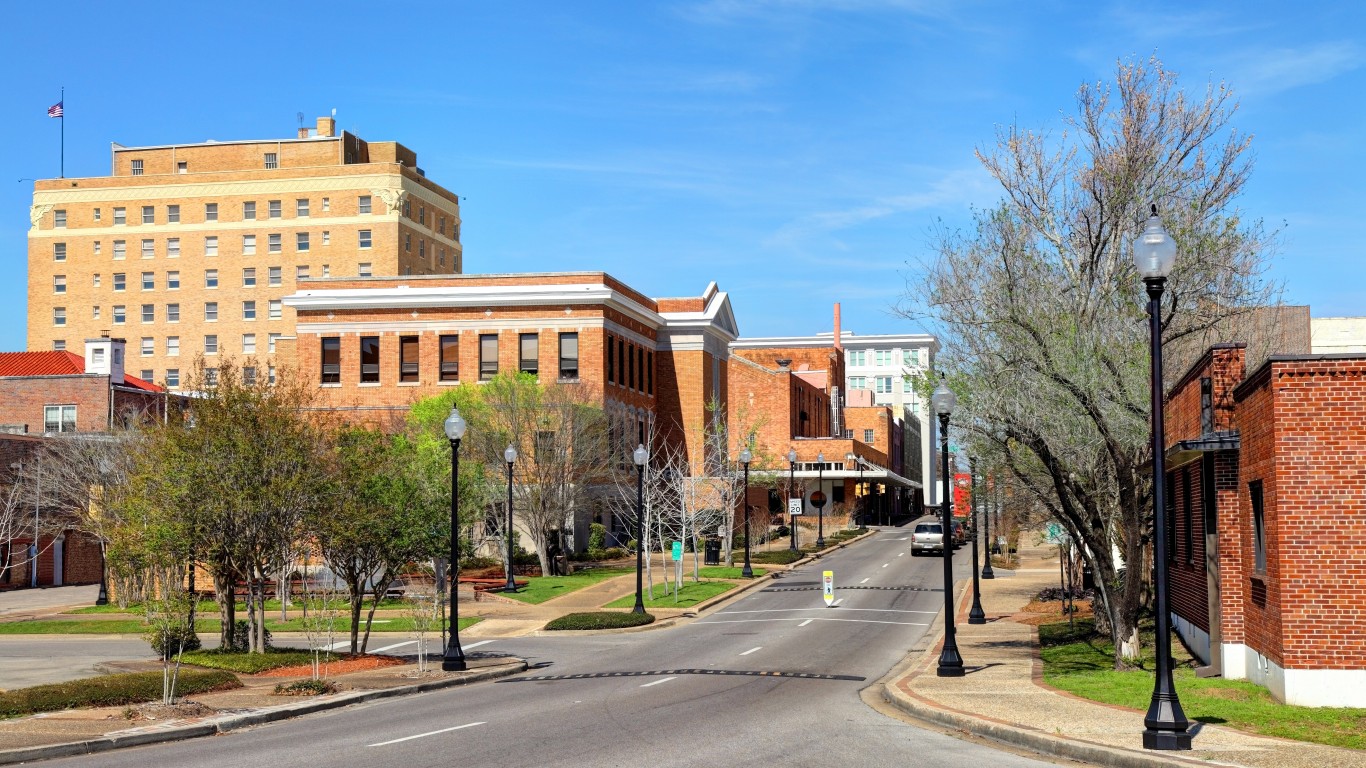
18. Hattiesburg, Mississippi
> 1-yr. change in property crime rate: 779.5 more crimes per 100k people
> Property crimes reported in 2020: 2,418 — 246th highest of 1,037 cities
> Property crimes reported in 2019: 2,065 — 314th highest of 1,037 cities
> Property crimes per 100K people in 2020: 5,271.4 — 21st highest of 1,037 cities
> Property crimes per 100K people in 2019: 4,492.0 — 70th highest of 1,037 cities
> Population: 46,098
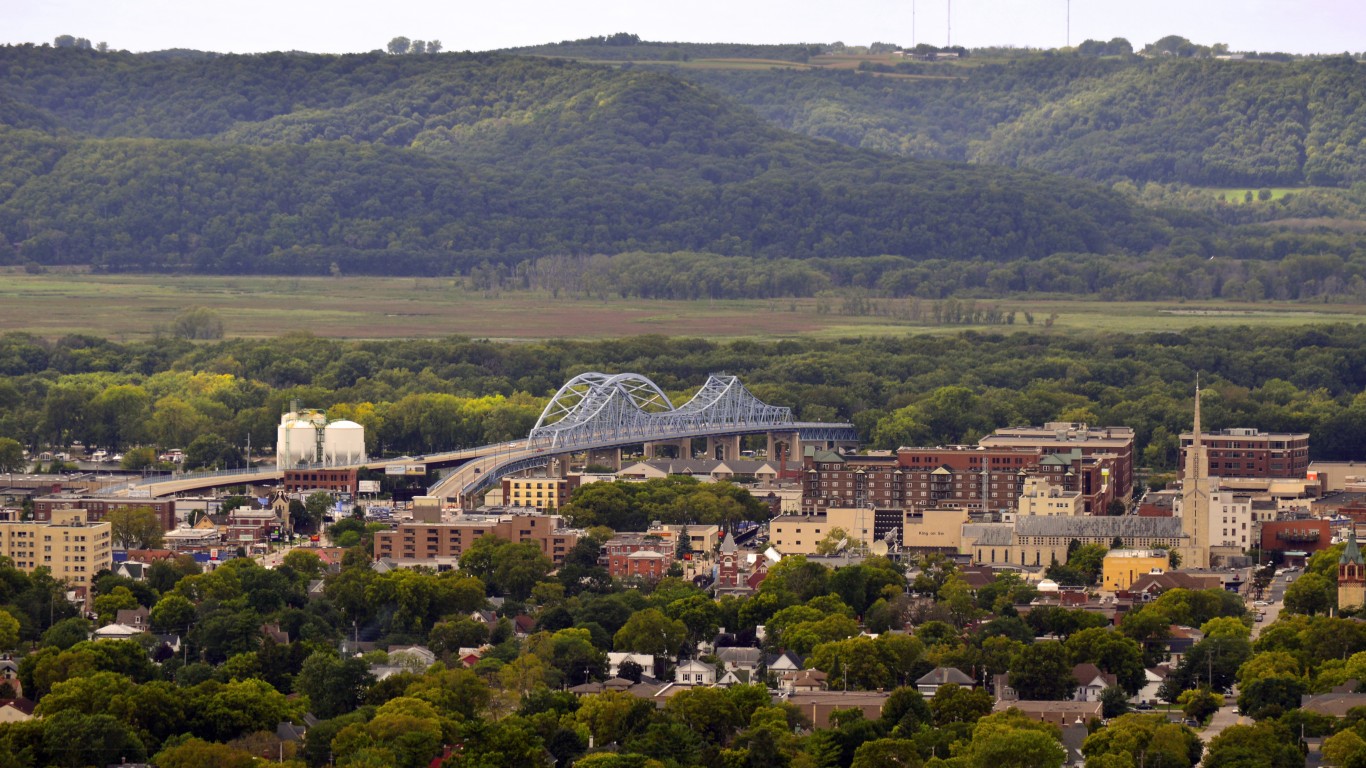
17. La Crosse, Wisconsin
> 1-yr. change in property crime rate: 780.4 more crimes per 100k people
> Property crimes reported in 2020: 2,236 — 269th highest of 1,037 cities
> Property crimes reported in 2019: 1,850 — 359th highest of 1,037 cities
> Property crimes per 100K people in 2020: 4,366.2 — 62nd highest of 1,037 cities
> Property crimes per 100K people in 2019: 3,585.9 — 167th highest of 1,037 cities
> Population: 51,666
[in-text-ad-2]

16. Rapid City, South Dakota
> 1-yr. change in property crime rate: 782.1 more crimes per 100k people
> Property crimes reported in 2020: 3,137 — 180th highest of 1,037 cities
> Property crimes reported in 2019: 2,454 — 257th highest of 1,037 cities
> Property crimes per 100K people in 2020: 3,996.6 — 92nd highest of 1,037 cities
> Property crimes per 100K people in 2019: 3,214.4 — 239th highest of 1,037 cities
> Population: 75,258

15. Puyallup, Washington
> 1-yr. change in property crime rate: 784.4 more crimes per 100k people
> Property crimes reported in 2020: 2,548 — 229th highest of 1,037 cities
> Property crimes reported in 2019: 2,187 — 291st highest of 1,037 cities
> Property crimes per 100K people in 2020: 5,929.2 — 12th highest of 1,037 cities
> Property crimes per 100K people in 2019: 5,144.8 — 42nd highest of 1,037 cities
> Population: 40,991
[in-text-ad]
14. Oakdale, Minnesota
> 1-yr. change in property crime rate: 785.1 more crimes per 100k people
> Property crimes reported in 2020: 936 — 420th lowest of 1,037 cities
> Property crimes reported in 2019: 719 — 288th lowest of 1,037 cities (tied)
> Property crimes per 100K people in 2020: 3,344.1 — 166th highest of 1,037 cities
> Property crimes per 100K people in 2019: 2,559.0 — 397th highest of 1,037 cities
> Population: 27,963
[recirclink id=1033410]
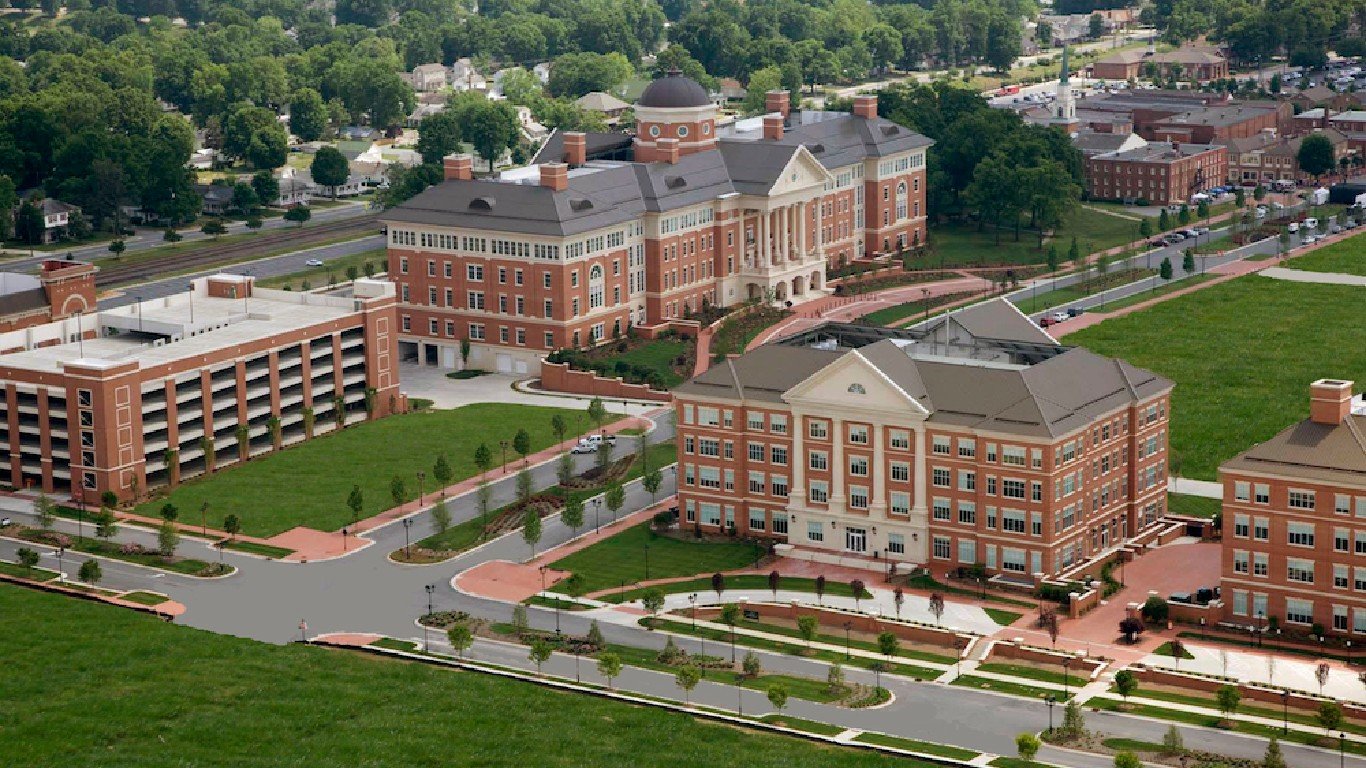
13. Morrisville, North Carolina
> 1-yr. change in property crime rate: 795.3 more crimes per 100k people
> Property crimes reported in 2020: 639 — 258th lowest of 1,037 cities (tied)
> Property crimes reported in 2019: 379 — 96th lowest of 1,037 cities
> Property crimes per 100K people in 2020: 2,111.4 — 495th highest of 1,037 cities
> Property crimes per 100K people in 2019: 1,316.2 — 200th lowest of 1,037 cities
> Population: 26,280

12. Chattanooga, Tennessee
> 1-yr. change in property crime rate: 798.9 more crimes per 100k people
> Property crimes reported in 2020: 11,709 — 41st highest of 1,037 cities
> Property crimes reported in 2019: 10,106 — 52nd highest of 1,037 cities
> Property crimes per 100K people in 2020: 6,356.3 — 8th highest of 1,037 cities
> Property crimes per 100K people in 2019: 5,557.4 — 26th highest of 1,037 cities
> Population: 179,690
[in-text-ad-2]

11. Russellville, Arkansas
> 1-yr. change in property crime rate: 825.1 more crimes per 100k people
> Property crimes reported in 2020: 1,133 — 493rd lowest of 1,037 cities
> Property crimes reported in 2019: 897 — 362nd lowest of 1,037 cities
> Property crimes per 100K people in 2020: 3,871.4 — 97th highest of 1,037 cities
> Property crimes per 100K people in 2019: 3,046.3 — 274th highest of 1,037 cities
> Population: 29,193
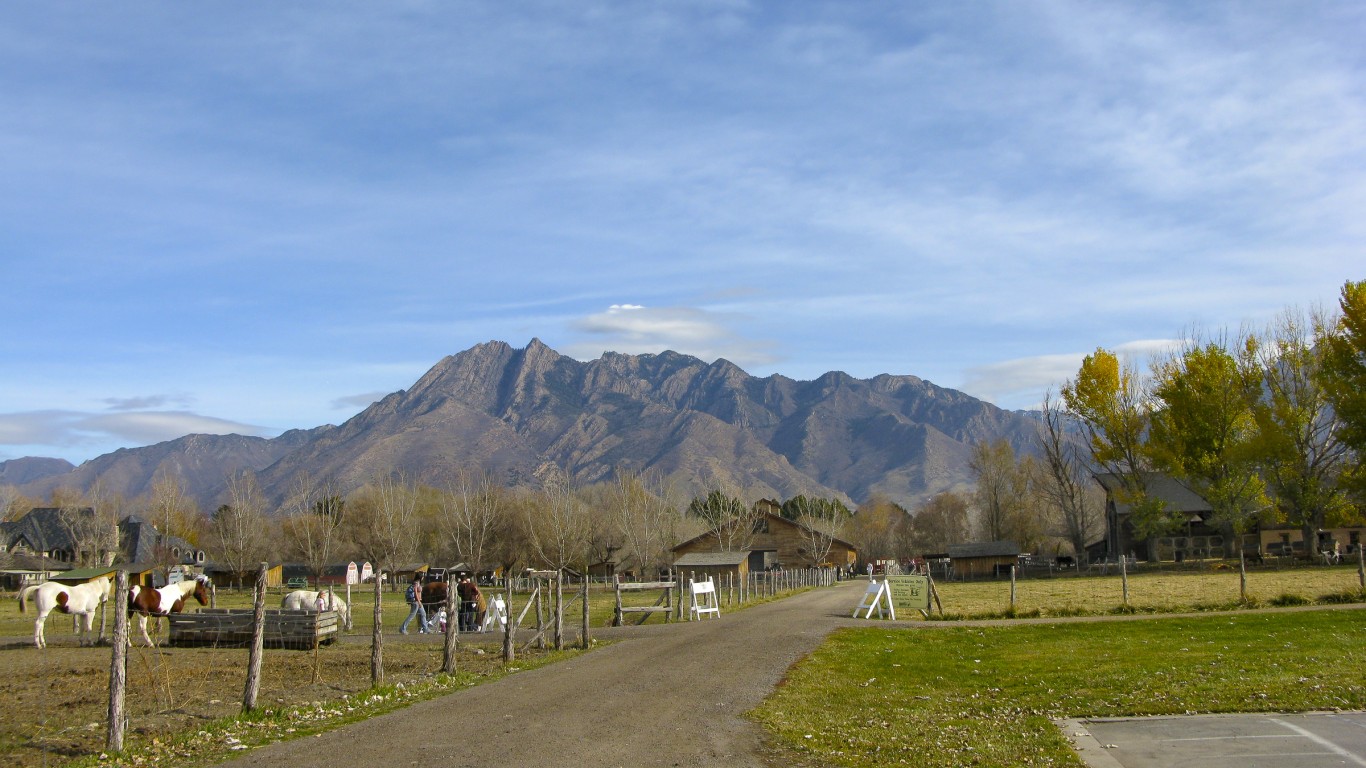
10. Murray, Utah
> 1-yr. change in property crime rate: 830.9 more crimes per 100k people
> Property crimes reported in 2020: 3,271 — 167th highest of 1,037 cities
> Property crimes reported in 2019: 2,890 — 216th highest of 1,037 cities
> Property crimes per 100K people in 2020: 6,652.6 — 5th highest of 1,037 cities
> Property crimes per 100K people in 2019: 5,821.7 — 22nd highest of 1,037 cities
> Population: 49,105
[in-text-ad]
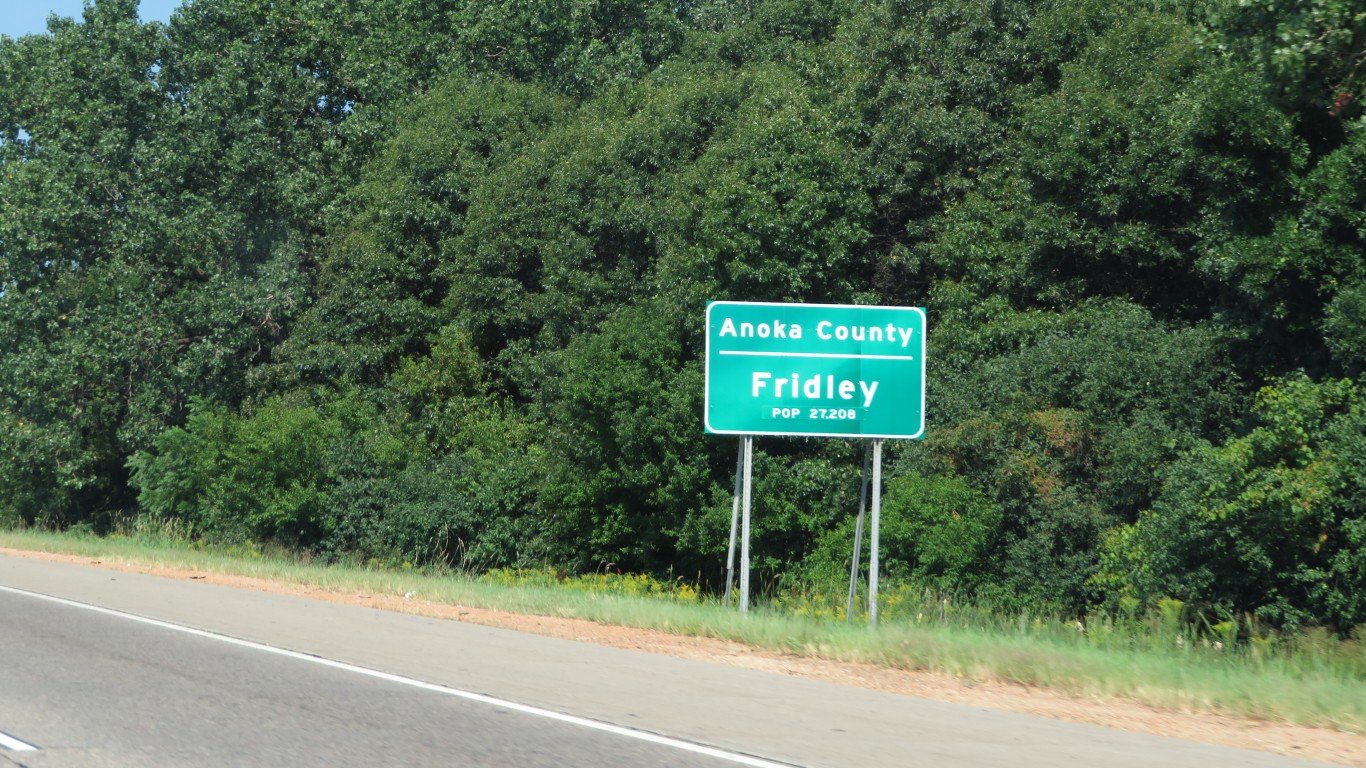
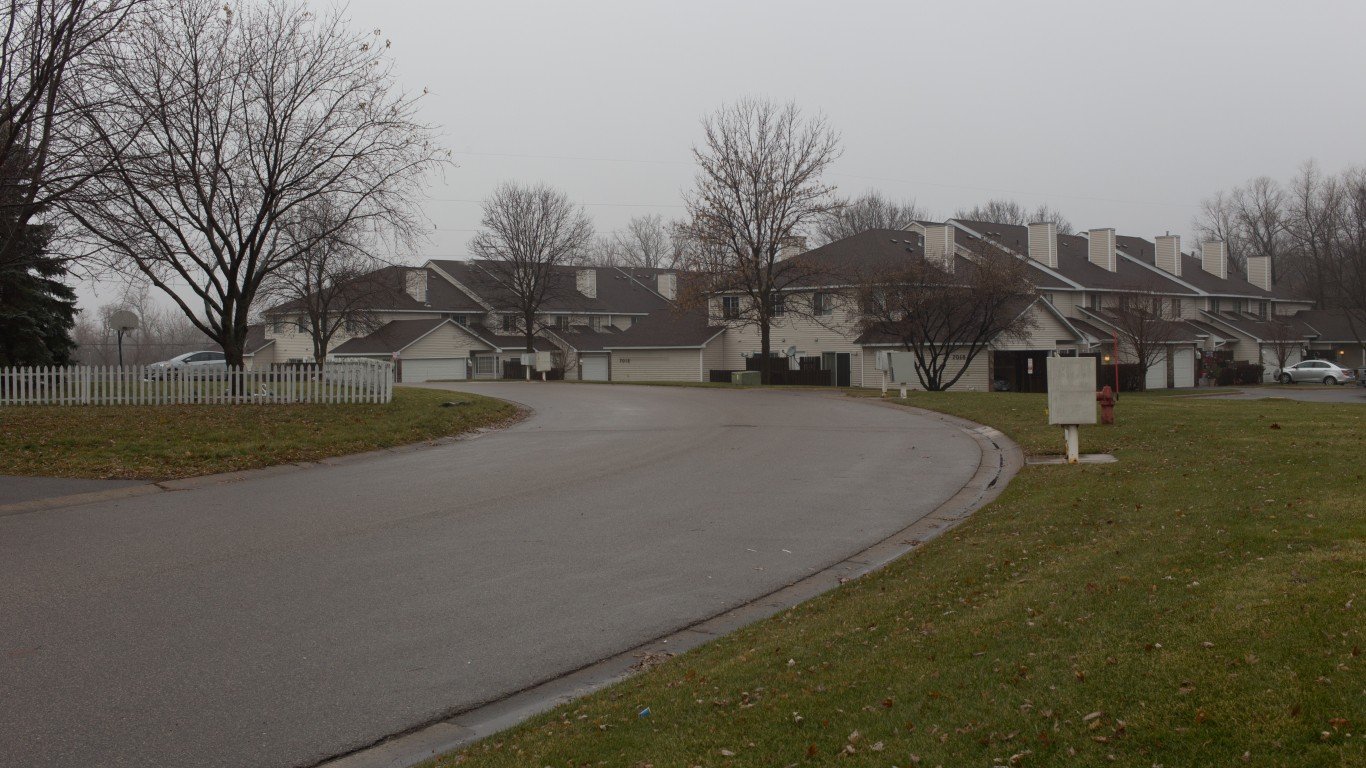
9. Fridley, Minnesota
> 1-yr. change in property crime rate: 863.2 more crimes per 100k people
> Property crimes reported in 2020: 1,280 — 470th highest of 1,037 cities
> Property crimes reported in 2019: 1,036 — 426th lowest of 1,037 cities
> Property crimes per 100K people in 2020: 4,589.1 — 50th highest of 1,037 cities
> Property crimes per 100K people in 2019: 3,725.9 — 146th highest of 1,037 cities
> Population: 27,668
[recirclink id=1039645]

8. Burien, Washington
> 1-yr. change in property crime rate: 878.9 more crimes per 100k people
> Property crimes reported in 2020: 2,183 — 278th highest of 1,037 cities
> Property crimes reported in 2019: 1,744 — 383rd highest of 1,037 cities
> Property crimes per 100K people in 2020: 4,207.9 — 72nd highest of 1,037 cities
> Property crimes per 100K people in 2019: 3,329.0 — 210th highest of 1,037 cities
> Population: 51,477

7. Denver, Colorado
> 1-yr. change in property crime rate: 905.2 more crimes per 100k people
> Property crimes reported in 2020: 34,294 — 11th highest of 1,037 cities
> Property crimes reported in 2019: 27,288 — 19th highest of 1,037 cities
> Property crimes per 100K people in 2020: 4,648.7 — 45th highest of 1,037 cities
> Property crimes per 100K people in 2019: 3,743.5 — 145th highest of 1,037 cities
> Population: 705,576
[in-text-ad-2]
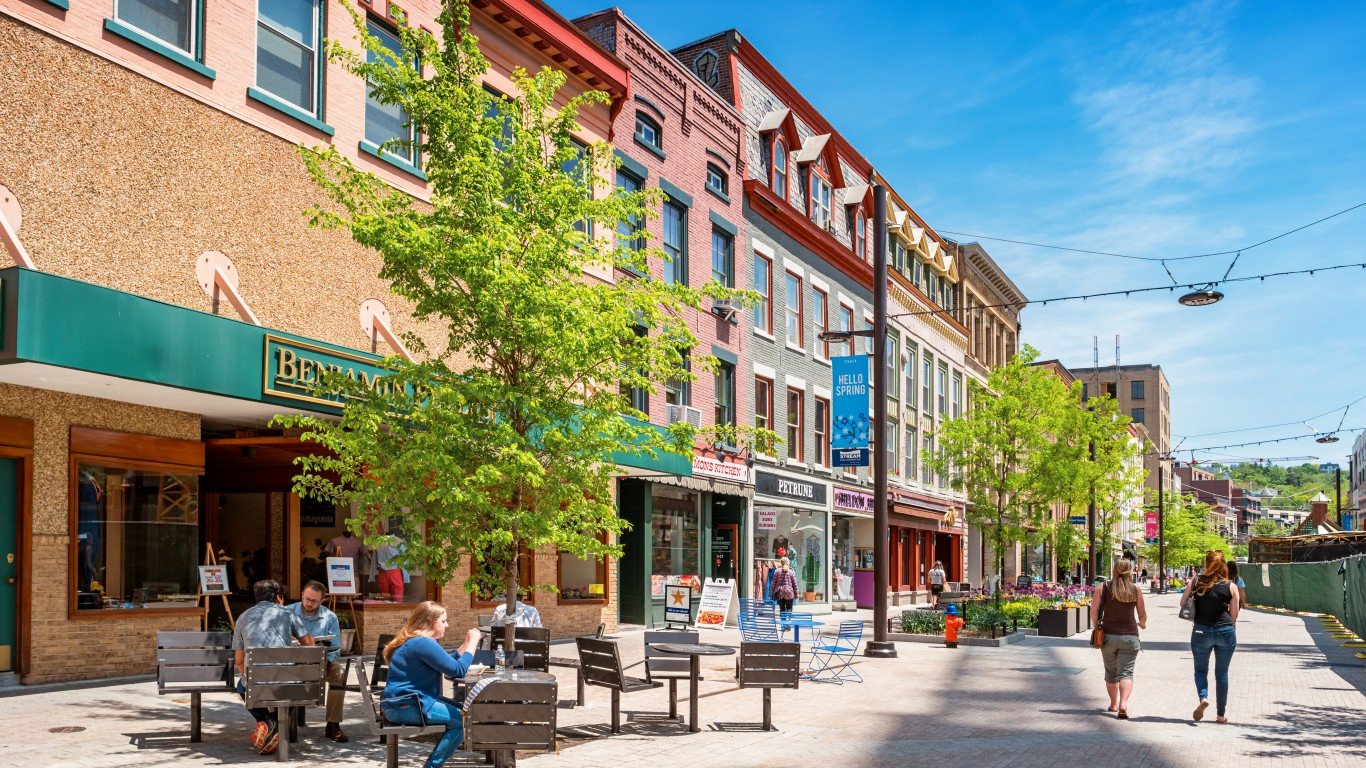
6. Ithaca, New York
> 1-yr. change in property crime rate: 1,042.0 more crimes per 100k people
> Property crimes reported in 2020: 1,157 — 510th lowest of 1,037 cities (tied)
> Property crimes reported in 2019: 840 — 341st lowest of 1,037 cities (tied)
> Property crimes per 100K people in 2020: 3,741.1 — 110th highest of 1,037 cities
> Property crimes per 100K people in 2019: 2,699.1 — 367th highest of 1,037 cities
> Population: 30,569

5. SeaTac, Washington
> 1-yr. change in property crime rate: 1,042.7 more crimes per 100k people
> Property crimes reported in 2020: 1,394 — 435th highest of 1,037 cities
> Property crimes reported in 2019: 1,098 — 448th lowest of 1,037 cities
> Property crimes per 100K people in 2020: 4,760.6 — 42nd highest of 1,037 cities
> Property crimes per 100K people in 2019: 3,717.9 — 149th highest of 1,037 cities
> Population: 29,019
[in-text-ad]

4. University Place, Washington
> 1-yr. change in property crime rate: 1,045.4 more crimes per 100k people
> Property crimes reported in 2020: 904 — 404th lowest of 1,037 cities
> Property crimes reported in 2019: 541 — 188th lowest of 1,037 cities
> Property crimes per 100K people in 2020: 2,632.6 — 321st highest of 1,037 cities
> Property crimes per 100K people in 2019: 1,587.2 — 310th lowest of 1,037 cities
> Population: 33,326
[recirclink id=1055273]

3. Bellingham, Washington
> 1-yr. change in property crime rate: 1,673.2 more crimes per 100k people
> Property crimes reported in 2020: 4,306 — 116th highest of 1,037 cities
> Property crimes reported in 2019: 2,689 — 231st highest of 1,037 cities
> Property crimes per 100K people in 2020: 4,599.0 — 49th highest of 1,037 cities
> Property crimes per 100K people in 2019: 2,925.8 — 305th highest of 1,037 cities
> Population: 88,764

2. Salt Lake City, Utah
> 1-yr. change in property crime rate: 1,694.7 more crimes per 100k people
> Property crimes reported in 2020: 14,865 — 34th highest of 1,037 cities
> Property crimes reported in 2019: 11,452 — 44th highest of 1,037 cities
> Property crimes per 100K people in 2020: 7,352.1 — 3rd highest of 1,037 cities
> Property crimes per 100K people in 2019: 5,657.4 — 25th highest of 1,037 cities
> Population: 197,756
[in-text-ad-2]
1. South Salt Lake, Utah
> 1-yr. change in property crime rate: 1,918.2 more crimes per 100k people
> Property crimes reported in 2020: 2,376 — 253rd highest of 1,037 cities
> Property crimes reported in 2019: 1,865 — 354th highest of 1,037 cities
> Property crimes per 100K people in 2020: 9,203.6 — the highest of 1,037 cities
> Property crimes per 100K people in 2019: 7,285.4 — 4th highest of 1,037 cities
> Population: 25,017
Methodology
To determine the cities where property crime is soaring, 24/7 Wall St. reviewed the change in property crime rate per 100,000 people from the FBI’s 2019 and 2020 Uniform Crime Reports. Property crime includes larceny-theft, burglary, and motor vehicle theft.
We included cities that have more than 25,000 people based on five-year estimates from the U.S. Census Bureau’s 2019 American Community Survey. Limited data was available in the 2020 UCR for areas in Alabama, Maryland, Pennsylvania, and Illinois, though these states were not excluded from analysis. Because some state and local agencies changed reporting practices between 2019 and 2020, the figures are not comparable, and these areas were excluded.
Population figures are five-year estimates from the U.S. Census Bureau’s 2019 American Community Survey. However, these estimates were not used to calculate crime rates. Crime rates per 100,000 people were calculated using population figures provided by the FBI in the 2020 and 2019 UCR.
Contact [email protected] for any questions or corrections.