Burglary – defined as the unlawful entry of a structure, such as a home or business, to commit a theft or felony – is the most serious nonviolent offense tracked by the FBI. There were just over 1 million burglaries reported in the United States in 2020, resulting in billions of dollars in stolen property.
Most burglaries in the U.S. are committed in residential properties, and more often during the day than at night. Not only do victims of burglaries typically suffer material loss, but they can also be impacted psychologically. Many burglary victims have reported heightened anxiety, difficulty sleeping, feelings of vulnerability, and even post-traumatic stress disorder in some cases.
Encouragingly, burglaries are becoming less common in the United States, with total reported cases dropping by 7% in the most recent year of available data. The decline in the burglary rates nationwide are being led by steep declines in burglary rates in some U.S. cities. Here is a look at the American cities with the fewest break-ins.
Using data from the FBI’s 2020 Uniform Crime Report, 24/7 Wall St. identified the 50 cities where the burglary rate is falling fastest. Cities – defined as places with at least 25,000 people – are ranked by the year-over-year change in the number of burglaries reported for every 100,000 people.
Among the cities on this list, burglary rates have declined anywhere from 200 incidents for every 100,000 people to 874 per 100,000. Nationwide, the burglary rate fell by 26 incidents per 100,000 people. The largest share of cities on this list are in the South, though California is home to nine of these cities, the most of any state.
Though burglary rates are falling in the cities on this list, most still have a higher burglary rate than the national rate of 314 incidents per 100,000 people. Burglary – along with vehicle theft and larceny – is one component of the overall property crime category. In nearly every city on this list, the property crime rate also fell in the last year. Here is a look at the states where property crime is soaring.
Click here to see cities where the burglary rate is falling
Click here to read our detailed methodology

50. Pompano Beach, Florida
> Change in reported burglary rate, 2019-2020: -200.0
> Burglaries reported in 2020: 434 — 192nd highest of 1,114 cities (tied)
> Burglaries per 100K people in 2020: 382.2 — 336th highest of 1,114 cities
> 1-yr. change in all property crime per 100K people: -999.9 — 34th lowest of 1,037 cities
> Property crimes per 100K people in 2020: 2,767.2 — 290th highest of 1,038 cities
> Population: 110,062
[in-text-ad]
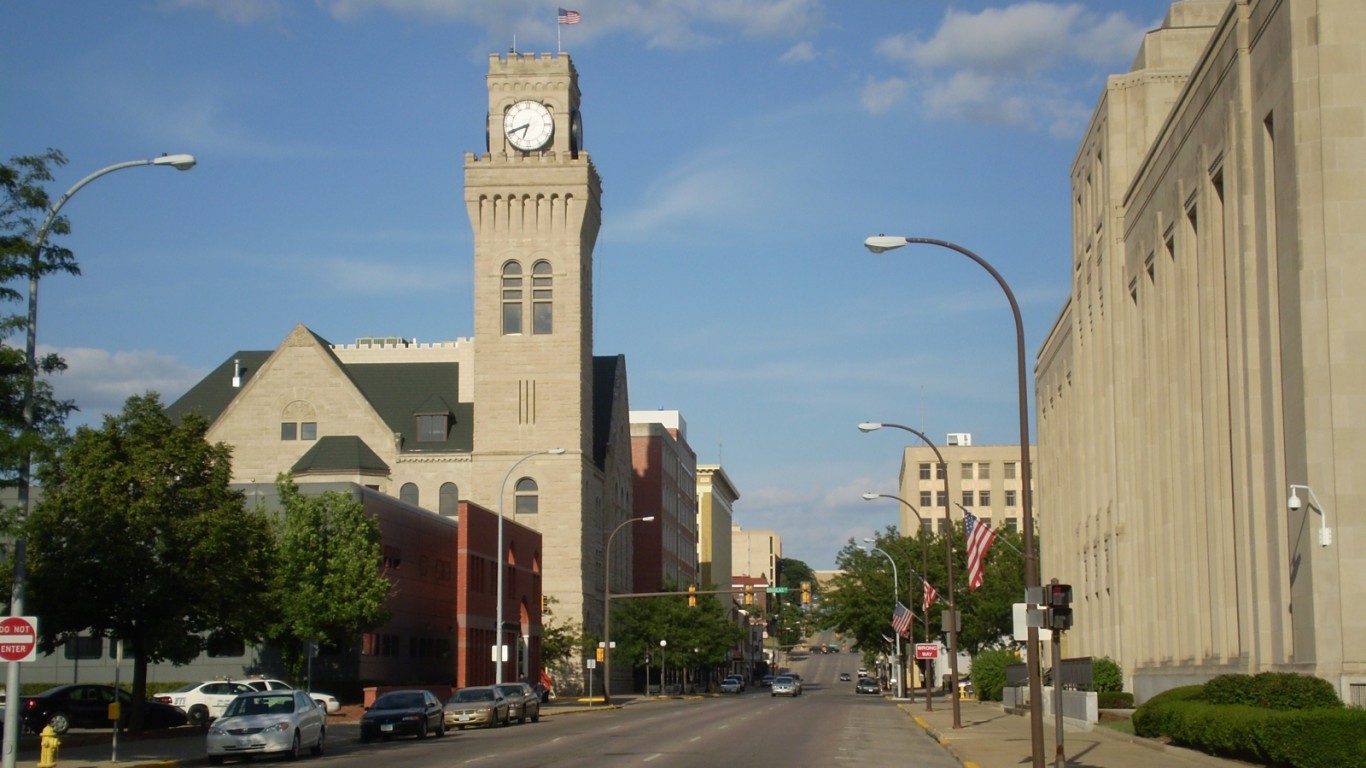
49. Sioux City, Iowa
> Change in reported burglary rate, 2019-2020: -203.6
> Burglaries reported in 2020: 479 — 168th highest of 1,114 cities (tied)
> Burglaries per 100K people in 2020: 579.7 — 130th highest of 1,114 cities
> 1-yr. change in all property crime per 100K people: -644.1 — 100th lowest of 1,037 cities
> Property crimes per 100K people in 2020: 3,245.9 — 186th highest of 1,038 cities
> Population: 82,531
[recirclink id=1059954]

48. Kingsville, Texas
> Change in reported burglary rate, 2019-2020: -204.5
> Burglaries reported in 2020: 130 — 493rd lowest of 1,114 cities (tied)
> Burglaries per 100K people in 2020: 516.0 — 170th highest of 1,114 cities
> 1-yr. change in all property crime per 100K people: -658.4 — 95th lowest of 1,037 cities
> Property crimes per 100K people in 2020: 2,306.0 — 422nd highest of 1,038 cities
> Population: 25,605

47. Modesto, California
> Change in reported burglary rate, 2019-2020: -204.6
> Burglaries reported in 2020: 706 — 106th highest of 1,114 cities
> Burglaries per 100K people in 2020: 326.0 — 434th highest of 1,114 cities
> 1-yr. change in all property crime per 100K people: -851.3 — 53rd lowest of 1,037 cities
> Property crimes per 100K people in 2020: 2,465.8 — 367th highest of 1,038 cities
> Population: 212,616
[in-text-ad-2]

46. Battle Creek, Michigan
> Change in reported burglary rate, 2019-2020: -205.1
> Burglaries reported in 2020: 335 — 260th highest of 1,114 cities
> Burglaries per 100K people in 2020: 553.9 — 145th highest of 1,114 cities
> 1-yr. change in all property crime per 100K people: -654.5 — 97th lowest of 1,037 cities
> Property crimes per 100K people in 2020: 2,594.3 — 335th highest of 1,038 cities
> Population: 51,316
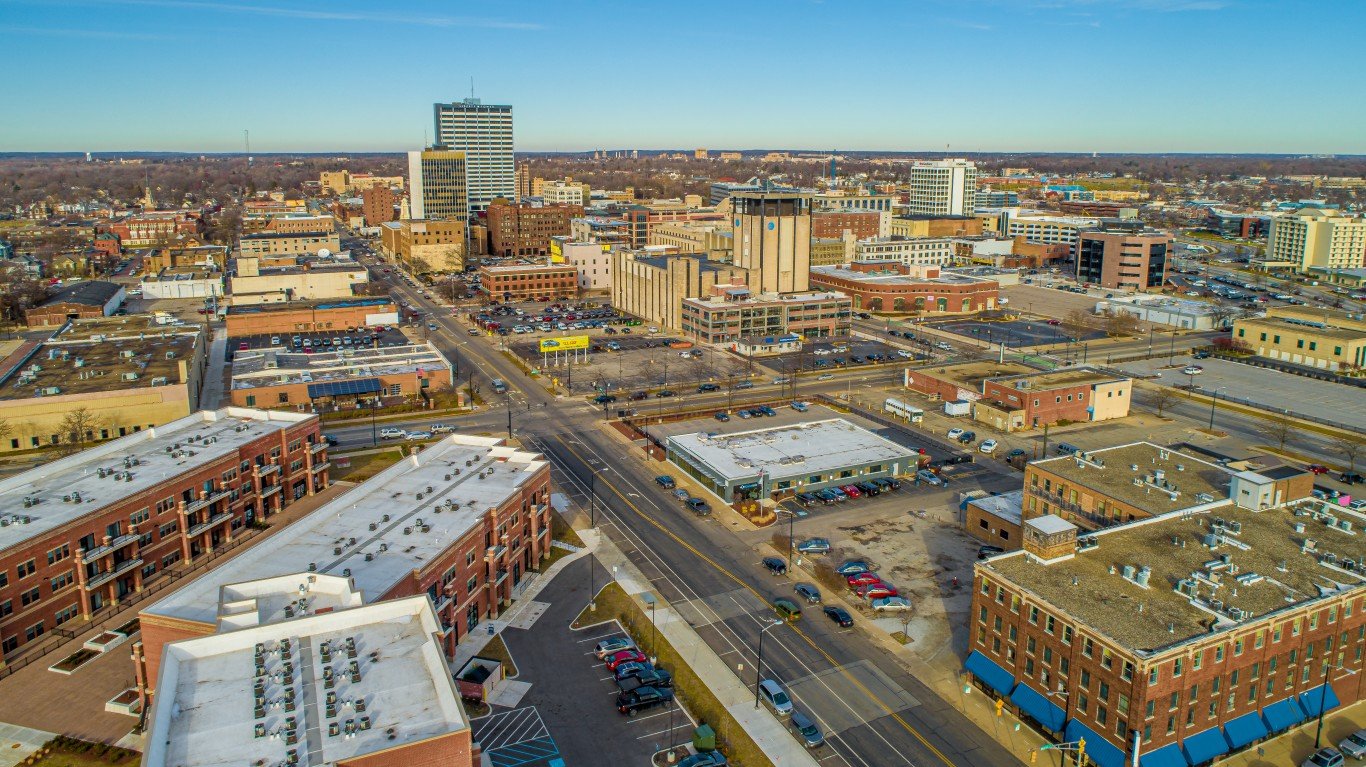
45. South Bend, Indiana
> Change in reported burglary rate, 2019-2020: -205.1
> Burglaries reported in 2020: 659 — 114th highest of 1,114 cities (tied)
> Burglaries per 100K people in 2020: 645.3 — 103rd highest of 1,114 cities
> 1-yr. change in all property crime per 100K people: -550.7 — 144th lowest of 1,037 cities
> Property crimes per 100K people in 2020: 3,663.4 — 121st highest of 1,038 cities
> Population: 102,037
[in-text-ad]

44. Toledo, Ohio
> Change in reported burglary rate, 2019-2020: -208.5
> Burglaries reported in 2020: 1,777 — 45th highest of 1,114 cities
> Burglaries per 100K people in 2020: 655.1 — 96th highest of 1,114 cities
> 1-yr. change in all property crime per 100K people: -568.7 — 132nd lowest of 1,037 cities
> Property crimes per 100K people in 2020: 2,893.8 — 258th highest of 1,038 cities
> Population: 276,614
[recirclink id=1066891]

43. Apopka, Florida
> Change in reported burglary rate, 2019-2020: -208.7
> Burglaries reported in 2020: 259 — 347th highest of 1,114 cities
> Burglaries per 100K people in 2020: 472.3 — 219th highest of 1,114 cities
> 1-yr. change in all property crime per 100K people: -962.6 — 37th lowest of 1,037 cities
> Property crimes per 100K people in 2020: 2,543.7 — 349th highest of 1,038 cities
> Population: 51,800

42. Middletown, Ohio
> Change in reported burglary rate, 2019-2020: -210.2
> Burglaries reported in 2020: 182 — 481st highest of 1,114 cities (tied)
> Burglaries per 100K people in 2020: 372.8 — 355th highest of 1,114 cities
> 1-yr. change in all property crime per 100K people: -588.1 — 122nd lowest of 1,037 cities
> Property crimes per 100K people in 2020: 2,396.9 — 391st highest of 1,038 cities
> Population: 48,621
[in-text-ad-2]

41. San Gabriel, California
> Change in reported burglary rate, 2019-2020: -214.2
> Burglaries reported in 2020: 114 — 439th lowest of 1,114 cities (tied)
> Burglaries per 100K people in 2020: 285.5 — 525th highest of 1,114 cities
> 1-yr. change in all property crime per 100K people: -453.9 — 206th lowest of 1,037 cities
> Property crimes per 100K people in 2020: 1,314.9 — 226th lowest of 1,038 cities
> Population: 40,143

40. Jacksonville, Arkansas
> Change in reported burglary rate, 2019-2020: -214.2
> Burglaries reported in 2020: 220 — 405th highest of 1,114 cities (tied)
> Burglaries per 100K people in 2020: 779.7 — 48th highest of 1,114 cities
> 1-yr. change in all property crime per 100K people: -772.8 — 64th lowest of 1,037 cities
> Property crimes per 100K people in 2020: 4,476.0 — 57th highest of 1,038 cities
> Population: 28,456
[in-text-ad]

39. Stockton, California
> Change in reported burglary rate, 2019-2020: -217.7
> Burglaries reported in 2020: 1,533 — 50th highest of 1,114 cities
> Burglaries per 100K people in 2020: 486.7 — 201st highest of 1,114 cities
> 1-yr. change in all property crime per 100K people: -962.1 — 38th lowest of 1,037 cities
> Property crimes per 100K people in 2020: 2,981.4 — 243rd highest of 1,038 cities
> Population: 309,228
[recirclink id=1023032]

38. DeLand, Florida
> Change in reported burglary rate, 2019-2020: -218.6
> Burglaries reported in 2020: 111 — 431st lowest of 1,114 cities (tied)
> Burglaries per 100K people in 2020: 309.4 — 468th highest of 1,114 cities
> 1-yr. change in all property crime per 100K people: -841.6 — 54th lowest of 1,037 cities
> Property crimes per 100K people in 2020: 2,425.2 — 378th highest of 1,038 cities
> Population: 32,413

37. Las Vegas, Nevada
> Change in reported burglary rate, 2019-2020: -221.9
> Burglaries reported in 2020: 7,057 — 9th highest of 1,114 cities
> Burglaries per 100K people in 2020: 416.8 — 289th highest of 1,114 cities
> 1-yr. change in all property crime per 100K people: -561.0 — 136th lowest of 1,037 cities
> Property crimes per 100K people in 2020: 2,210.6 — 463rd highest of 1,038 cities
> Population: 634,773
[in-text-ad-2]

36. Woodburn, Oregon
> Change in reported burglary rate, 2019-2020: -222.3
> Burglaries reported in 2020: 79 — 307th lowest of 1,114 cities (tied)
> Burglaries per 100K people in 2020: 297.9 — 498th highest of 1,114 cities
> 1-yr. change in all property crime per 100K people: -197.5 — 445th lowest of 1,037 cities
> Property crimes per 100K people in 2020: 3,288.0 — 178th highest of 1,038 cities
> Population: 25,738

35. Monroe, North Carolina
> Change in reported burglary rate, 2019-2020: -223.2
> Burglaries reported in 2020: 265 — 336th highest of 1,114 cities (tied)
> Burglaries per 100K people in 2020: 739.5 — 67th highest of 1,114 cities
> 1-yr. change in all property crime per 100K people: -435.0 — 223rd lowest of 1,037 cities
> Property crimes per 100K people in 2020: 4,844.3 — 35th highest of 1,038 cities
> Population: 35,105
[in-text-ad]

34. Burlington, North Carolina
> Change in reported burglary rate, 2019-2020: -225.1
> Burglaries reported in 2020: 419 — 204th highest of 1,114 cities
> Burglaries per 100K people in 2020: 761.8 — 59th highest of 1,114 cities
> 1-yr. change in all property crime per 100K people: -254.9 — 369th lowest of 1,037 cities
> Property crimes per 100K people in 2020: 4,347.0 — 63rd highest of 1,038 cities
> Population: 53,063
[recirclink id=1030620]

33. Greer, South Carolina
> Change in reported burglary rate, 2019-2020: -225.5
> Burglaries reported in 2020: 86 — 339th lowest of 1,114 cities (tied)
> Burglaries per 100K people in 2020: 250.6 — 505th lowest of 1,114 cities
> 1-yr. change in all property crime per 100K people: -33.8 — 386th highest of 1,037 cities
> Property crimes per 100K people in 2020: 3,062.4 — 223rd highest of 1,038 cities
> Population: 30,854

32. Southfield, Michigan
> Change in reported burglary rate, 2019-2020: -227.2
> Burglaries reported in 2020: 190 — 469th highest of 1,114 cities
> Burglaries per 100K people in 2020: 261.0 — 523rd lowest of 1,114 cities
> 1-yr. change in all property crime per 100K people: -258.1 — 366th lowest of 1,037 cities
> Property crimes per 100K people in 2020: 1,798.2 — 436th lowest of 1,038 cities
> Population: 73,174
[in-text-ad-2]

31. Lodi, California
> Change in reported burglary rate, 2019-2020: -230.4
> Burglaries reported in 2020: 204 — 436th highest of 1,114 cities (tied)
> Burglaries per 100K people in 2020: 299.1 — 496th highest of 1,114 cities
> 1-yr. change in all property crime per 100K people: -602.0 — 115th lowest of 1,037 cities
> Property crimes per 100K people in 2020: 1,850.2 — 458th lowest of 1,038 cities
> Population: 65,846

30. Wilson, North Carolina
> Change in reported burglary rate, 2019-2020: -230.5
> Burglaries reported in 2020: 251 — 355th highest of 1,114 cities (tied)
> Burglaries per 100K people in 2020: 507.2 — 178th highest of 1,114 cities
> 1-yr. change in all property crime per 100K people: -223.2 — 411th lowest of 1,037 cities
> Property crimes per 100K people in 2020: 2,907.9 — 254th highest of 1,038 cities
> Population: 49,272
[in-text-ad]

29. Springfield, Ohio
> Change in reported burglary rate, 2019-2020: -235.8
> Burglaries reported in 2020: 619 — 133rd highest of 1,114 cities
> Burglaries per 100K people in 2020: 1,054.6 — 10th highest of 1,114 cities
> 1-yr. change in all property crime per 100K people: +74.7 — 251st highest of 1,037 cities
> Property crimes per 100K people in 2020: 5,134.9 — 27th highest of 1,038 cities
> Population: 59,132
[recirclink id=1020198]

28. Elizabethtown, Kentucky
> Change in reported burglary rate, 2019-2020: -237.9
> Burglaries reported in 2020: 68 — 252nd lowest of 1,114 cities (tied)
> Burglaries per 100K people in 2020: 222.9 — 450th lowest of 1,114 cities
> 1-yr. change in all property crime per 100K people: -550.1 — 146th lowest of 1,037 cities
> Property crimes per 100K people in 2020: 937.6 — 109th lowest of 1,038 cities
> Population: 29,620
27. Summerville, South Carolina
> Change in reported burglary rate, 2019-2020: -238.0
> Burglaries reported in 2020: 120 — 462nd lowest of 1,114 cities (tied)
> Burglaries per 100K people in 2020: 223.4 — 451st lowest of 1,114 cities
> 1-yr. change in all property crime per 100K people: -355.5 — 274th lowest of 1,037 cities
> Property crimes per 100K people in 2020: 2,787.1 — 286th highest of 1,038 cities
> Population: 53,037
[in-text-ad-2]

26. Huber Heights, Ohio
> Change in reported burglary rate, 2019-2020: -240.8
> Burglaries reported in 2020: 77 — 298th lowest of 1,114 cities (tied)
> Burglaries per 100K people in 2020: 201.8 — 397th lowest of 1,114 cities
> 1-yr. change in all property crime per 100K people: -543.6 — 150th lowest of 1,037 cities
> Property crimes per 100K people in 2020: 1,787.3 — 433rd lowest of 1,038 cities
> Population: 40,006

25. Bristol, Tennessee
> Change in reported burglary rate, 2019-2020: -242.8
> Burglaries reported in 2020: 73 — 276th lowest of 1,114 cities (tied)
> Burglaries per 100K people in 2020: 270.2 — 551st lowest of 1,114 cities
> 1-yr. change in all property crime per 100K people: -157.0 — 500th lowest of 1,037 cities
> Property crimes per 100K people in 2020: 2,865.3 — 267th highest of 1,038 cities
> Population: 26,852
[in-text-ad]

24. Kingman, Arizona
> Change in reported burglary rate, 2019-2020: -245.9
> Burglaries reported in 2020: 136 — 510th lowest of 1,114 cities (tied)
> Burglaries per 100K people in 2020: 433.8 — 259th highest of 1,114 cities
> 1-yr. change in all property crime per 100K people: -857.8 — 50th lowest of 1,037 cities
> Property crimes per 100K people in 2020: 3,527.8 — 140th highest of 1,038 cities
> Population: 29,726
[recirclink id=1059954]

23. Lancaster, Ohio
> Change in reported burglary rate, 2019-2020: -254.1
> Burglaries reported in 2020: 112 — 434th lowest of 1,114 cities (tied)
> Burglaries per 100K people in 2020: 275.2 — 554th highest of 1,114 cities
> 1-yr. change in all property crime per 100K people: -813.2 — 59th lowest of 1,037 cities
> Property crimes per 100K people in 2020: 2,977.9 — 244th highest of 1,038 cities
> Population: 40,159

22. Lawton, Oklahoma
> Change in reported burglary rate, 2019-2020: -267.4
> Burglaries reported in 2020: 632 — 128th highest of 1,114 cities
> Burglaries per 100K people in 2020: 683.2 — 84th highest of 1,114 cities
> 1-yr. change in all property crime per 100K people: -982.7 — 36th lowest of 1,037 cities
> Property crimes per 100K people in 2020: 2,238.7 — 450th highest of 1,038 cities
> Population: 94,017
[in-text-ad-2]

21. Marshalltown, Iowa
> Change in reported burglary rate, 2019-2020: -267.8
> Burglaries reported in 2020: 102 — 398th lowest of 1,114 cities (tied)
> Burglaries per 100K people in 2020: 384.0 — 331st highest of 1,114 cities
> 1-yr. change in all property crime per 100K people: -726.8 — 75th lowest of 1,037 cities
> Property crimes per 100K people in 2020: 1,769.3 — 425th lowest of 1,038 cities
> Population: 27,053

20. Palm Springs, California
> Change in reported burglary rate, 2019-2020: -271.9
> Burglaries reported in 2020: 370 — 235th highest of 1,114 cities
> Burglaries per 100K people in 2020: 755.8 — 61st highest of 1,114 cities
> 1-yr. change in all property crime per 100K people: -572.5 — 129th lowest of 1,037 cities
> Property crimes per 100K people in 2020: 3,452.4 — 147th highest of 1,038 cities
> Population: 47,897
[in-text-ad]

19. Alexandria, Louisiana
> Change in reported burglary rate, 2019-2020: -273.3
> Burglaries reported in 2020: 754 — 96th highest of 1,114 cities
> Burglaries per 100K people in 2020: 1,639.6 — 2nd highest of 1,114 cities
> 1-yr. change in all property crime per 100K people: -1,751.1 — 5th lowest of 1,037 cities
> Property crimes per 100K people in 2020: 7,213.1 — 4th highest of 1,038 cities
> Population: 47,012
[recirclink id=1066891]

18. Miami Beach, Florida
> Change in reported burglary rate, 2019-2020: -279.0
> Burglaries reported in 2020: 444 — 188th highest of 1,114 cities
> Burglaries per 100K people in 2020: 498.8 — 187th highest of 1,114 cities
> 1-yr. change in all property crime per 100K people: -1,829.1 — 3rd lowest of 1,037 cities
> Property crimes per 100K people in 2020: 5,739.4 — 16th highest of 1,038 cities
> Population: 90,108
17. Joplin, Missouri
> Change in reported burglary rate, 2019-2020: -284.8
> Burglaries reported in 2020: 379 — 228th highest of 1,114 cities
> Burglaries per 100K people in 2020: 744.1 — 65th highest of 1,114 cities
> 1-yr. change in all property crime per 100K people: -830.0 — 55th lowest of 1,037 cities
> Property crimes per 100K people in 2020: 6,431.7 — 7th highest of 1,038 cities
> Population: 50,386
[in-text-ad-2]

16. Panama City, Florida
> Change in reported burglary rate, 2019-2020: -305.5
> Burglaries reported in 2020: 252 — 354th highest of 1,114 cities
> Burglaries per 100K people in 2020: 726.8 — 71st highest of 1,114 cities
> 1-yr. change in all property crime per 100K people: -954.6 — 39th lowest of 1,037 cities
> Property crimes per 100K people in 2020: 4,190.7 — 73rd highest of 1,038 cities
> Population: 36,640

15. Memphis, Tennessee
> Change in reported burglary rate, 2019-2020: -308.5
> Burglaries reported in 2020: 5,831 — 10th highest of 1,114 cities
> Burglaries per 100K people in 2020: 895.8 — 24th highest of 1,114 cities
> 1-yr. change in all property crime per 100K people: -567.7 — 135th lowest of 1,037 cities
> Property crimes per 100K people in 2020: 5,560.8 — 18th highest of 1,038 cities
> Population: 651,932
[in-text-ad]

14. Elmira, New York
> Change in reported burglary rate, 2019-2020: -313.6
> Burglaries reported in 2020: 87 — 344th lowest of 1,114 cities (tied)
> Burglaries per 100K people in 2020: 324.4 — 441st highest of 1,114 cities
> 1-yr. change in all property crime per 100K people: -55.0 — 412th highest of 1,037 cities
> Property crimes per 100K people in 2020: 3,027.6 — 230th highest of 1,038 cities
> Population: 27,402
[recirclink id=1023032]

13. Hot Springs, Arkansas
> Change in reported burglary rate, 2019-2020: -339.5
> Burglaries reported in 2020: 656 — 117th highest of 1,114 cities
> Burglaries per 100K people in 2020: 1,686.7 — the highest of 1,114 cities
> 1-yr. change in all property crime per 100K people: -1,324.1 — 12th lowest of 1,037 cities
> Property crimes per 100K people in 2020: 5,852.0 — 13th highest of 1,038 cities
> Population: 38,559
12. Chicago Heights, Illinois
> Change in reported burglary rate, 2019-2020: -349.3
> Burglaries reported in 2020: 116 — 450th lowest of 1,114 cities (tied)
> Burglaries per 100K people in 2020: 397.2 — 304th highest of 1,114 cities
> 1-yr. change in all property crime per 100K people: N/A
> Property crimes per 100K people in 2020: N/A
> Population: 29,856
[in-text-ad-2]

11. Canton, Ohio
> Change in reported burglary rate, 2019-2020: -361.9
> Burglaries reported in 2020: 708 — 105th highest of 1,114 cities
> Burglaries per 100K people in 2020: 1,009.6 — 14th highest of 1,114 cities
> 1-yr. change in all property crime per 100K people: -428.1 — 225th lowest of 1,037 cities
> Property crimes per 100K people in 2020: 4,864.2 — 33rd highest of 1,038 cities
> Population: 71,243

10. Detroit, Michigan
> Change in reported burglary rate, 2019-2020: -366.7
> Burglaries reported in 2020: 4,361 — 15th highest of 1,114 cities
> Burglaries per 100K people in 2020: 661.1 — 94th highest of 1,114 cities
> 1-yr. change in all property crime per 100K people: -1,092.3 — 23rd lowest of 1,037 cities
> Property crimes per 100K people in 2020: 3,210.7 — 189th highest of 1,038 cities
> Population: 674,841
[in-text-ad]

9. San Bernardino, California
> Change in reported burglary rate, 2019-2020: -381.2
> Burglaries reported in 2020: 1,201 — 67th highest of 1,114 cities
> Burglaries per 100K people in 2020: 555.1 — 140th highest of 1,114 cities
> 1-yr. change in all property crime per 100K people: -1,389.9 — 10th lowest of 1,037 cities
> Property crimes per 100K people in 2020: 2,800.4 — 280th highest of 1,038 cities
> Population: 216,089
[recirclink id=1030620]

8. Shawnee, Oklahoma
> Change in reported burglary rate, 2019-2020: -397.9
> Burglaries reported in 2020: 219 — 408th highest of 1,114 cities
> Burglaries per 100K people in 2020: 692.9 — 81st highest of 1,114 cities
> 1-yr. change in all property crime per 100K people: -556.8 — 140th lowest of 1,037 cities
> Property crimes per 100K people in 2020: 4,239.7 — 69th highest of 1,038 cities
> Population: 31,235
7. Portsmouth, Virginia
> Change in reported burglary rate, 2019-2020: -406.5
> Burglaries reported in 2020: 465 — 177th highest of 1,114 cities (tied)
> Burglaries per 100K people in 2020: 493.6 — 195th highest of 1,114 cities
> 1-yr. change in all property crime per 100K people: -1,321.1 — 13th lowest of 1,037 cities
> Property crimes per 100K people in 2020: 4,540.1 — 52nd highest of 1,038 cities
> Population: 95,097
[in-text-ad-2]

6. Hemet, California
> Change in reported burglary rate, 2019-2020: -416.9
> Burglaries reported in 2020: 398 — 219th highest of 1,114 cities
> Burglaries per 100K people in 2020: 462.5 — 231st highest of 1,114 cities
> 1-yr. change in all property crime per 100K people: -944.9 — 40th lowest of 1,037 cities
> Property crimes per 100K people in 2020: 2,397.2 — 390th highest of 1,038 cities
> Population: 84,542

5. Warren, Ohio
> Change in reported burglary rate, 2019-2020: -439.7
> Burglaries reported in 2020: 267 — 330th highest of 1,114 cities (tied)
> Burglaries per 100K people in 2020: 694.2 — 79th highest of 1,114 cities
> 1-yr. change in all property crime per 100K people: -1,098.5 — 21st lowest of 1,037 cities
> Property crimes per 100K people in 2020: 2,789.8 — 284th highest of 1,038 cities
> Population: 39,307
[in-text-ad]

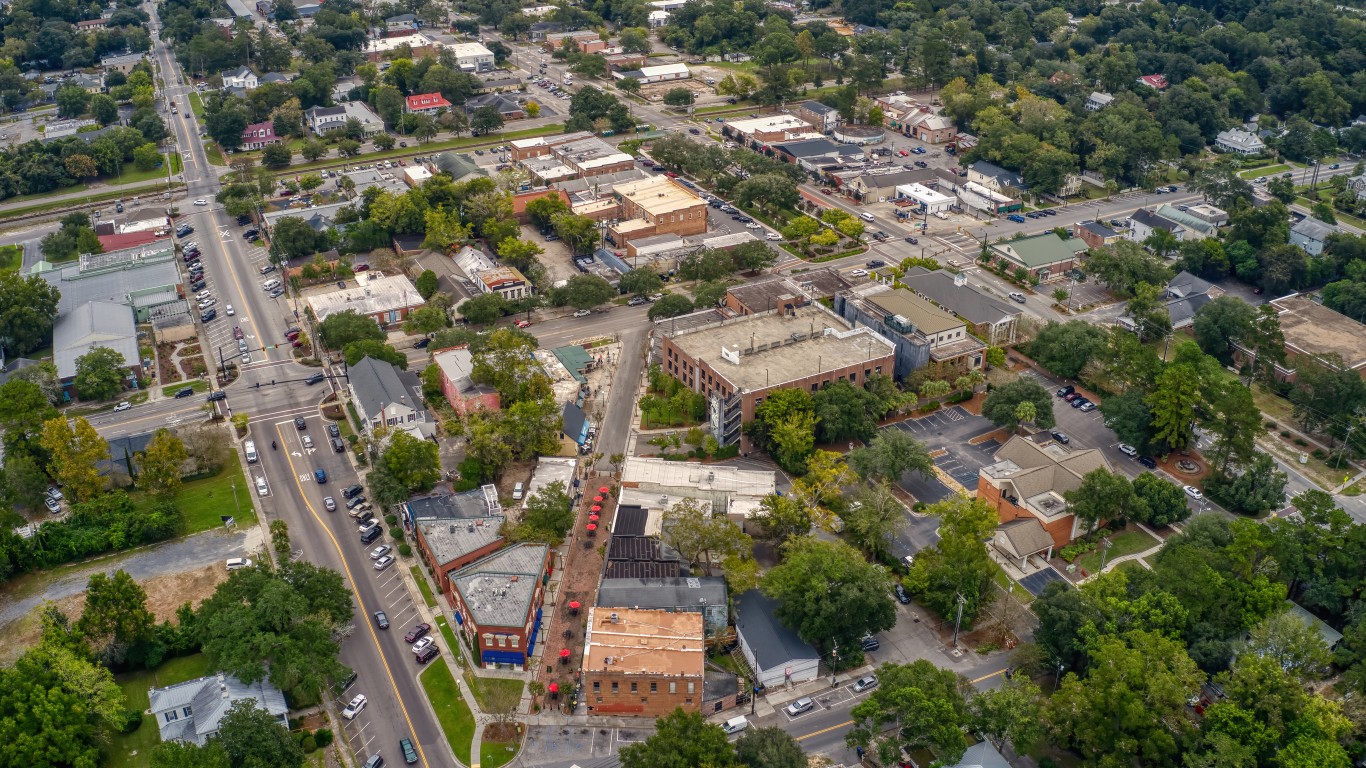
4. Sumter, South Carolina
> Change in reported burglary rate, 2019-2020: -470.3
> Burglaries reported in 2020: 211 — 422nd highest of 1,114 cities (tied)
> Burglaries per 100K people in 2020: 533.6 — 159th highest of 1,114 cities
> 1-yr. change in all property crime per 100K people: -851.8 — 52nd lowest of 1,037 cities
> Property crimes per 100K people in 2020: 3,689.7 — 115th highest of 1,038 cities
> Population: 39,800
[recirclink id=1020198]

3. Desert Hot Springs, California
> Change in reported burglary rate, 2019-2020: -542.3
> Burglaries reported in 2020: 143 — 535th lowest of 1,114 cities (tied)
> Burglaries per 100K people in 2020: 491.8 — 198th highest of 1,114 cities
> 1-yr. change in all property crime per 100K people: -685.2 — 86th lowest of 1,037 cities
> Property crimes per 100K people in 2020: 1,651.0 — 371st lowest of 1,038 cities
> Population: 28,585
2. El Mirage, Arizona
> Change in reported burglary rate, 2019-2020: -638.7
> Burglaries reported in 2020: 131 — 496th lowest of 1,114 cities (tied)
> Burglaries per 100K people in 2020: 361.7 — 370th highest of 1,114 cities
> 1-yr. change in all property crime per 100K people: -496.9 — 171st lowest of 1,037 cities
> Property crimes per 100K people in 2020: 2,216.9 — 462nd highest of 1,038 cities
> Population: 35,333
[in-text-ad-2]

1. Vallejo, California
> Change in reported burglary rate, 2019-2020: -874.1
> Burglaries reported in 2020: 1,811 — 44th highest of 1,114 cities
> Burglaries per 100K people in 2020: 1,480.5 — 3rd highest of 1,114 cities
> 1-yr. change in all property crime per 100K people: -694.6 — 83rd lowest of 1,037 cities
> Property crimes per 100K people in 2020: 3,333.7 — 167th highest of 1,038 cities
> Population: 121,267
Methodology
To determine the cities where the burglary rate is falling fastest, 24/7 Wall St. reviewed the change in burglaries per 100,000 people from the FBI’s 2019 and 2020 Uniform Crime Reports. Crime rates were calculated using population figures provided by the FBI in the 2020 and 2019 UCR.
Limited data was available in the 2020 UCR for areas in Alabama, Maryland, Pennsylvania, and Illinois, though cities in these states were not excluded from analysis. Because some state and local agencies changed reporting practices between 2019 and 2020, the figures are not comparable, and the areas were excluded.
To concentrate on urban areas, we excluded places with fewer than 25,000 people based on five-year estimates from the U.S. Census Bureau’s 2019 American Community Survey.
Contact [email protected] for any questions or corrections.