The number of American workers working from home – particularly those in white collar jobs – skyrocketed during the pandemic. The shift has proved to be a positive development in some ways. A recent Gallup study found that over 90% of remote workers hope that the trend continues after the pandemic, citing the lack of commute time as the chief benefit.
Still, for a large share of the workforce, remote work is not an option. Gallup reports that 55% full-time employees in the United States do not work remotely – and commute time still makes up a significant portion of their day. (Here is a look at the state where the most people are working from home.)
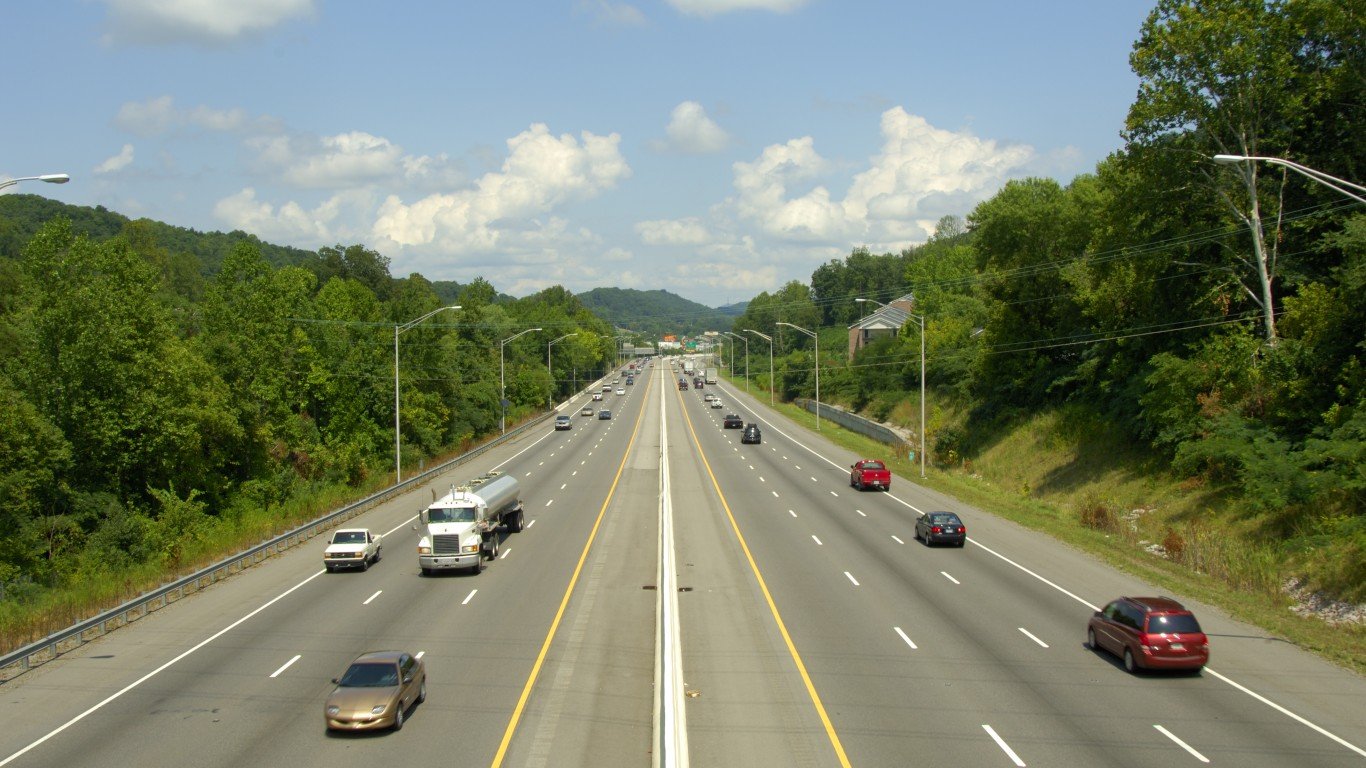
According to the U.S. Census Bureau, the average commute time in the United States is 26.9 minutes. For those who travel to and from work every Monday through Friday, this translates to about 4.5 hours per week, or nearly 10 days a year.
Of course, commute times vary from person to person, but in some parts of the country, workers who are still commuting tend to have far less travel time than others. Using census data, 24/7 Wall St. identified the 50 U.S. counties and county equivalents with the shortest commutes.
In every county on this list, average commute times are about 13 minutes or less. This adds up to about two hours per week or less, and less than five days per year.
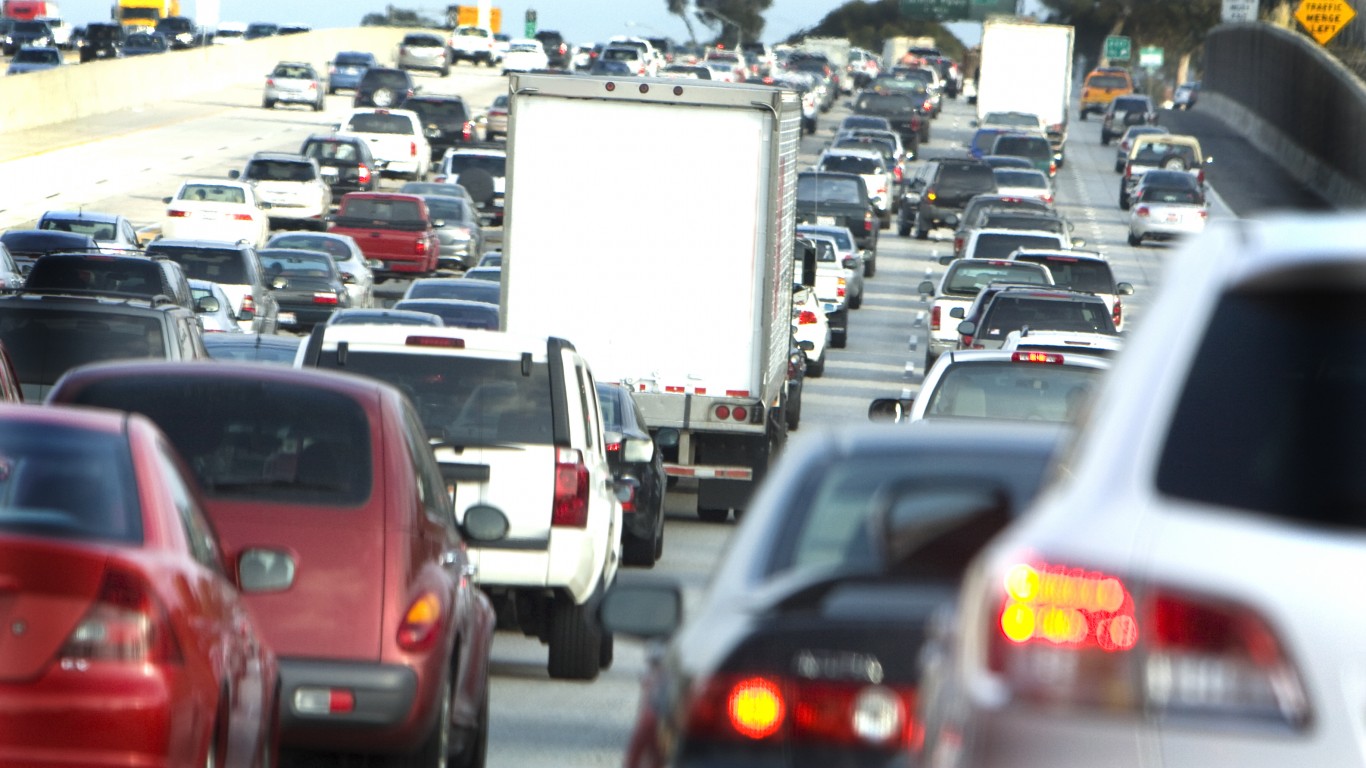
The largest share of places on this list are in the Midwest, and none are in the Northeast. In nearly every county and county equivalent on this list, the share of commuters using public transit is below the 4.6% national average. In most cases, public transportation is less direct than simply driving from door to door, adding to overall commute time. Here is a look at the cities where people lose the most time driving each year.
Click here to see the places where people spend the least time getting to work
Click here to see our detailed methodology
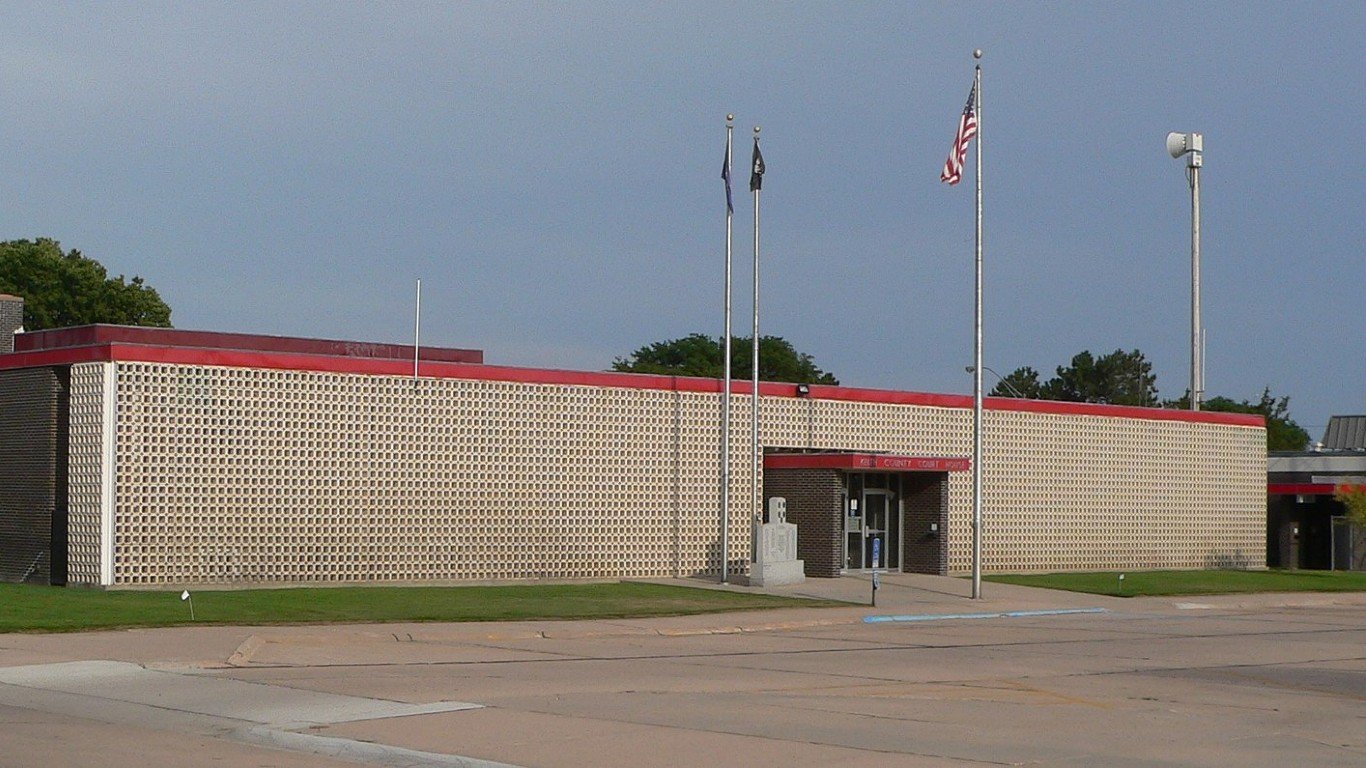
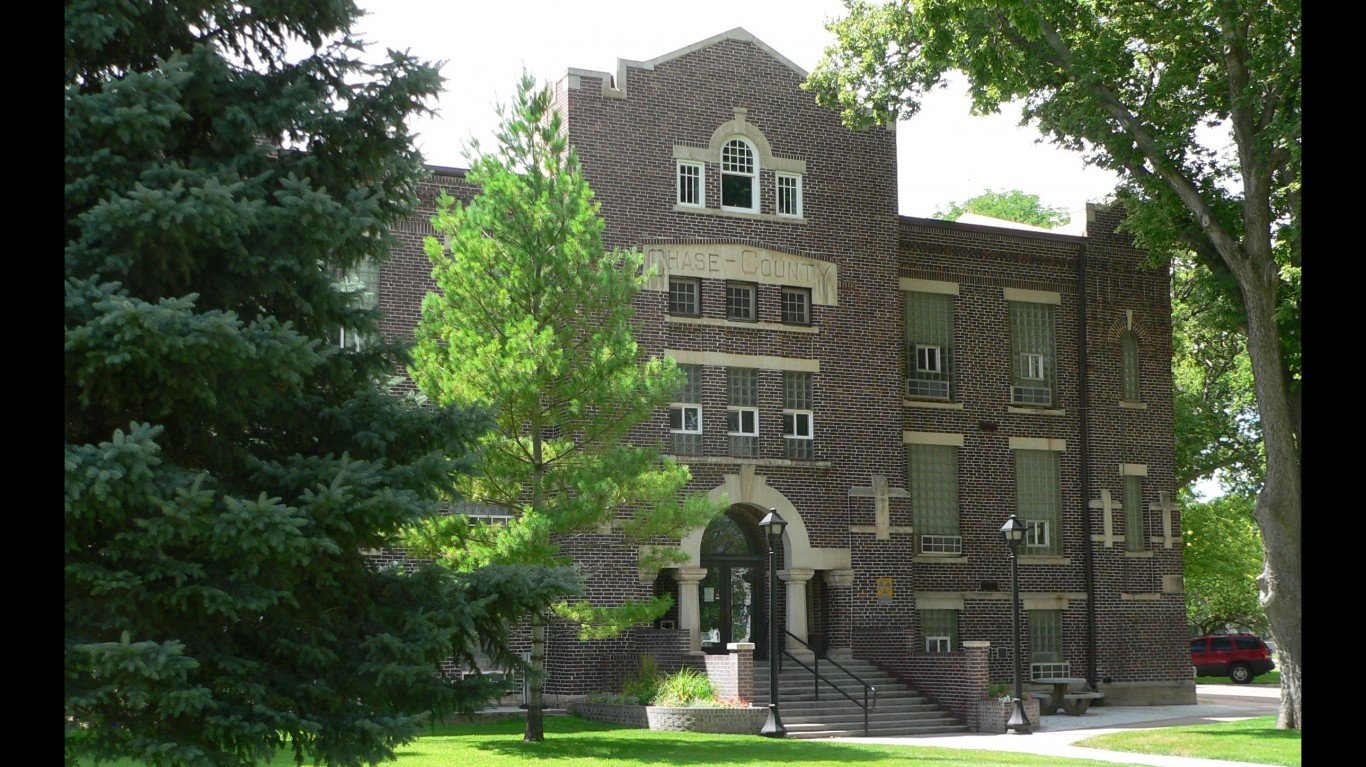
50. Keith County, Nebraska
> Avg. commute time (minutes): 13.3
> Share of commuters driving alone: 82.1% — 1,139th highest of 2,997 counties
> Share of commuters carpooling: 4.2% — 39th lowest of 2,997 counties
> Share of commuters using public transit: 0.3% — 1,415th highest of 2,997 counties
[in-text-ad]

49. Brule County, South Dakota
> Avg. commute time (minutes): 13.3
> Share of commuters driving alone: 71.0% — 210th lowest of 2,997 counties
> Share of commuters carpooling: 9.0% — 1,426th lowest of 2,997 counties
> Share of commuters using public transit: 0.3% — 1,477th highest of 2,997 counties
[recirclink id=987778]

48. Ford County, Kansas
> Avg. commute time (minutes): 13.2
> Share of commuters driving alone: 80.4% — 1,415th lowest of 2,997 counties
> Share of commuters carpooling: 15.0% — 127th highest of 2,997 counties
> Share of commuters using public transit: 0.2% — 1,156th lowest of 2,997 counties

47. Charles Mix County, South Dakota
> Avg. commute time (minutes): 13.2
> Share of commuters driving alone: 74.7% — 430th lowest of 2,997 counties
> Share of commuters carpooling: 8.4% — 1,140th lowest of 2,997 counties
> Share of commuters using public transit: 0.8% — 634th highest of 2,997 counties
[in-text-ad-2]
46. Norton County, Kansas
> Avg. commute time (minutes): 13.2
> Share of commuters driving alone: 76.5% — 626th lowest of 2,997 counties
> Share of commuters carpooling: 9.7% — 1,188th highest of 2,997 counties
> Share of commuters using public transit: 0.4% — 1,286th highest of 2,997 counties
45. Stevens County, Kansas
> Avg. commute time (minutes): 13.1
> Share of commuters driving alone: 81.1% — 1,400th highest of 2,997 counties
> Share of commuters carpooling: 8.3% — 1,059th lowest of 2,997 counties
> Share of commuters using public transit: 0.0% reported — the lowest of 2,997 counties (tied)
[in-text-ad]
44. Tripp County, South Dakota
> Avg. commute time (minutes): 13.1
> Share of commuters driving alone: 77.1% — 706th lowest of 2,997 counties
> Share of commuters carpooling: 9.9% — 1,129th highest of 2,997 counties
> Share of commuters using public transit: 0.0% reported — the lowest of 2,997 counties (tied)
[recirclink id=1044820]
43. Custer County, Montana
> Avg. commute time (minutes): 13.1
> Share of commuters driving alone: 72.2% — 266th lowest of 2,997 counties
> Share of commuters carpooling: 14.2% — 183rd highest of 2,997 counties
> Share of commuters using public transit: 0.4% — 1,106th highest of 2,997 counties

42. Lake County, Oregon
> Avg. commute time (minutes): 13.1
> Share of commuters driving alone: 68.7% — 142nd lowest of 2,997 counties
> Share of commuters carpooling: 5.7% — 160th lowest of 2,997 counties
> Share of commuters using public transit: 0.1% — 849th lowest of 2,997 counties
[in-text-ad-2]
41. Brown County, South Dakota
> Avg. commute time (minutes): 13.0
> Share of commuters driving alone: 81.9% — 1,209th highest of 2,997 counties
> Share of commuters carpooling: 7.5% — 668th lowest of 2,997 counties
> Share of commuters using public transit: 0.0% — 523rd lowest of 2,997 counties
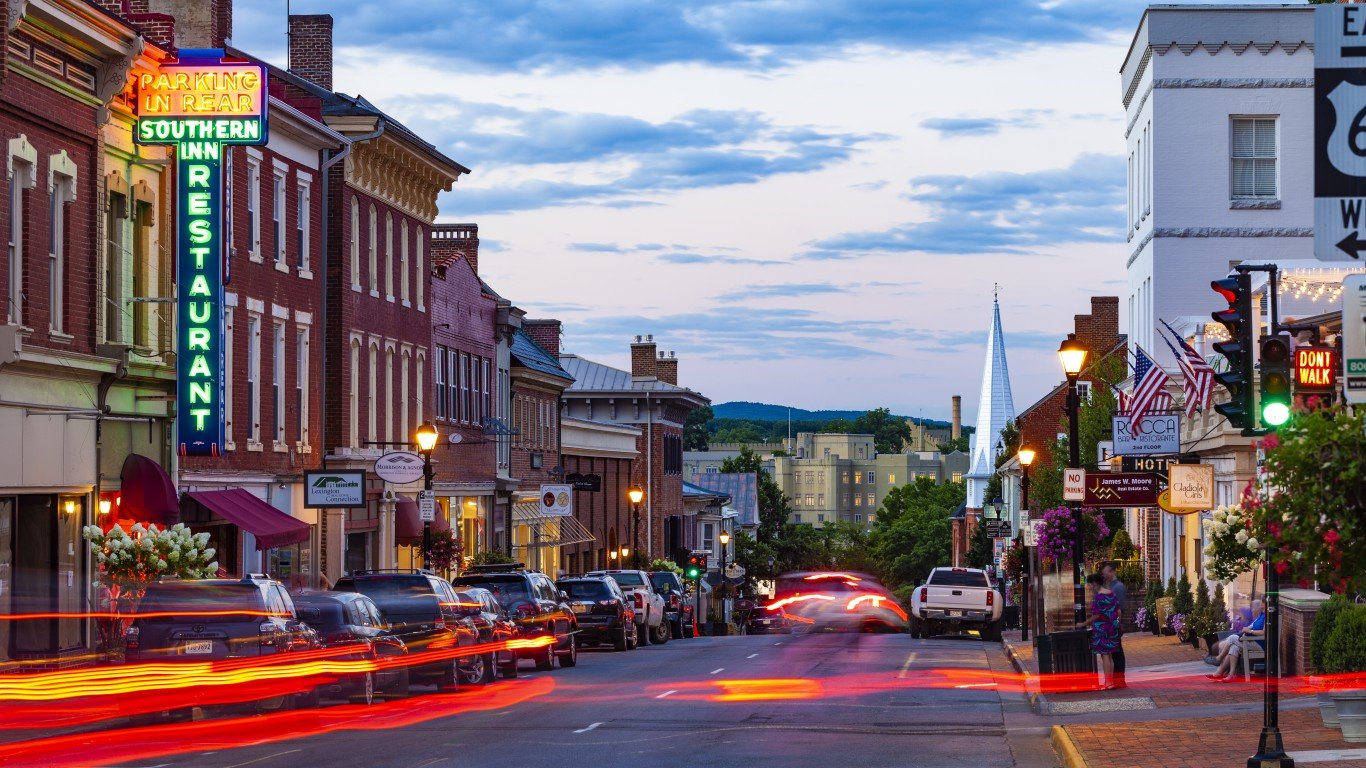
40. Lexington city, Virginia
> Avg. commute time (minutes): 13.0
> Share of commuters driving alone: 52.1% — 23rd lowest of 2,997 counties
> Share of commuters carpooling: 7.2% — 571st lowest of 2,997 counties
> Share of commuters using public transit: 0.0% reported — the lowest of 2,997 counties (tied)
[in-text-ad]
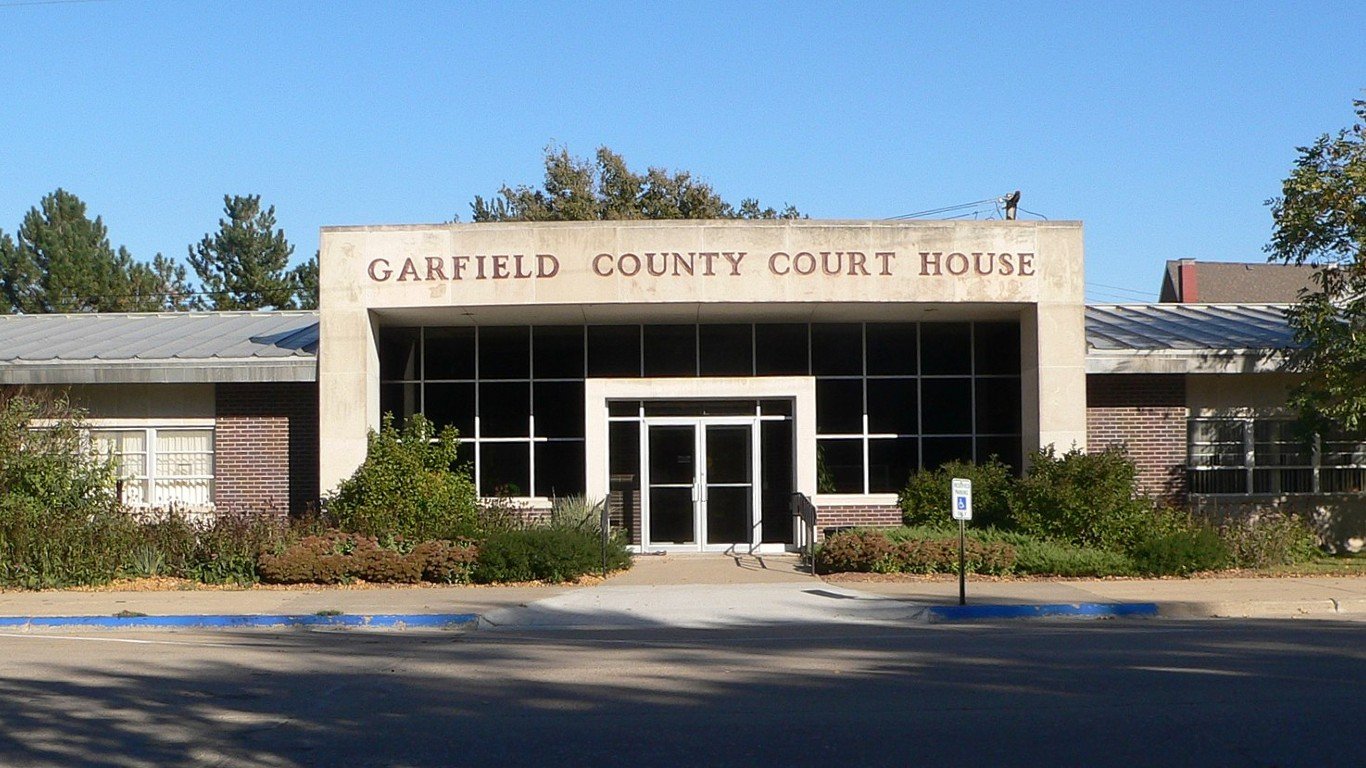
39. Garfield County, Nebraska
> Avg. commute time (minutes): 12.7
> Share of commuters driving alone: 73.6% — 357th lowest of 2,997 counties
> Share of commuters carpooling: 6.0% — 213th lowest of 2,997 counties
> Share of commuters using public transit: 0.0% reported — the lowest of 2,997 counties (tied)
[recirclink id=1054986]
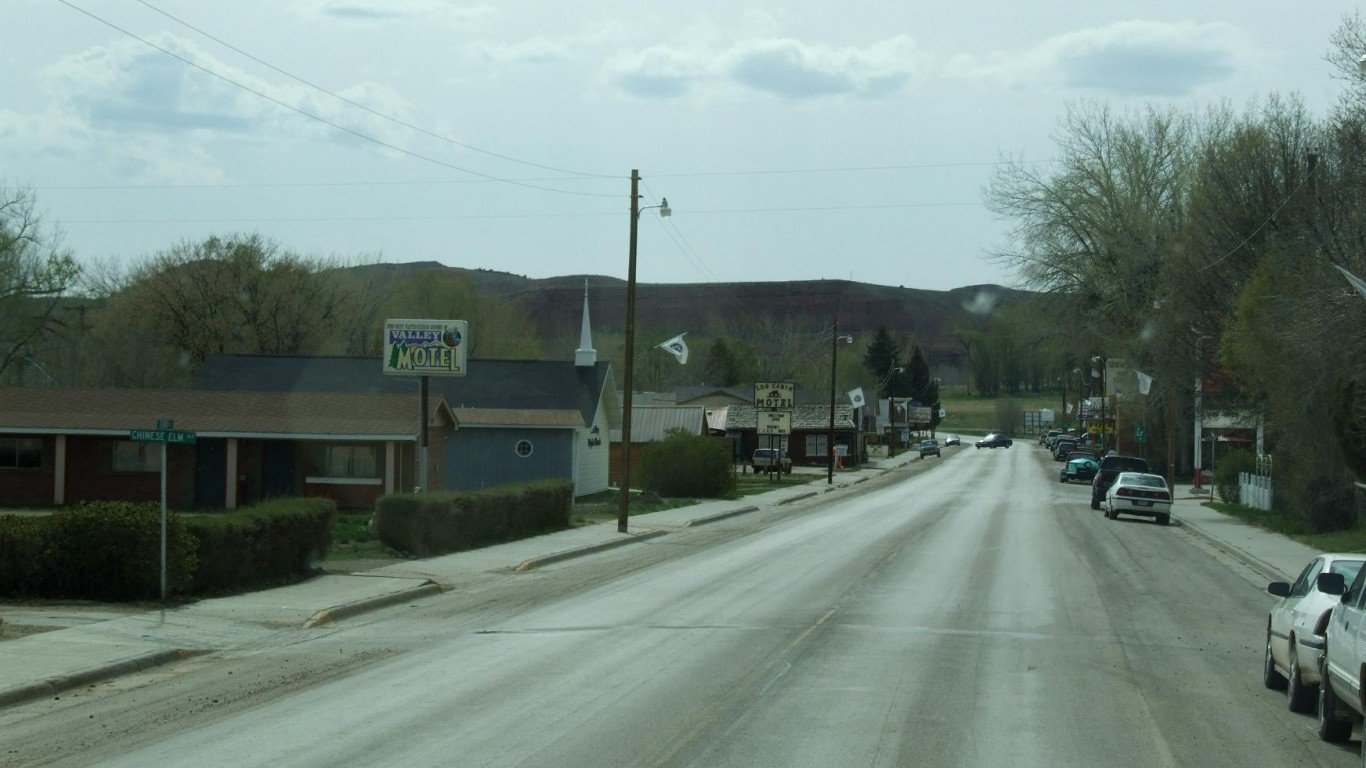
38. Washakie County, Wyoming
> Avg. commute time (minutes): 12.7
> Share of commuters driving alone: 83.8% — 702nd highest of 2,997 counties
> Share of commuters carpooling: 4.6% — 52nd lowest of 2,997 counties
> Share of commuters using public transit: 0.0% reported — the lowest of 2,997 counties (tied)
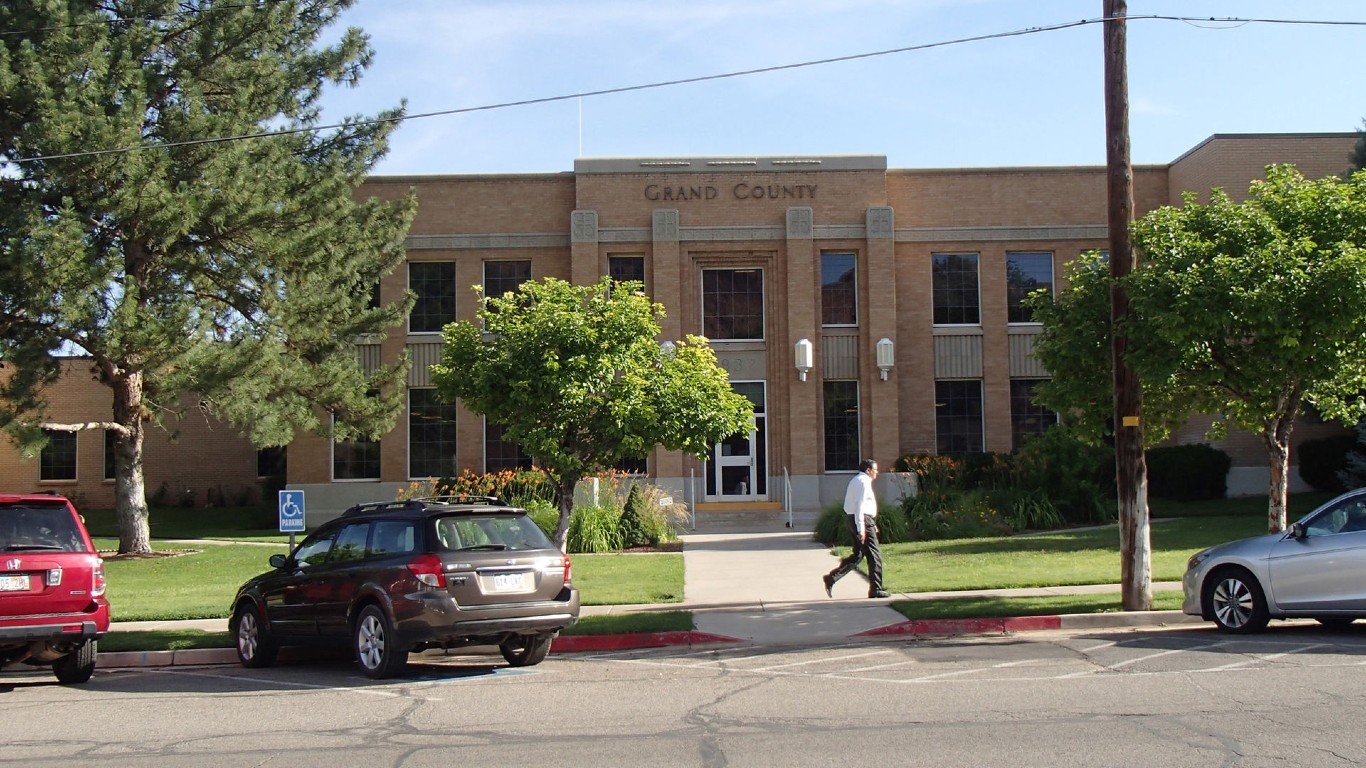
37. Grand County, Utah
> Avg. commute time (minutes): 12.7
> Share of commuters driving alone: 79.2% — 1,140th lowest of 2,997 counties
> Share of commuters carpooling: 5.9% — 192nd lowest of 2,997 counties
> Share of commuters using public transit: 0.1% — 716th lowest of 2,997 counties
[in-text-ad-2]
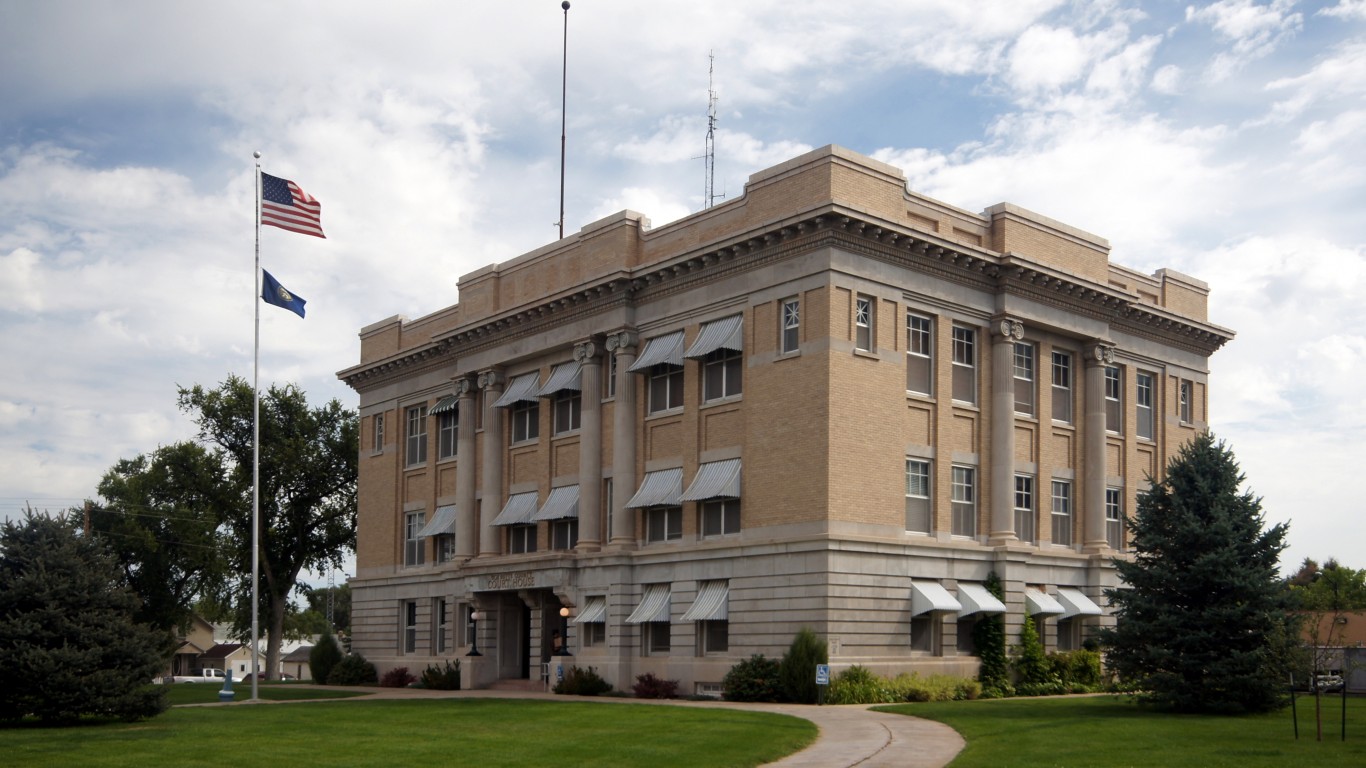
36. Phillips County, Montana
> Avg. commute time (minutes): 12.6
> Share of commuters driving alone: 60.4% — 45th lowest of 2,997 counties
> Share of commuters carpooling: 8.1% — 982nd lowest of 2,997 counties
> Share of commuters using public transit: 0.6% — 818th highest of 2,997 counties
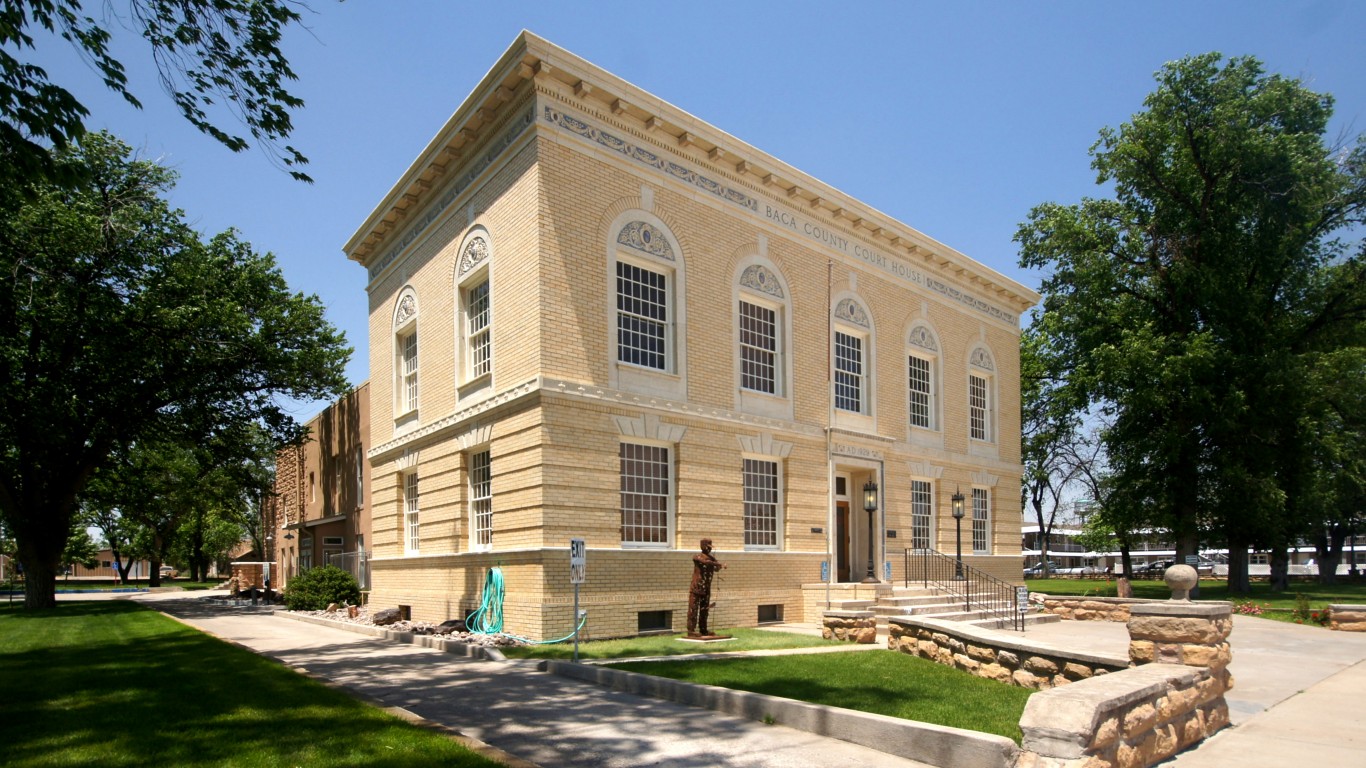
35. Baca County, Colorado
> Avg. commute time (minutes): 12.5
> Share of commuters driving alone: 80.0% — 1,325th lowest of 2,997 counties (tied)
> Share of commuters carpooling: 7.5% — 678th lowest of 2,997 counties
> Share of commuters using public transit: 0.0% reported — the lowest of 2,997 counties (tied)
[in-text-ad]
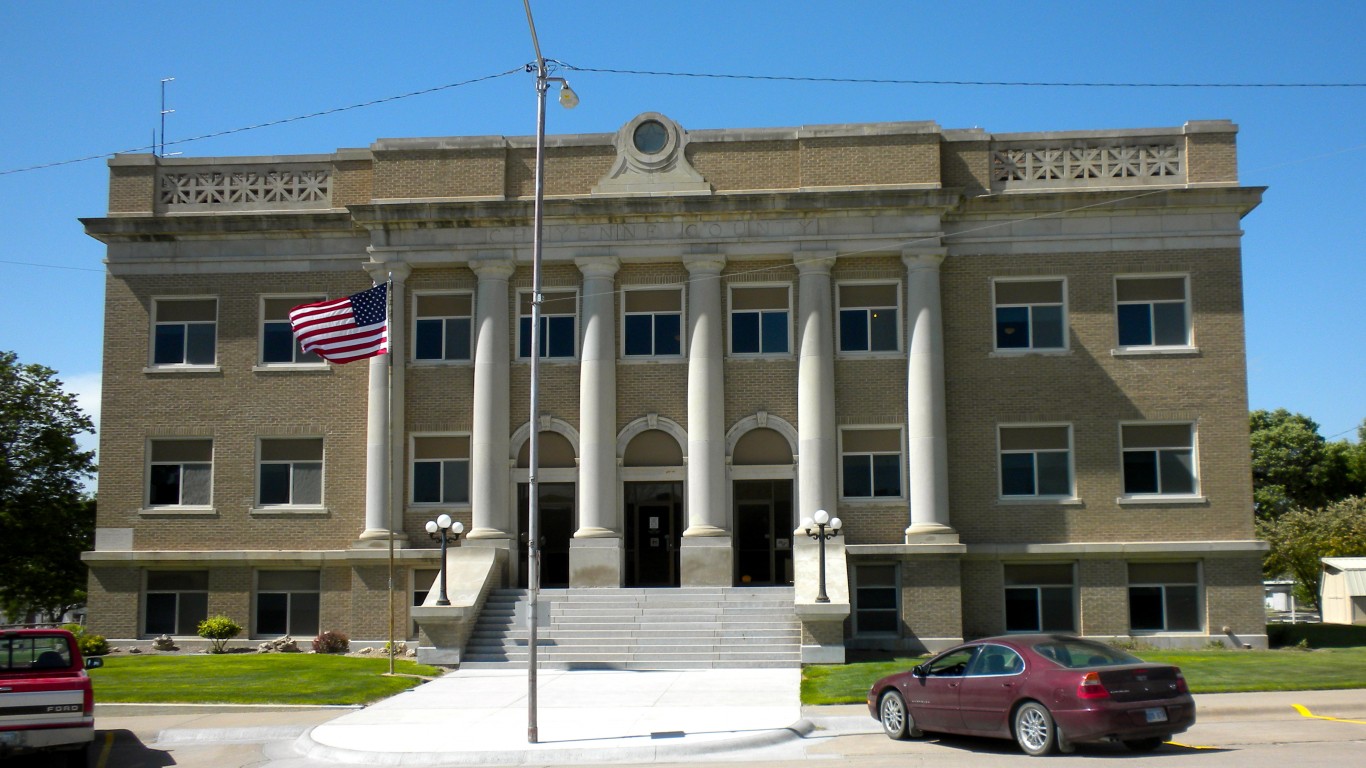
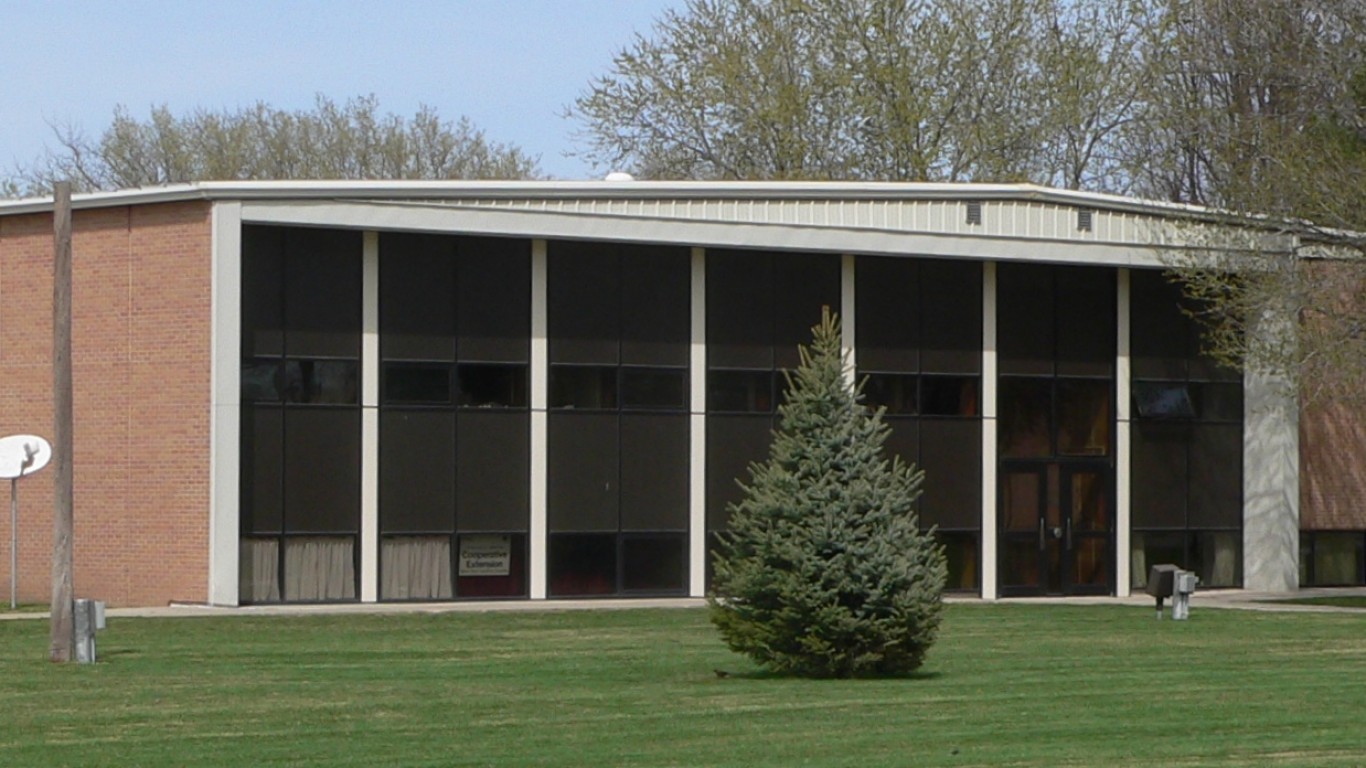
34. Cheyenne County, Kansas
> Avg. commute time (minutes): 12.5
> Share of commuters driving alone: 75.4% — 508th lowest of 2,997 counties
> Share of commuters carpooling: 4.8% — 66th lowest of 2,997 counties
> Share of commuters using public transit: 0.0% reported — the lowest of 2,997 counties (tied)
[recirclink id=1060122]
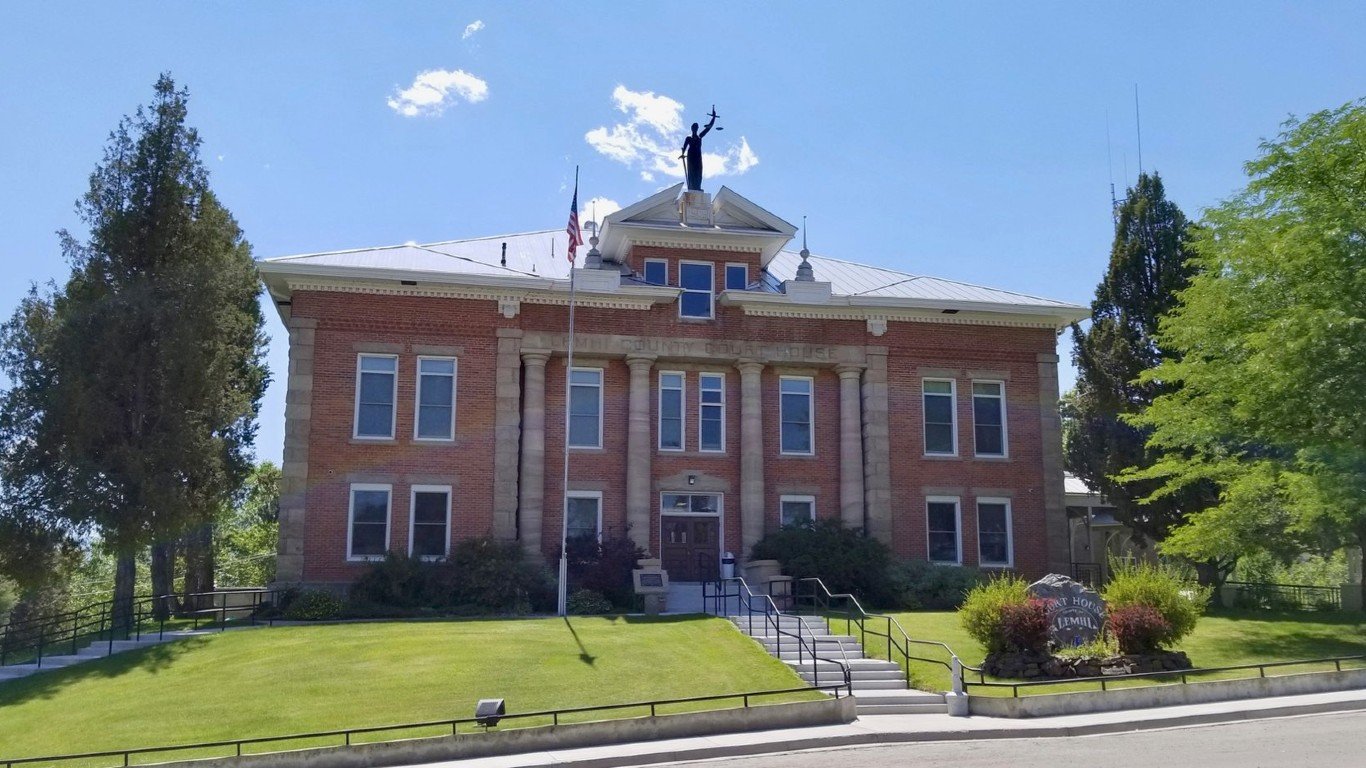
33. Lemhi County, Idaho
> Avg. commute time (minutes): 12.5
> Share of commuters driving alone: 72.9% — 306th lowest of 2,997 counties
> Share of commuters carpooling: 9.9% — 1,110th highest of 2,997 counties
> Share of commuters using public transit: 0.0% reported — the lowest of 2,997 counties (tied)
32. Cherry County, Nebraska
> Avg. commute time (minutes): 12.4
> Share of commuters driving alone: 63.0% — 58th lowest of 2,997 counties
> Share of commuters carpooling: 11.8% — 503rd highest of 2,997 counties
> Share of commuters using public transit: 1.0% — 537th highest of 2,997 counties
[in-text-ad-2]
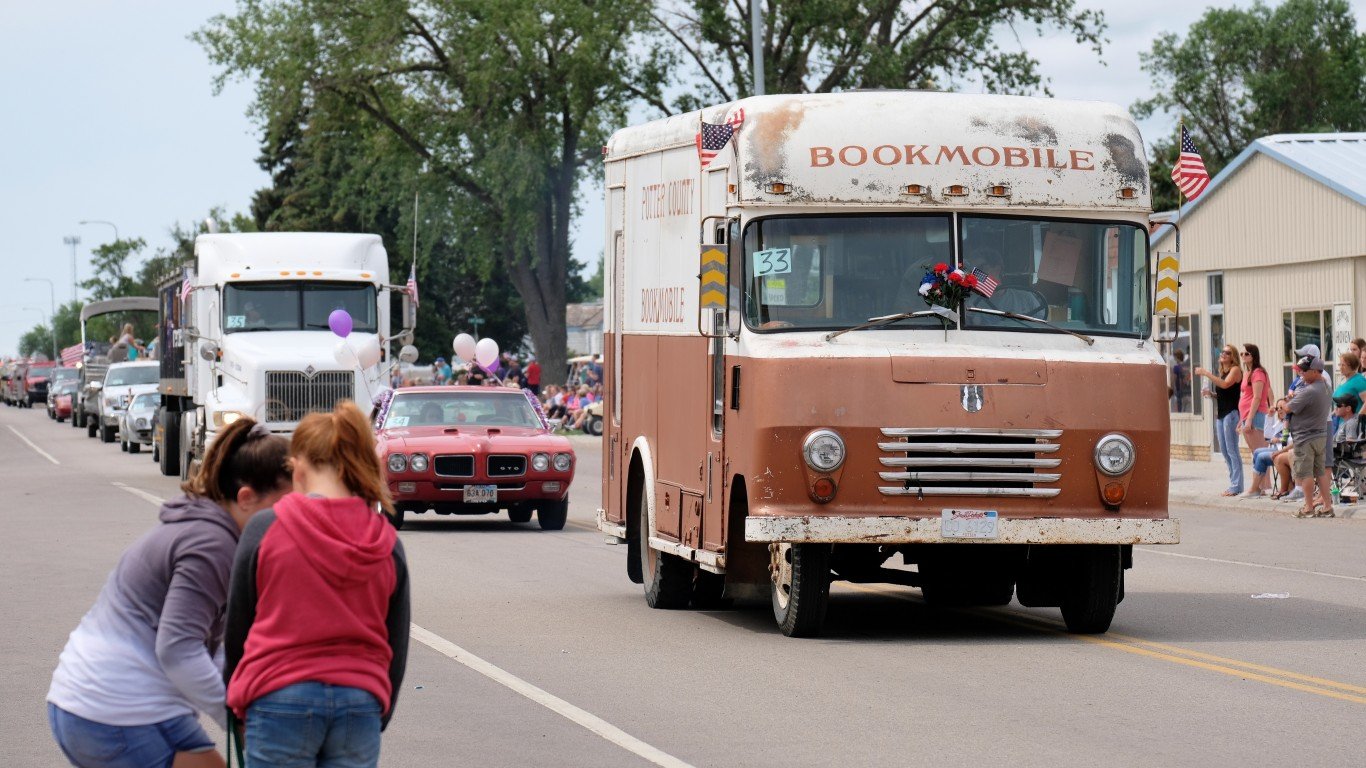
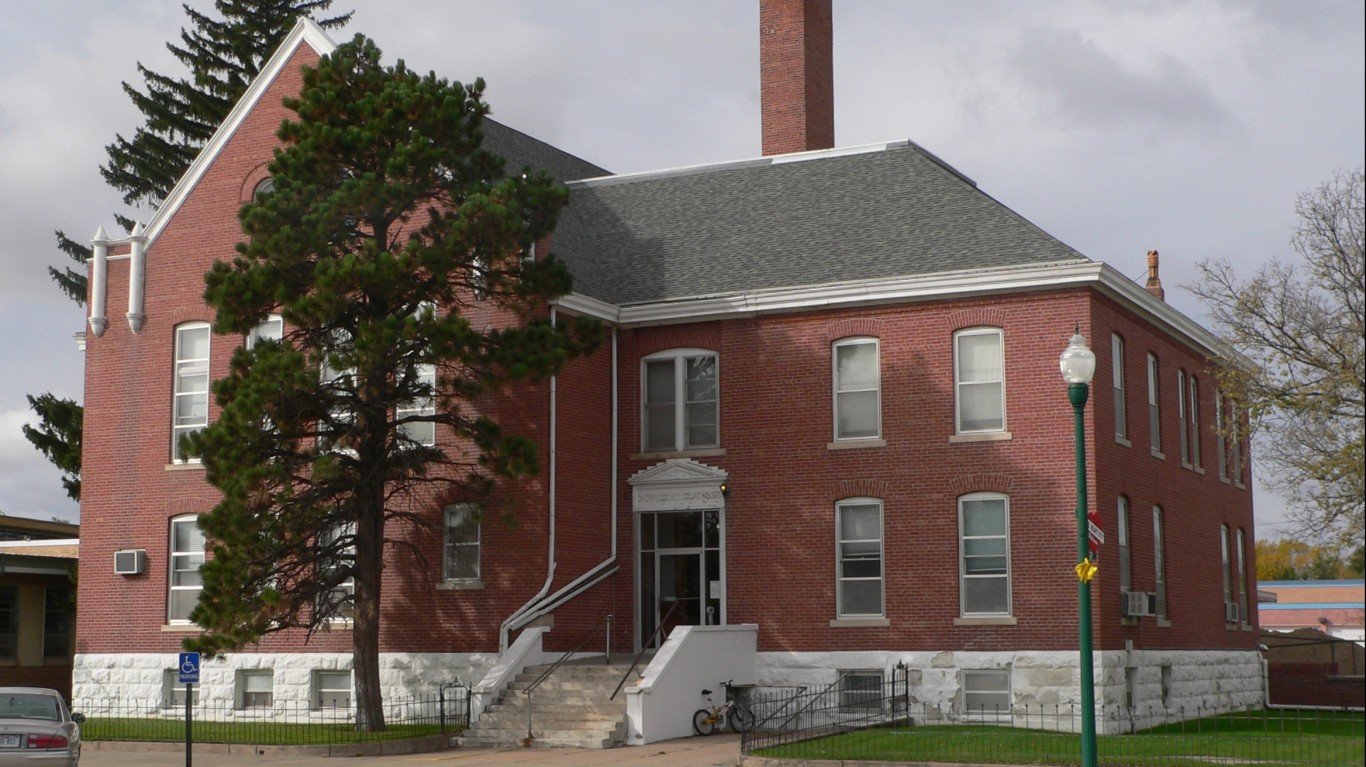
31. Potter County, South Dakota
> Avg. commute time (minutes): 12.3
> Share of commuters driving alone: 79.5% — 1,208th lowest of 2,997 counties
> Share of commuters carpooling: 7.2% — 570th lowest of 2,997 counties
> Share of commuters using public transit: 0.0% reported — the lowest of 2,997 counties (tied)

30. Baylor County, Texas
> Avg. commute time (minutes): 12.3
> Share of commuters driving alone: 85.2% — 421st highest of 2,997 counties
> Share of commuters carpooling: 6.3% — 278th lowest of 2,997 counties
> Share of commuters using public transit: 0.0% reported — the lowest of 2,997 counties (tied)
[in-text-ad]
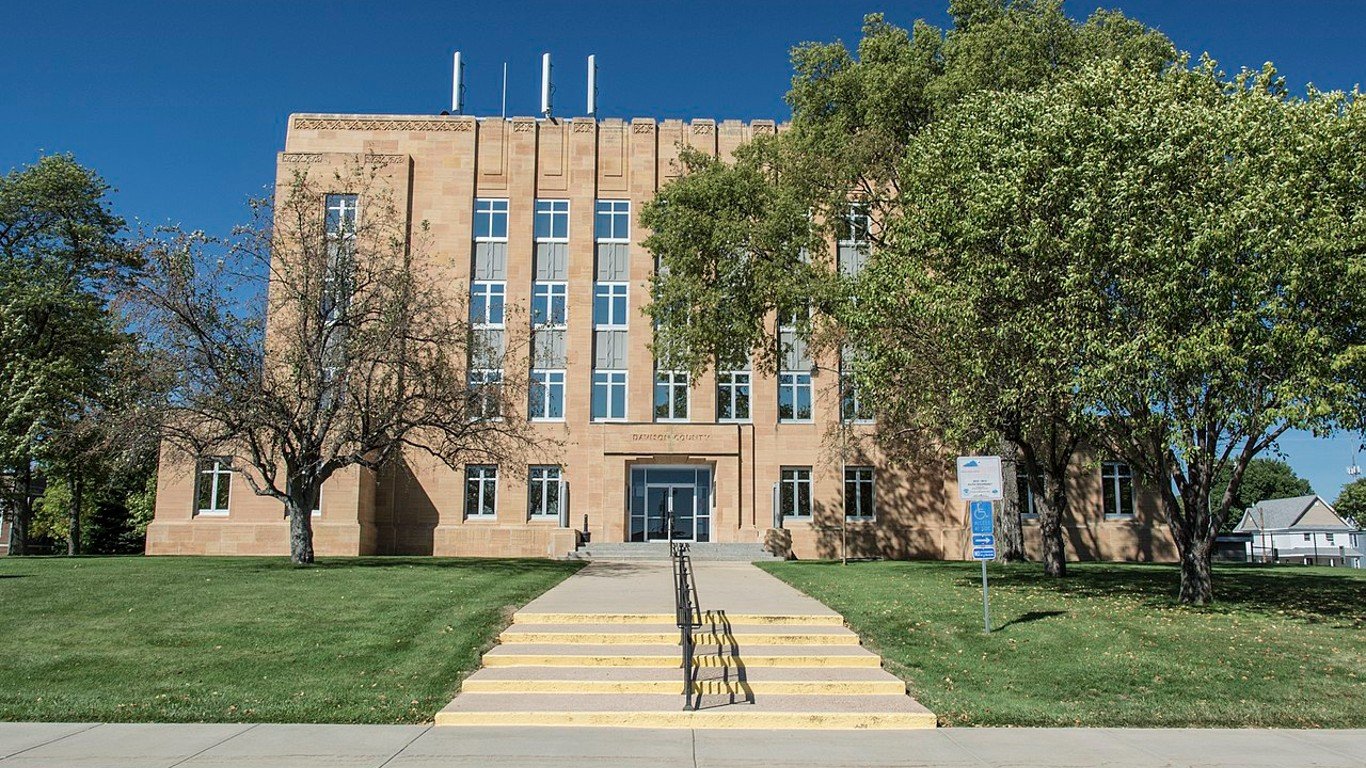
29. Davison County, South Dakota
> Avg. commute time (minutes): 12.2
> Share of commuters driving alone: 84.8% — 489th highest of 2,997 counties
> Share of commuters carpooling: 4.7% — 61st lowest of 2,997 counties
> Share of commuters using public transit: 1.4% — 361st highest of 2,997 counties
[recirclink id=1024519]
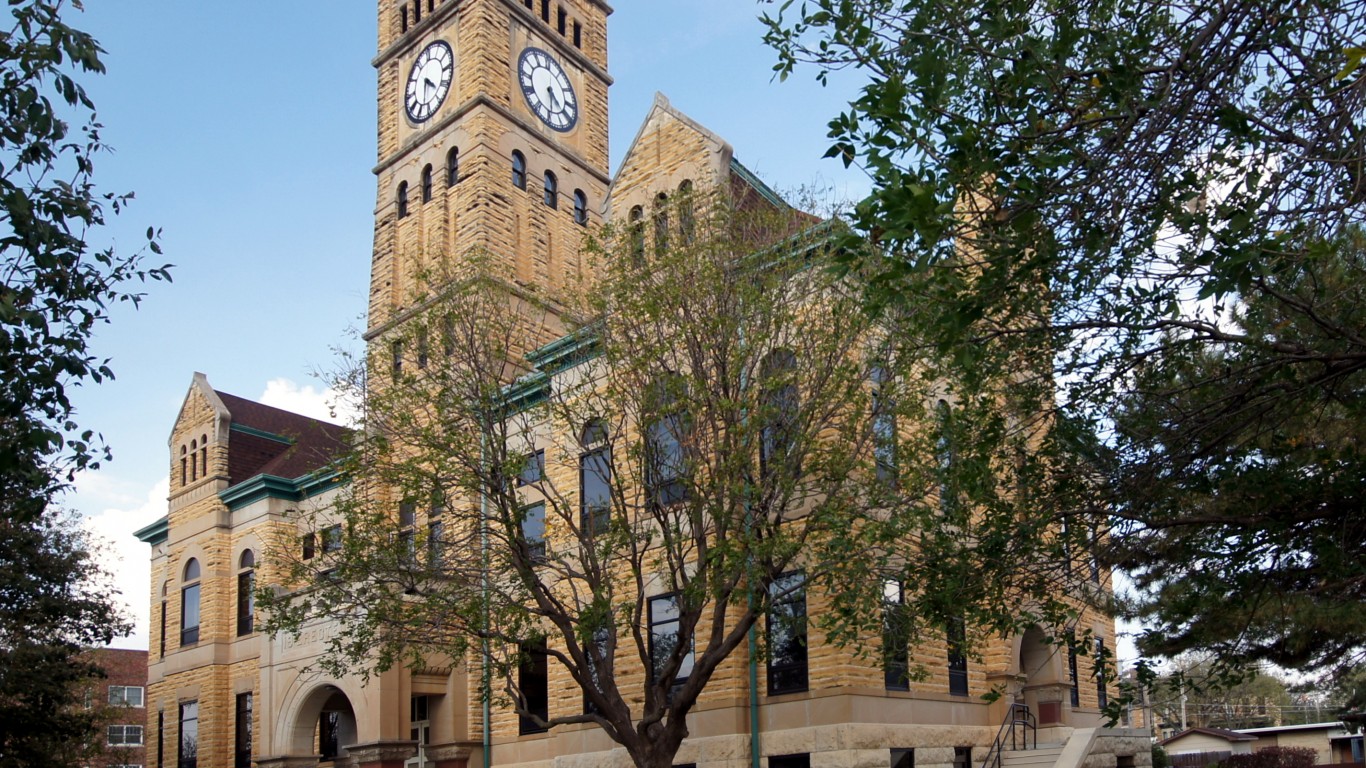
28. Ellis County, Kansas
> Avg. commute time (minutes): 12.1
> Share of commuters driving alone: 85.5% — 374th highest of 2,997 counties
> Share of commuters carpooling: 6.0% — 219th lowest of 2,997 counties
> Share of commuters using public transit: 0.1% — 694th lowest of 2,997 counties
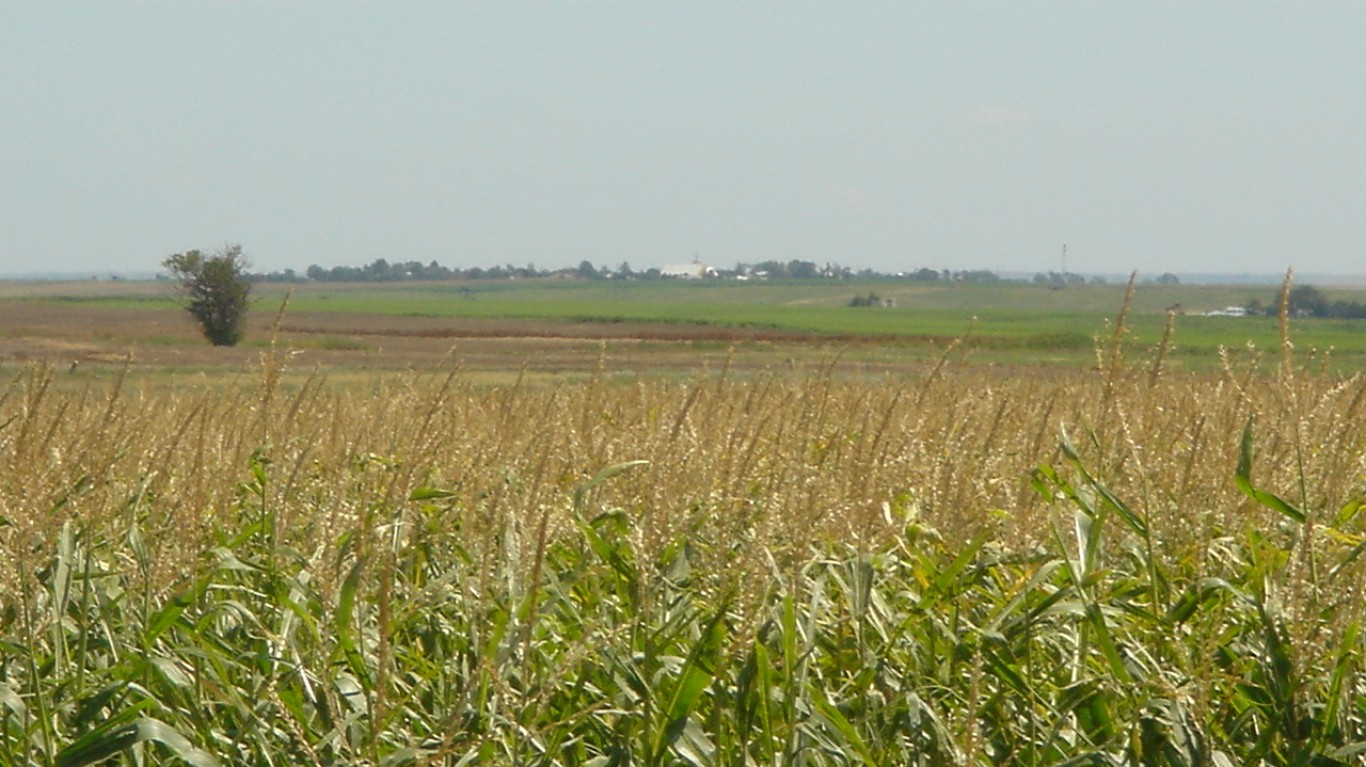
27. Chase County, Nebraska
> Avg. commute time (minutes): 12.0
> Share of commuters driving alone: 79.5% — 1,203rd lowest of 2,997 counties
> Share of commuters carpooling: 6.0% — 208th lowest of 2,997 counties
> Share of commuters using public transit: 0.4% — 1,103rd highest of 2,997 counties
[in-text-ad-2]

26. Hughes County, South Dakota
> Avg. commute time (minutes): 12.0
> Share of commuters driving alone: 78.4% — 970th lowest of 2,997 counties
> Share of commuters carpooling: 13.1% — 288th highest of 2,997 counties
> Share of commuters using public transit: 1.0% — 538th highest of 2,997 counties
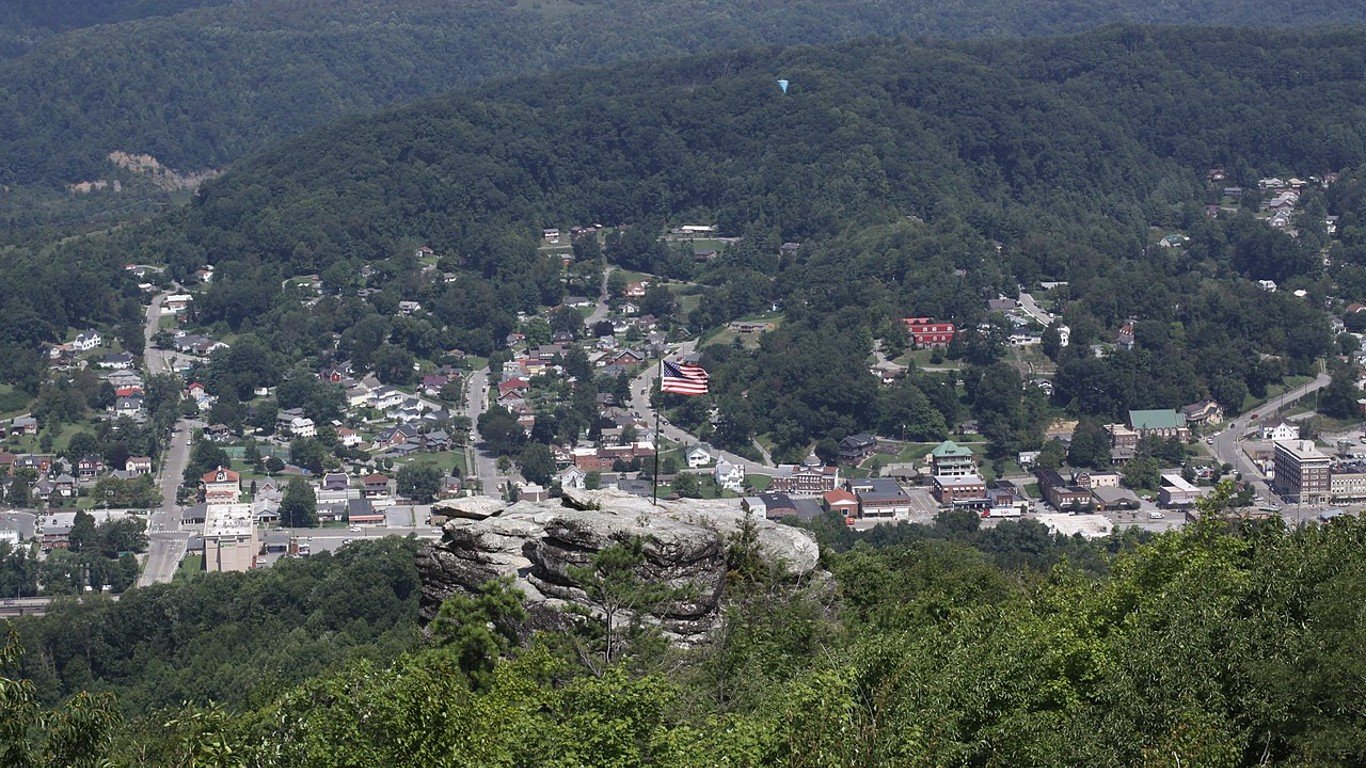
25. Norton city, Virginia
> Avg. commute time (minutes): 11.8
> Share of commuters driving alone: 79.4% — 1,196th lowest of 2,997 counties
> Share of commuters carpooling: 9.6% — 1,244th highest of 2,997 counties
> Share of commuters using public transit: 6.9% — 53rd highest of 2,997 counties
[in-text-ad]
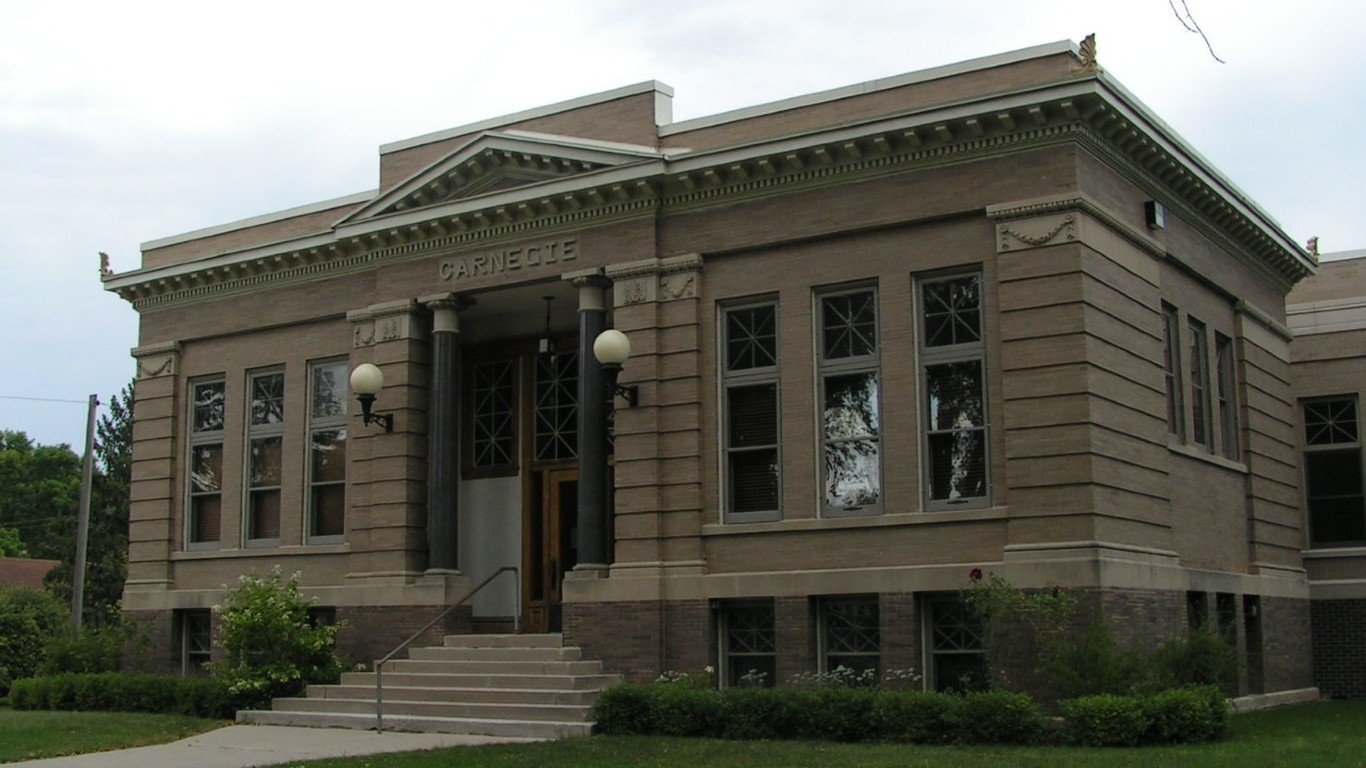
24. Stevens County, Minnesota
> Avg. commute time (minutes): 11.8
> Share of commuters driving alone: 74.0% — 388th lowest of 2,997 counties
> Share of commuters carpooling: 7.8% — 842nd lowest of 2,997 counties
> Share of commuters using public transit: 1.7% — 279th highest of 2,997 counties
[recirclink id=987778]
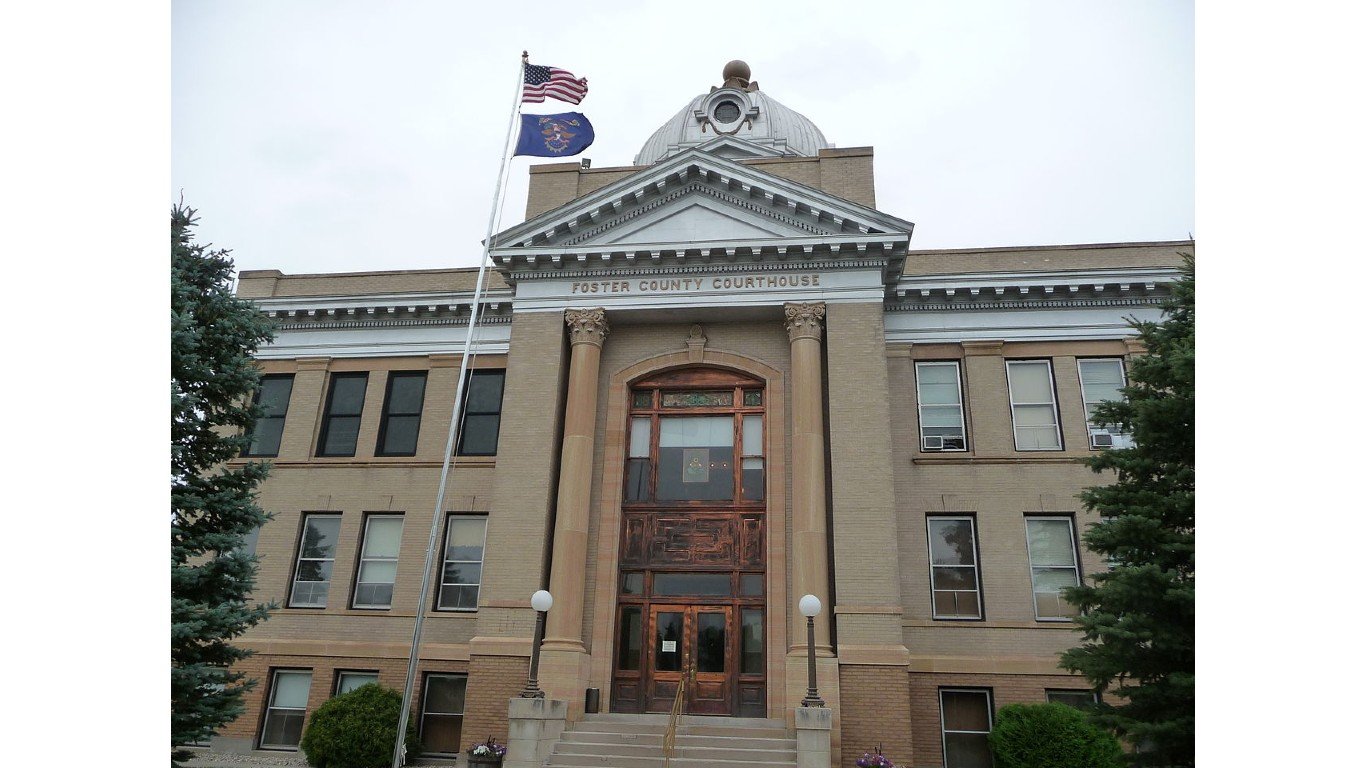
23. Foster County, North Dakota
> Avg. commute time (minutes): 11.7
> Share of commuters driving alone: 81.2% — 1,389th highest of 2,997 counties
> Share of commuters carpooling: 5.5% — 136th lowest of 2,997 counties
> Share of commuters using public transit: 0.3% — 1,470th highest of 2,997 counties
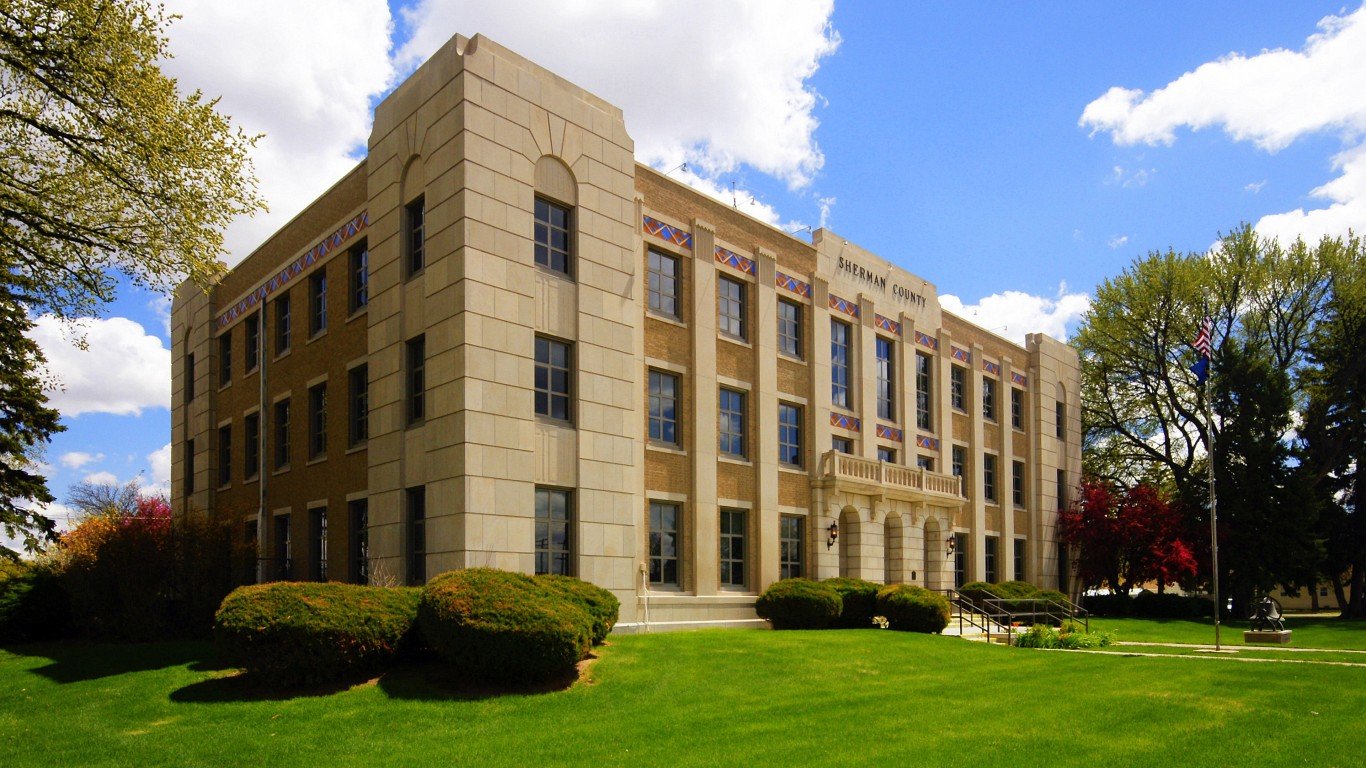
22. Sherman County, Kansas
> Avg. commute time (minutes): 11.5
> Share of commuters driving alone: 69.8% — 178th lowest of 2,997 counties
> Share of commuters carpooling: 6.9% — 460th lowest of 2,997 counties
> Share of commuters using public transit: 0.0% reported — the lowest of 2,997 counties (tied)
[in-text-ad-2]

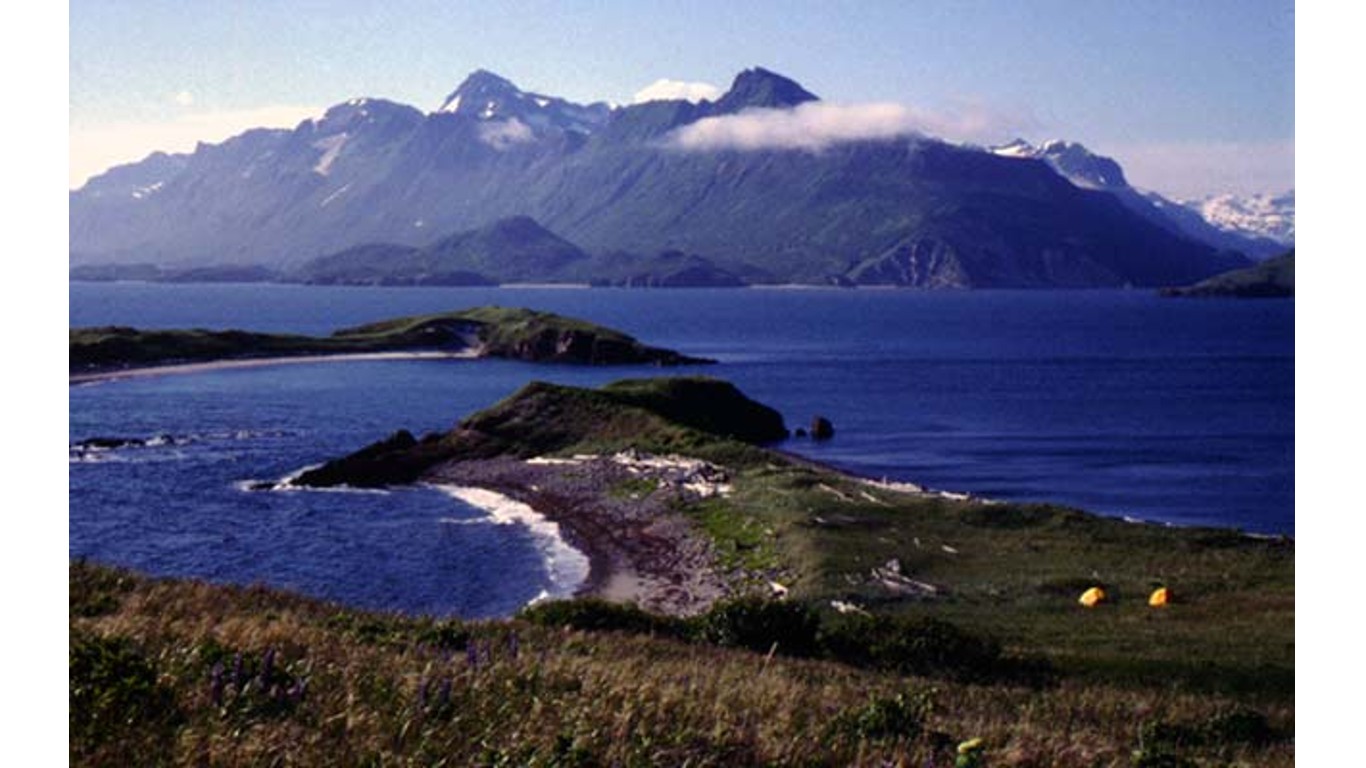
21. Kodiak Island Borough, Alaska
> Avg. commute time (minutes): 11.2
> Share of commuters driving alone: 58.7% — 40th lowest of 2,997 counties
> Share of commuters carpooling: 16.4% — 76th highest of 2,997 counties
> Share of commuters using public transit: 0.0% — 603rd lowest of 2,997 counties
20. Mitchell County, Kansas
> Avg. commute time (minutes): 11.2
> Share of commuters driving alone: 82.1% — 1,160th highest of 2,997 counties
> Share of commuters carpooling: 6.3% — 292nd lowest of 2,997 counties
> Share of commuters using public transit: 0.0% reported — the lowest of 2,997 counties (tied)
[in-text-ad]

19. Kane County, Utah
> Avg. commute time (minutes): 11.2
> Share of commuters driving alone: 72.4% — 278th lowest of 2,997 counties
> Share of commuters carpooling: 10.4% — 930th highest of 2,997 counties
> Share of commuters using public transit: 0.2% — 1,057th lowest of 2,997 counties
[recirclink id=1044820]

18. Graham County, Kansas
> Avg. commute time (minutes): 11.2
> Share of commuters driving alone: 78.0% — 880th lowest of 2,997 counties
> Share of commuters carpooling: 5.4% — 129th lowest of 2,997 counties
> Share of commuters using public transit: 0.1% — 819th lowest of 2,997 counties

17. Chattahoochee County, Georgia
> Avg. commute time (minutes): 11.1
> Share of commuters driving alone: 53.4% — 27th lowest of 2,997 counties
> Share of commuters carpooling: 11.7% — 527th highest of 2,997 counties
> Share of commuters using public transit: 0.9% — 554th highest of 2,997 counties
[in-text-ad-2]
16. McIntosh County, North Dakota
> Avg. commute time (minutes): 11.0
> Share of commuters driving alone: 75.8% — 551st lowest of 2,997 counties
> Share of commuters carpooling: 4.3% — 42nd lowest of 2,997 counties
> Share of commuters using public transit: 0.0% reported — the lowest of 2,997 counties (tied)

15. Chugach Census Area, Alaska
> Avg. commute time (minutes): 11.0
> Share of commuters driving alone: 68.9% — 147th lowest of 2,997 counties
> Share of commuters carpooling: 11.5% — 581st highest of 2,997 counties
> Share of commuters using public transit: 0.2% — 1,219th lowest of 2,997 counties
[in-text-ad]
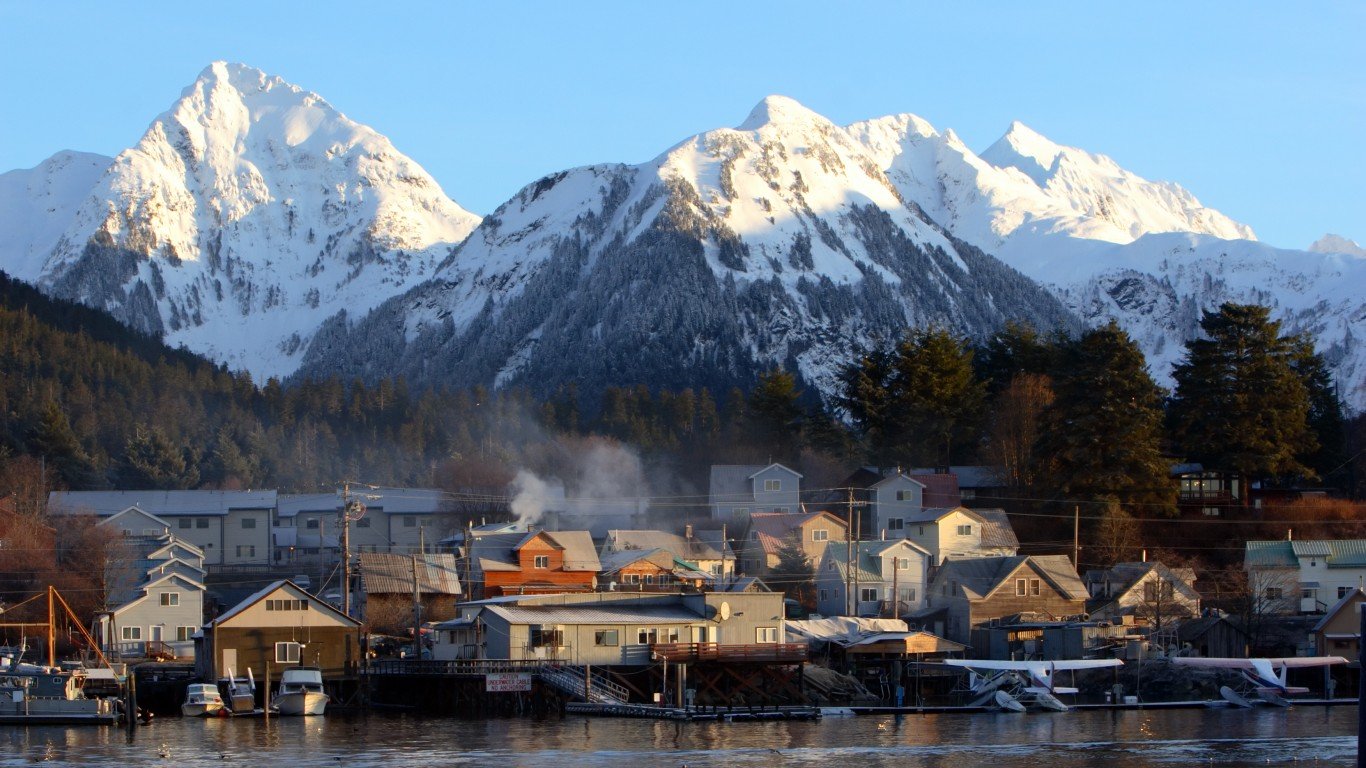
14. Sitka City and Borough, Alaska
> Avg. commute time (minutes): 11.0
> Share of commuters driving alone: 64.4% — 66th lowest of 2,997 counties
> Share of commuters carpooling: 10.0% — 1,055th highest of 2,997 counties
> Share of commuters using public transit: 0.7% — 713th highest of 2,997 counties
[recirclink id=1054986]
13. Brown County, Nebraska
> Avg. commute time (minutes): 10.8
> Share of commuters driving alone: 70.9% — 206th lowest of 2,997 counties
> Share of commuters carpooling: 10.8% — 774th highest of 2,997 counties
> Share of commuters using public transit: 0.0% reported — the lowest of 2,997 counties (tied)
12. Box Butte County, Nebraska
> Avg. commute time (minutes): 9.9
> Share of commuters driving alone: 78.8% — 1,058th lowest of 2,997 counties
> Share of commuters carpooling: 13.6% — 231st highest of 2,997 counties
> Share of commuters using public transit: 0.2% — 1,266th lowest of 2,997 counties
[in-text-ad-2]
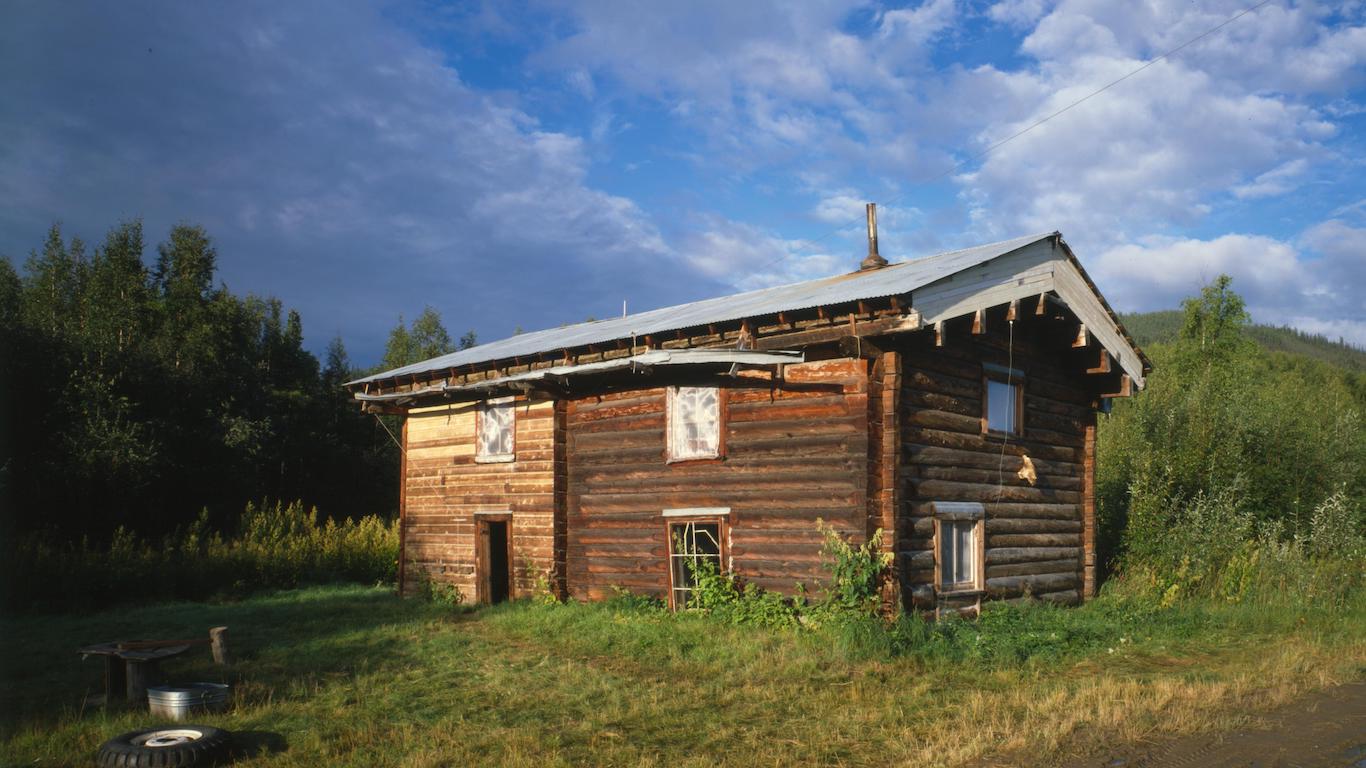
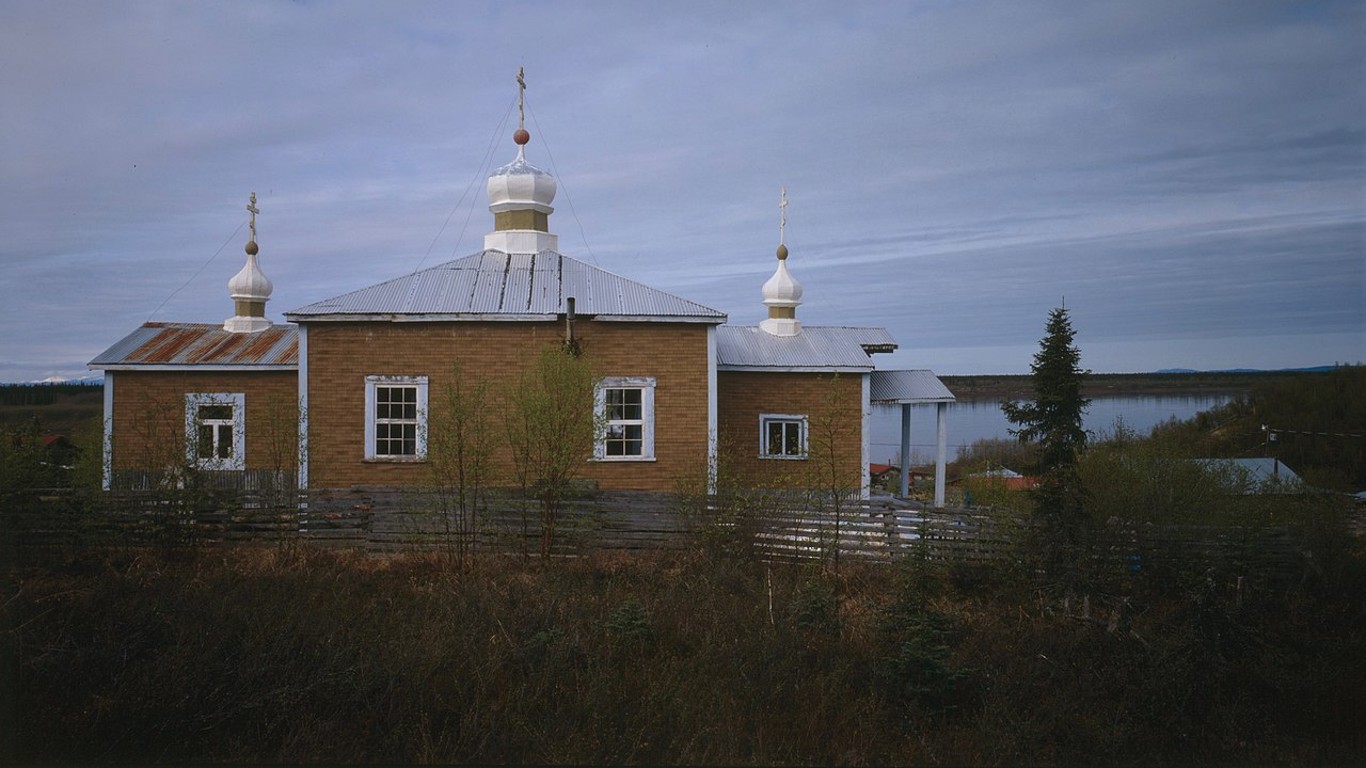
11. Yukon-Koyukuk Census Area, Alaska
> Avg. commute time (minutes): 9.1
> Share of commuters driving alone: 24.6% — 8th lowest of 2,997 counties
> Share of commuters carpooling: 8.5% — 1,222nd lowest of 2,997 counties
> Share of commuters using public transit: 0.5% — 1,062nd highest of 2,997 counties

10. Petersburg Borough, Alaska
> Avg. commute time (minutes): 8.9
> Share of commuters driving alone: 52.9% — 24th lowest of 2,997 counties
> Share of commuters carpooling: 11.3% — 636th highest of 2,997 counties
> Share of commuters using public transit: 0.5% — 991st highest of 2,997 counties
[in-text-ad]
9. Dillingham Census Area, Alaska
> Avg. commute time (minutes): 8.7
> Share of commuters driving alone: 29.8% — 11th lowest of 2,997 counties
> Share of commuters carpooling: 20.3% — 21st highest of 2,997 counties
> Share of commuters using public transit: 0.2% — 1,097th lowest of 2,997 counties
[recirclink id=1060122]

8. Kinney County, Texas
> Avg. commute time (minutes): 8.4
> Share of commuters driving alone: 78.3% — 929th lowest of 2,997 counties
> Share of commuters carpooling: 3.6% — 22nd lowest of 2,997 counties
> Share of commuters using public transit: 0.2% — 1,054th lowest of 2,997 counties (tied)
7. Bethel Census Area, Alaska
> Avg. commute time (minutes): 7.2
> Share of commuters driving alone: 24.0% — 6th lowest of 2,997 counties
> Share of commuters carpooling: 11.4% — 621st highest of 2,997 counties
> Share of commuters using public transit: 0.3% — 1,331st highest of 2,997 counties
[in-text-ad-2]
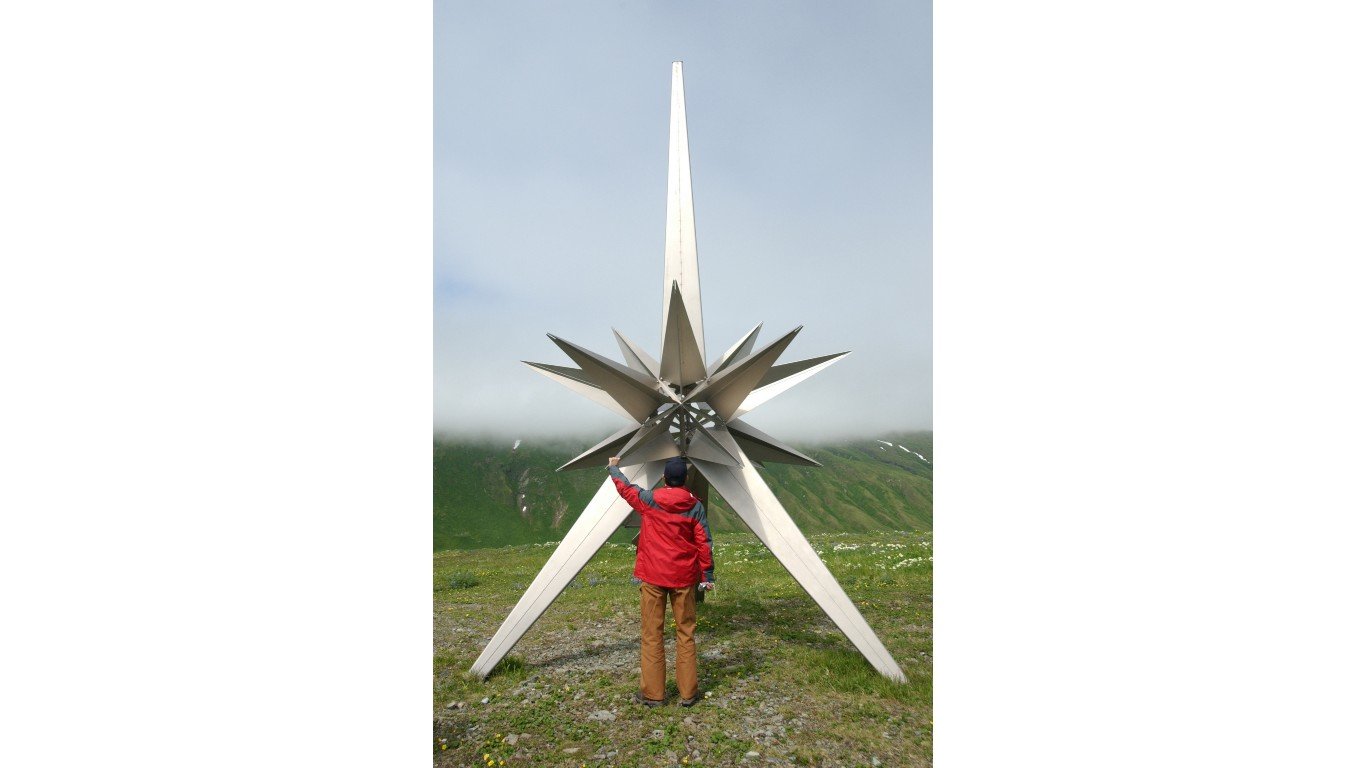
6. Aleutians West Census Area, Alaska
> Avg. commute time (minutes): 7.2
> Share of commuters driving alone: 49.2% — 19th lowest of 2,997 counties
> Share of commuters carpooling: 12.4% — 371st highest of 2,997 counties
> Share of commuters using public transit: 0.6% — 834th highest of 2,997 counties

5. Kusilvak Census Area, Alaska
> Avg. commute time (minutes): 7.0
> Share of commuters driving alone: 4.9% — the lowest of 2,997 counties
> Share of commuters carpooling: 3.5% — 18th lowest of 2,997 counties
> Share of commuters using public transit: 0.1% — 838th lowest of 2,997 counties
[in-text-ad]
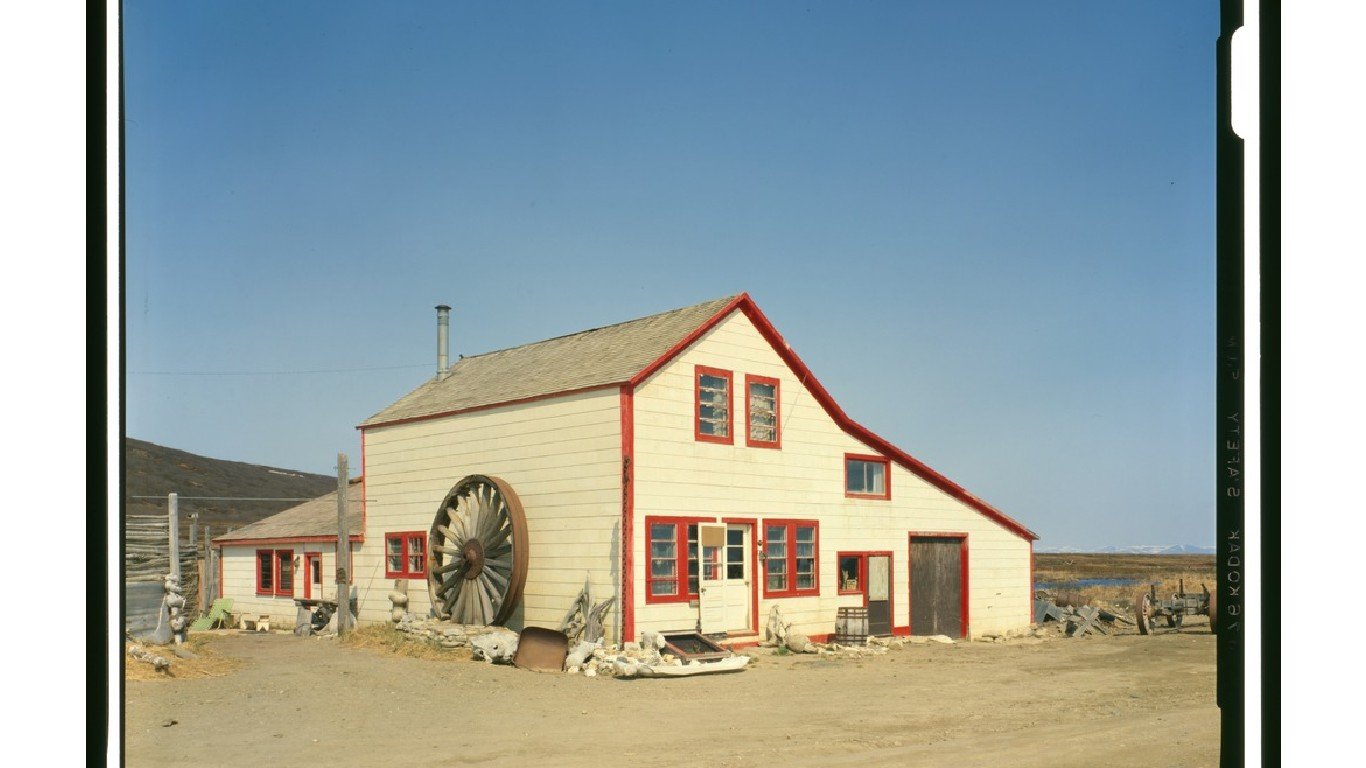
4. Nome Census Area, Alaska
> Avg. commute time (minutes): 6.2
> Share of commuters driving alone: 25.4% — 9th lowest of 2,997 counties
> Share of commuters carpooling: 10.9% — 760th highest of 2,997 counties
> Share of commuters using public transit: 0.2% — 1,220th lowest of 2,997 counties
[recirclink id=1024519]
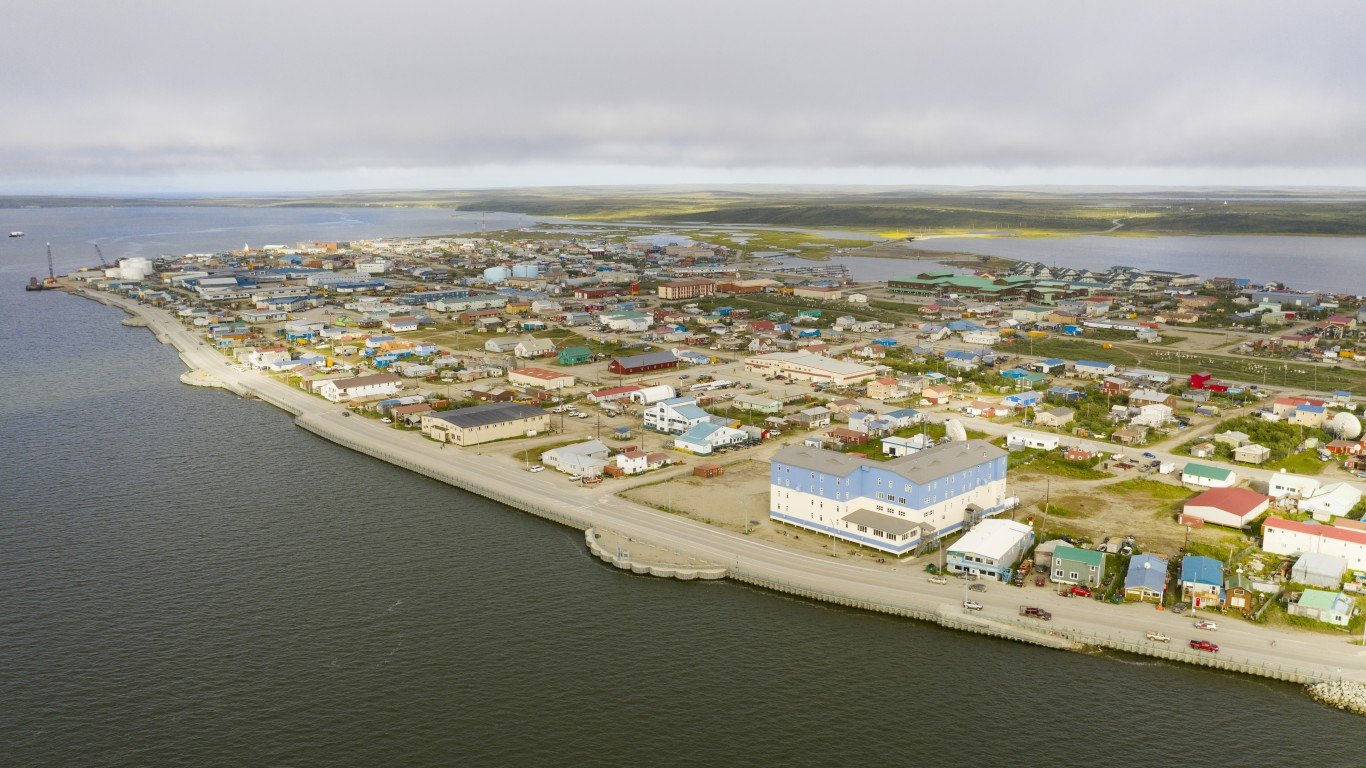
3. North Slope Borough, Alaska
> Avg. commute time (minutes): 6.0
> Share of commuters driving alone: 18.5% — 5th lowest of 2,997 counties
> Share of commuters carpooling: 15.9% — 92nd highest of 2,997 counties
> Share of commuters using public transit: 1.1% — 482nd highest of 2,997 counties
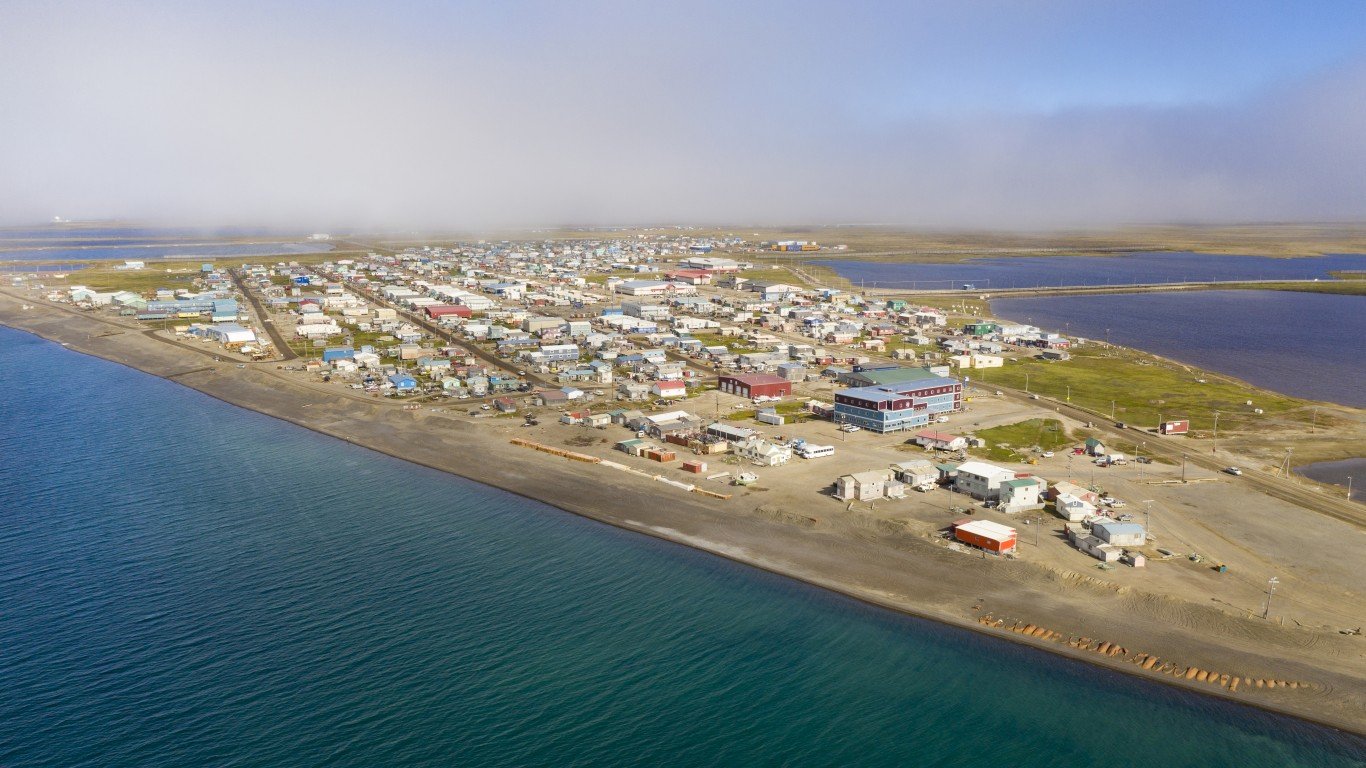
2. Northwest Arctic Borough, Alaska
> Avg. commute time (minutes): 5.8
> Share of commuters driving alone: 17.2% — 3rd lowest of 2,997 counties
> Share of commuters carpooling: 11.3% — 630th highest of 2,997 counties
> Share of commuters using public transit: 1.2% — 423rd highest of 2,997 counties
[in-text-ad-2]

1. Aleutians East Borough, Alaska
> Avg. commute time (minutes): 5.2
> Share of commuters driving alone: 26.4% — 10th lowest of 2,997 counties
> Share of commuters carpooling: 6.5% — 345th lowest of 2,997 counties
> Share of commuters using public transit: 0.1% — 989th lowest of 2,997 counties
Methodology
To determine the counties and county equivalents with the shortest commutes, 24/7 Wall St. reviewed five-year estimates of average commute times from the U.S. Census Bureau’s 2020 American Community Survey.
Counties were ranked based on their average commute time. To break ties, we used the share of workers with a commute of 15 minutes or less.
Counties were excluded if average commute time estimates were not available in the 2020 ACS, if there were fewer than 1,000 workers 16 years and over who did not work from home, or if the sampling error associated with a county’s data was deemed too high.
The sampling error was defined as too high if the coefficient of variation — a statistical assessment of how reliable an estimate is — for a county’s average commute time was above 15% and greater than two standard deviations above the mean CV for all counties’ average commute times. We similarly excluded counties that had a sampling error too high for their population, using the same definition.
Additional information on the share of commuters driving alone, carpooling, and using public transit are also five-year estimates from the 2020 ACS.
Contact [email protected] for any questions or corrections.