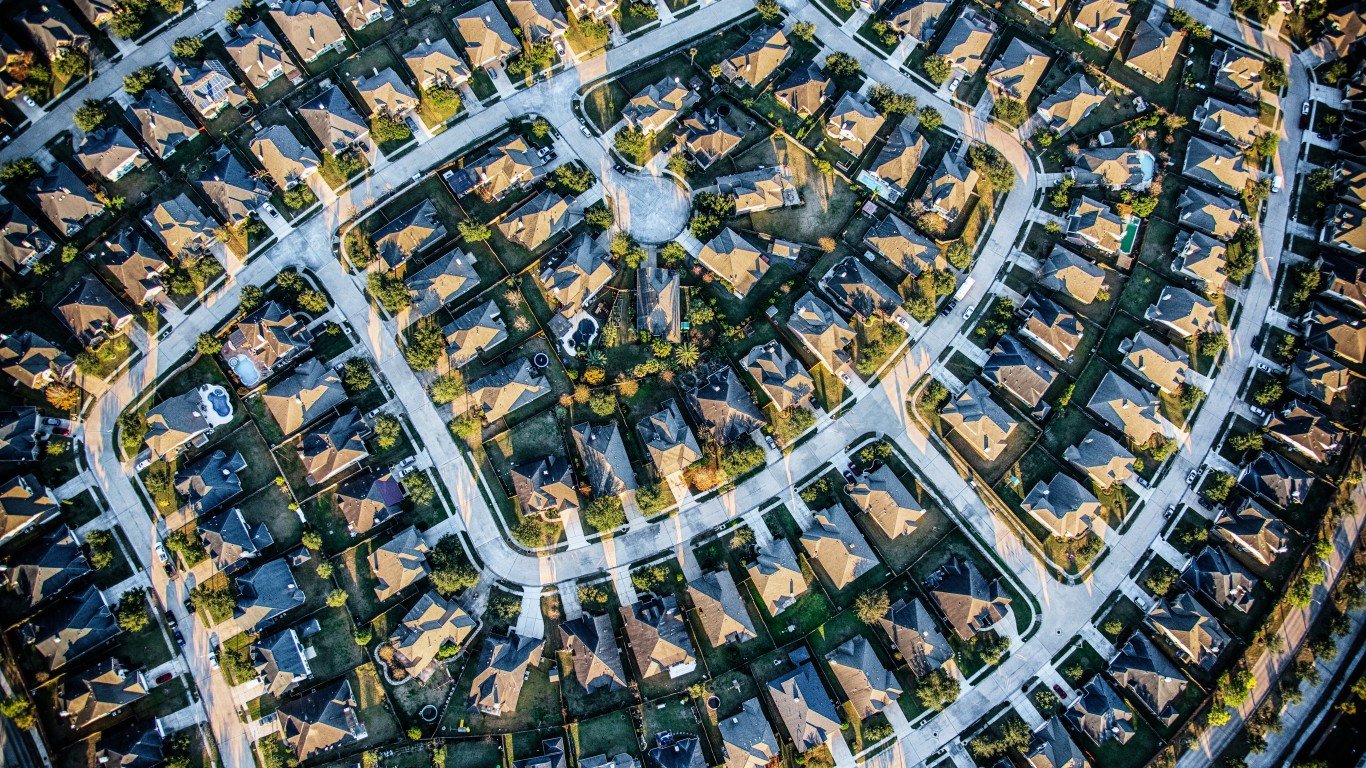
The American housing market took off during the early months of the COVID-19 pandemic. The homeownership rate – or the share of housing units occupied by their owner – jumped by 2.6 percentage points from the first quarter to the second quarter of 2020, by far the largest increase ever recorded. By the end of 2020, there were 2.1 million more homeowners in the United States than there were a year earlier.
The surge in home sales was fueled by several factors, including historically low mortgage rates, and, as some experts speculate, the pandemic, which led many Americans to re-evaluate where and how they live. Here is a look at the mortgage rate in America every year since 1972.
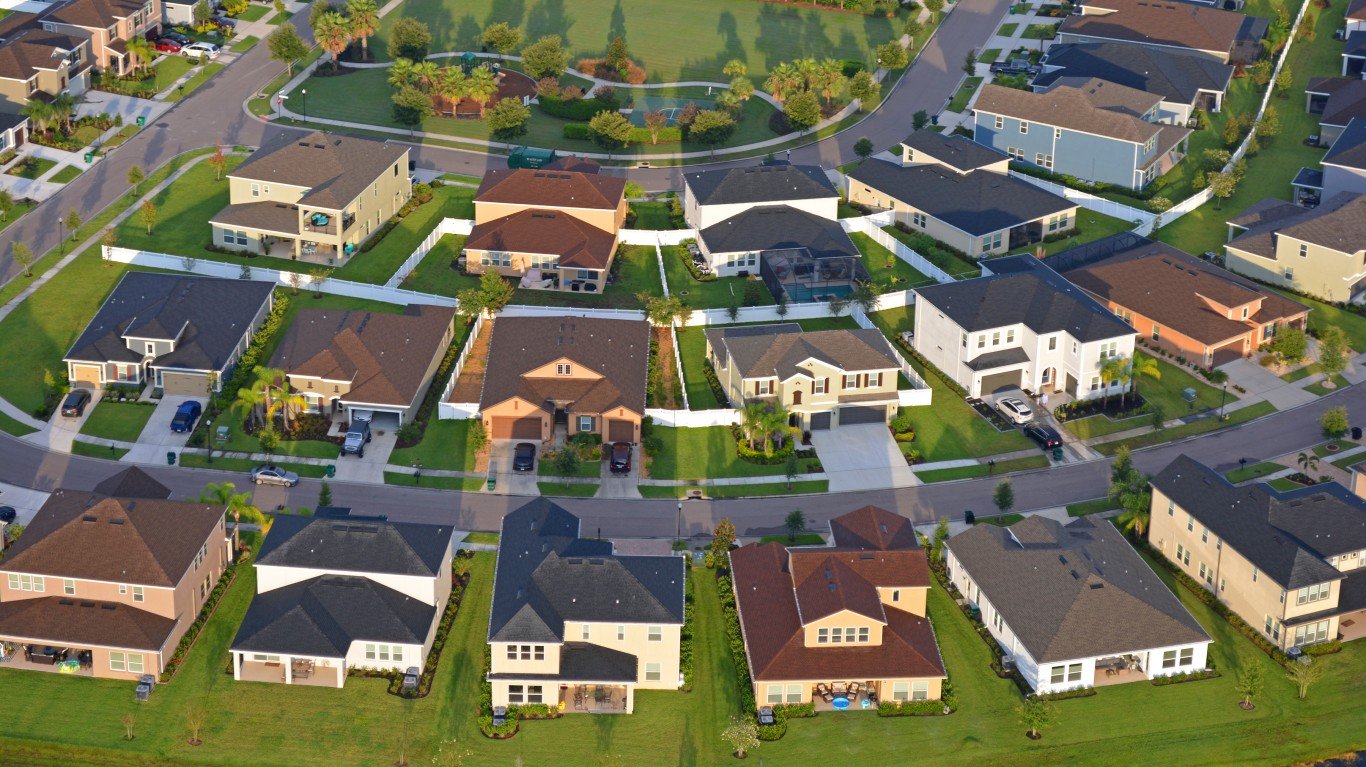
Nationwide, the homeownership rate stands at 64.4%, according to the latest American Community Survey data from the U.S. Census Bureau. This rate varies substantially across the country, however, from state to state, and county to county.
Using census data, 24/7 Wall St. identified the county in every state with the highest homeownership rate. Counties and county equivalents are ranked by the share of housing units occupied by their owners.
Among the counties on this list, homeownership rates range from 69.3% to 96.5% and are anywhere from 7.6 percentage points to 39.4 percentage points higher than the corresponding state homeownership rate.
In most counties on this list, the median home value is lower than the value of the typical home across the state as a whole, making homeownership more affordable for larger shares of the population. In most of the places that do not fit this pattern, high housing costs are offset by high incomes. Most of the counties and county equivalents on this list that have higher than average home values also have a higher median household income than the state as a whole. Here is a look at the 20 cities where the middle class can no longer afford housing.
Click here to see the county with the highest homeownership rate in each state
Click here to read our detailed methodology
Alabama: Washington County
> Homeownership rate: 89.5% (Alabama: 69.2%)
> Median home value: $88,100 (Alabama: $149,600)
> Median monthly housing costs (w/ a mortgage): $1,135 (Alabama: $1,196)
> Median monthly housing costs (no mortgage): $338 (Alabama: $367)
> Median household income: $42,331 (Alabama: $52,035)
> No. of counties considered in ranking: 67
[in-text-ad]

Alaska: Denali Borough
> Homeownership rate: 82.9% (Alaska: 64.8%)
> Median home value: $233,700 (Alaska: $275,600)
> Median monthly housing costs (w/ a mortgage): $1,629 (Alaska: $1,937)
> Median monthly housing costs (no mortgage): $404 (Alaska: $591)
> Median household income: $76,364 (Alaska: $77,790)
> No. of counties considered in ranking: 26
[recirclink id=1081420]

Arizona: Apache County
> Homeownership rate: 79.7% (Arizona: 65.3%)
> Median home value: $61,800 (Arizona: $242,000)
> Median monthly housing costs (w/ a mortgage): $972 (Arizona: $1,464)
> Median monthly housing costs (no mortgage): $187 (Arizona: $430)
> Median household income: $33,967 (Arizona: $61,529)
> No. of counties considered in ranking: 15
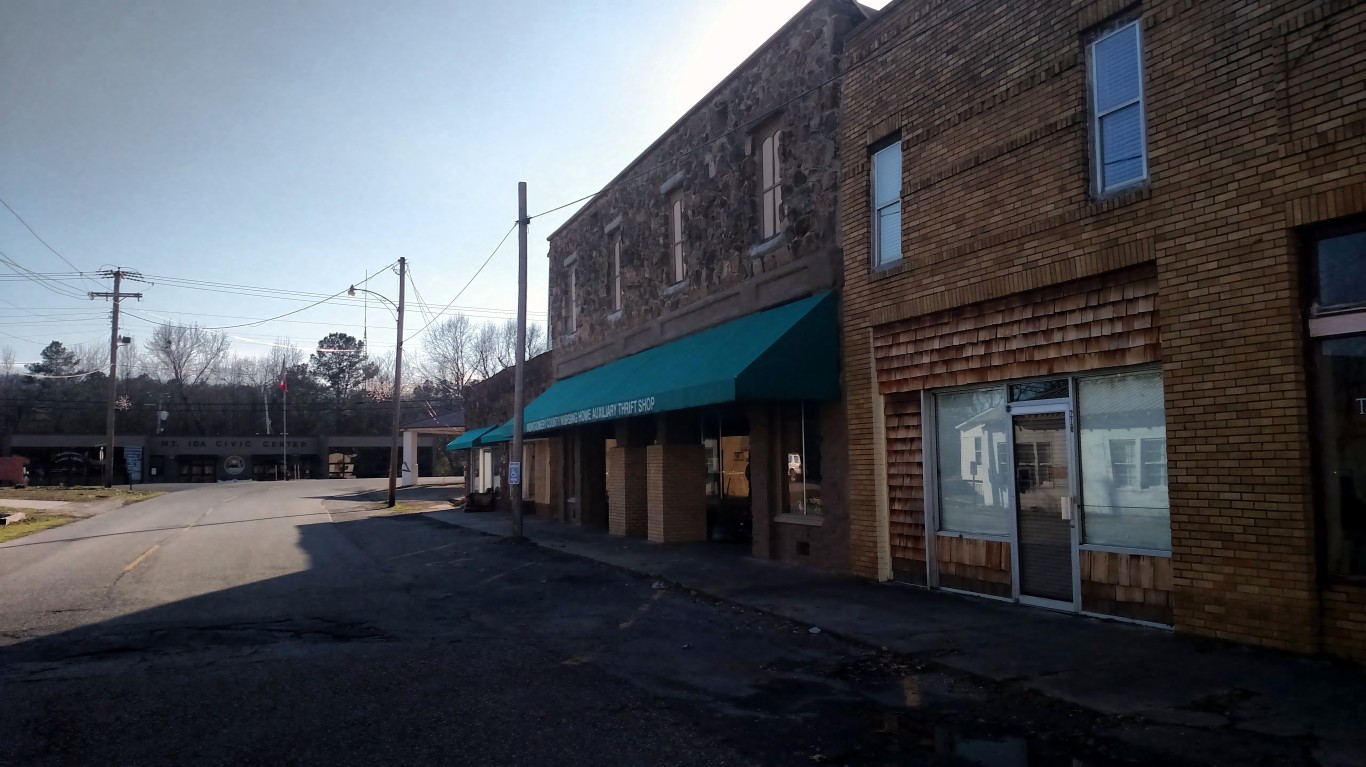
Arkansas: Montgomery County
> Homeownership rate: 84.2% (Arkansas: 65.8%)
> Median home value: $111,600 (Arkansas: $133,600)
> Median monthly housing costs (w/ a mortgage): $1,026 (Arkansas: $1,103)
> Median monthly housing costs (no mortgage): $276 (Arkansas: $353)
> Median household income: $41,165 (Arkansas: $49,475)
> No. of counties considered in ranking: 75
[in-text-ad-2]

California: Alpine County
> Homeownership rate: 80.9% (California: 55.3%)
> Median home value: $372,500 (California: $538,500)
> Median monthly housing costs (w/ a mortgage): $1,913 (California: $2,422)
> Median monthly housing costs (no mortgage): $509 (California: $618)
> Median household income: $85,750 (California: $78,672)
> No. of counties considered in ranking: 58
Colorado: Elbert County
> Homeownership rate: 91.3% (Colorado: 66.2%)
> Median home value: $492,300 (Colorado: $369,900)
> Median monthly housing costs (w/ a mortgage): $2,226 (Colorado: $1,808)
> Median monthly housing costs (no mortgage): $578 (Colorado: $488)
> Median household income: $104,231 (Colorado: $75,231)
> No. of counties considered in ranking: 60
[in-text-ad]

Connecticut: Litchfield County
> Homeownership rate: 76.1% (Connecticut: 66.1%)
> Median home value: $258,300 (Connecticut: $279,700)
> Median monthly housing costs (w/ a mortgage): $1,941 (Connecticut: $2,127)
> Median monthly housing costs (no mortgage): $835 (Connecticut: $900)
> Median household income: $81,590 (Connecticut: $79,855)
> No. of counties considered in ranking: 8
[recirclink id=1082534]
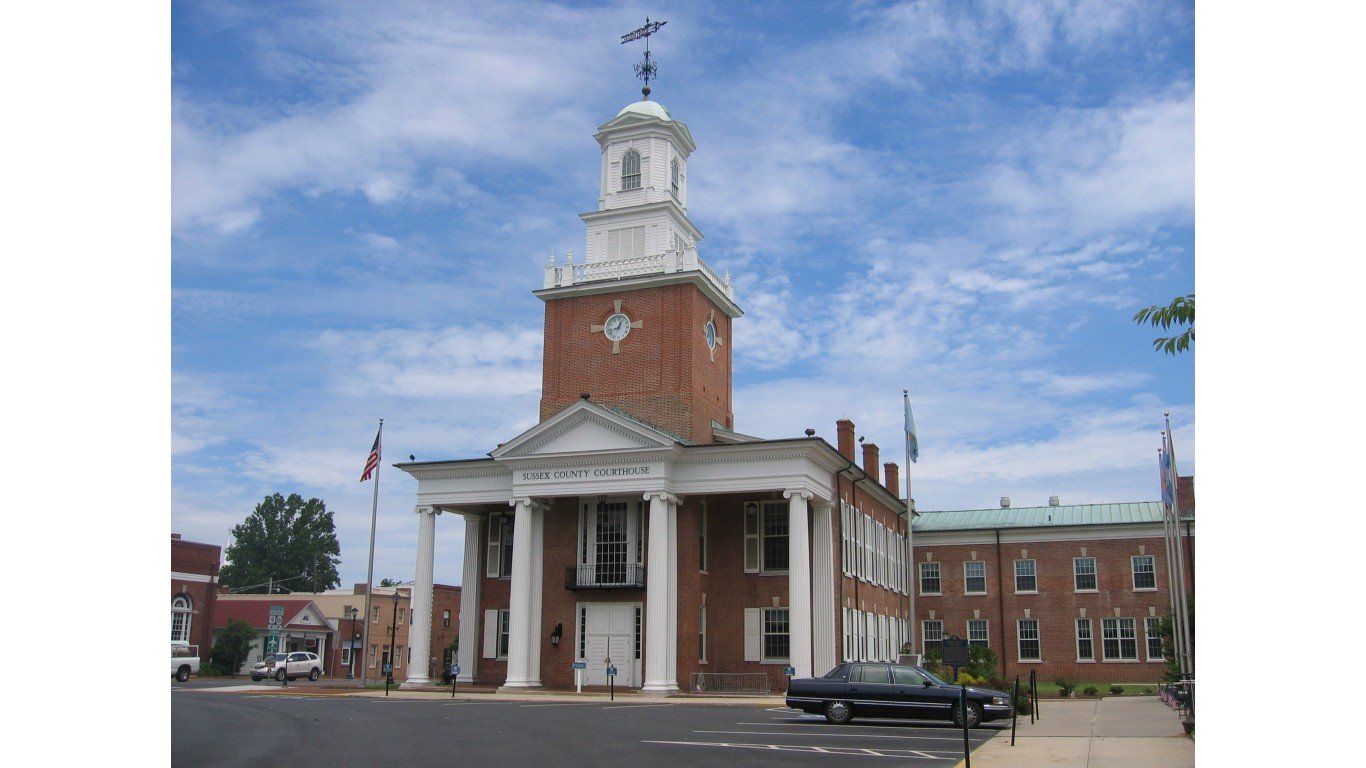
Delaware: Sussex County
> Homeownership rate: 81.1% (Delaware: 71.4%)
> Median home value: $269,700 (Delaware: $258,300)
> Median monthly housing costs (w/ a mortgage): $1,479 (Delaware: $1,591)
> Median monthly housing costs (no mortgage): $465 (Delaware: $475)
> Median household income: $64,905 (Delaware: $69,110)
> No. of counties considered in ranking: 3

Florida: Sumter County
> Homeownership rate: 88.6% (Florida: 66.2%)
> Median home value: $267,100 (Florida: $232,000)
> Median monthly housing costs (w/ a mortgage): $1,328 (Florida: $1,539)
> Median monthly housing costs (no mortgage): $471 (Florida: $513)
> Median household income: $59,618 (Florida: $57,703)
> No. of counties considered in ranking: 67
[in-text-ad-2]

Georgia: Harris County
> Homeownership rate: 89.3% (Georgia: 64.0%)
> Median home value: $230,400 (Georgia: $190,200)
> Median monthly housing costs (w/ a mortgage): $1,719 (Georgia: $1,449)
> Median monthly housing costs (no mortgage): $485 (Georgia: $435)
> Median household income: $79,860 (Georgia: $61,224)
> No. of counties considered in ranking: 159

Hawaii: Hawaii County
> Homeownership rate: 69.3% (Hawaii: 60.3%)
> Median home value: $364,100 (Hawaii: $636,400)
> Median monthly housing costs (w/ a mortgage): $1,723 (Hawaii: $2,443)
> Median monthly housing costs (no mortgage): $339 (Hawaii: $540)
> Median household income: $65,401 (Hawaii: $83,173)
> No. of counties considered in ranking: 4
[in-text-ad]

Idaho: Franklin County
> Homeownership rate: 83.8% (Idaho: 70.8%)
> Median home value: $222,200 (Idaho: $235,600)
> Median monthly housing costs (w/ a mortgage): $1,314 (Idaho: $1,312)
> Median monthly housing costs (no mortgage): $382 (Idaho: $388)
> Median household income: $59,934 (Idaho: $58,915)
> No. of counties considered in ranking: 42
[recirclink id=1083492]
Illinois: Calhoun County
> Homeownership rate: 88.7% (Illinois: 66.3%)
> Median home value: $131,800 (Illinois: $202,100)
> Median monthly housing costs (w/ a mortgage): $1,324 (Illinois: $1,709)
> Median monthly housing costs (no mortgage): $550 (Illinois: $650)
> Median household income: $66,602 (Illinois: $68,428)
> No. of counties considered in ranking: 102

Indiana: Brown County
> Homeownership rate: 85.4% (Indiana: 69.5%)
> Median home value: $206,600 (Indiana: $148,900)
> Median monthly housing costs (w/ a mortgage): $1,222 (Indiana: $1,155)
> Median monthly housing costs (no mortgage): $464 (Indiana: $416)
> Median household income: $66,833 (Indiana: $58,235)
> No. of counties considered in ranking: 92
[in-text-ad-2]
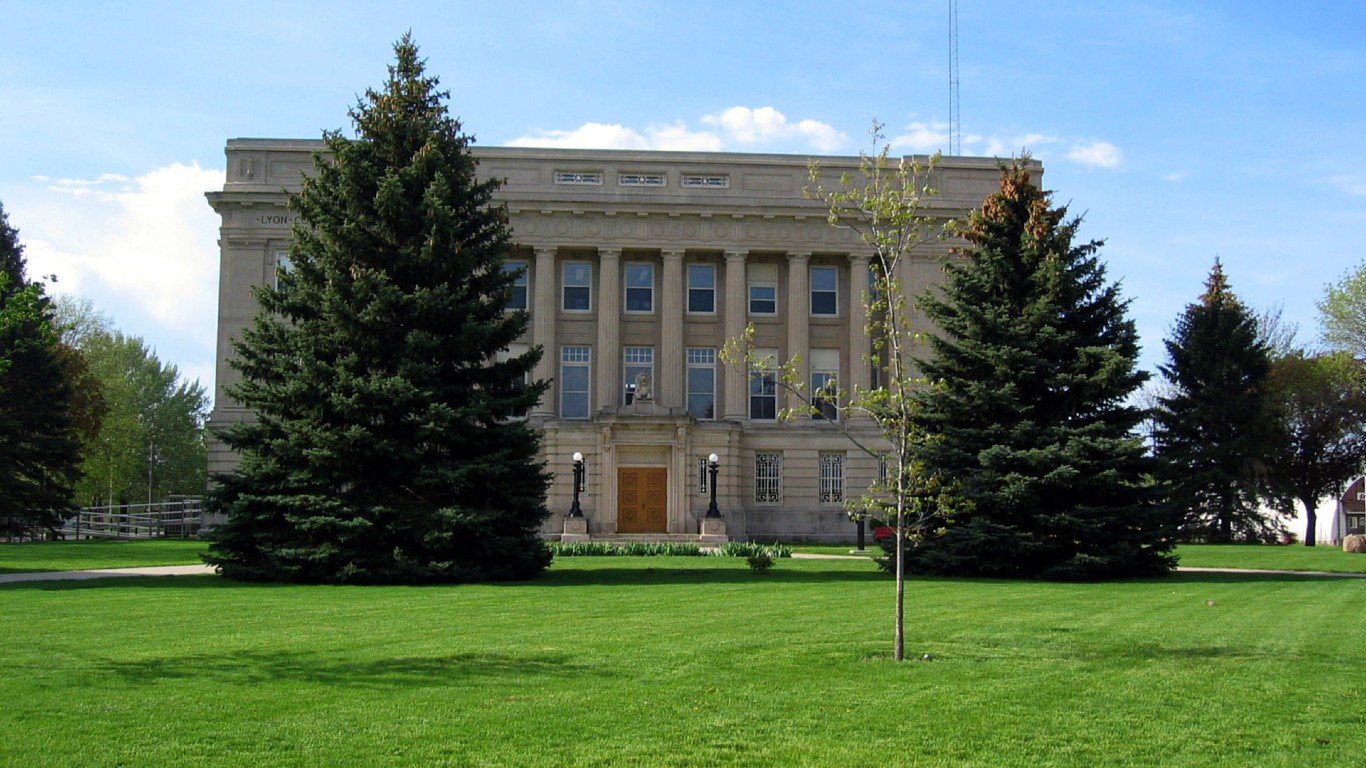
Iowa: Lyon County
> Homeownership rate: 85.4% (Iowa: 71.2%)
> Median home value: $160,700 (Iowa: $153,900)
> Median monthly housing costs (w/ a mortgage): $1,176 (Iowa: $1,279)
> Median monthly housing costs (no mortgage): $456 (Iowa: $495)
> Median household income: $65,959 (Iowa: $61,836)
> No. of counties considered in ranking: 99

Kansas: Jefferson County
> Homeownership rate: 85.5% (Kansas: 66.2%)
> Median home value: $163,400 (Kansas: $157,600)
> Median monthly housing costs (w/ a mortgage): $1,398 (Kansas: $1,400)
> Median monthly housing costs (no mortgage): $542 (Kansas: $517)
> Median household income: $67,429 (Kansas: $61,091)
> No. of counties considered in ranking: 101
[in-text-ad]

Kentucky: Spencer County
> Homeownership rate: 86.9% (Kentucky: 67.6%)
> Median home value: $227,000 (Kentucky: $147,100)
> Median monthly housing costs (w/ a mortgage): $1,383 (Kentucky: $1,191)
> Median monthly housing costs (no mortgage): $429 (Kentucky: $379)
> Median household income: $85,488 (Kentucky: $52,238)
> No. of counties considered in ranking: 120
[recirclink id=1090849]

Louisiana: Cameron Parish
> Homeownership rate: 88.5% (Louisiana: 66.6%)
> Median home value: $124,300 (Louisiana: $168,100)
> Median monthly housing costs (w/ a mortgage): $1,166 (Louisiana: $1,310)
> Median monthly housing costs (no mortgage): $309 (Louisiana: $344)
> Median household income: $56,902 (Louisiana: $50,800)
> No. of counties considered in ranking: 64

Maine: Oxford County
> Homeownership rate: 80.5% (Maine: 72.9%)
> Median home value: $150,700 (Maine: $198,000)
> Median monthly housing costs (w/ a mortgage): $1,154 (Maine: $1,404)
> Median monthly housing costs (no mortgage): $443 (Maine: $500)
> Median household income: $49,761 (Maine: $59,489)
> No. of counties considered in ranking: 16
[in-text-ad-2]
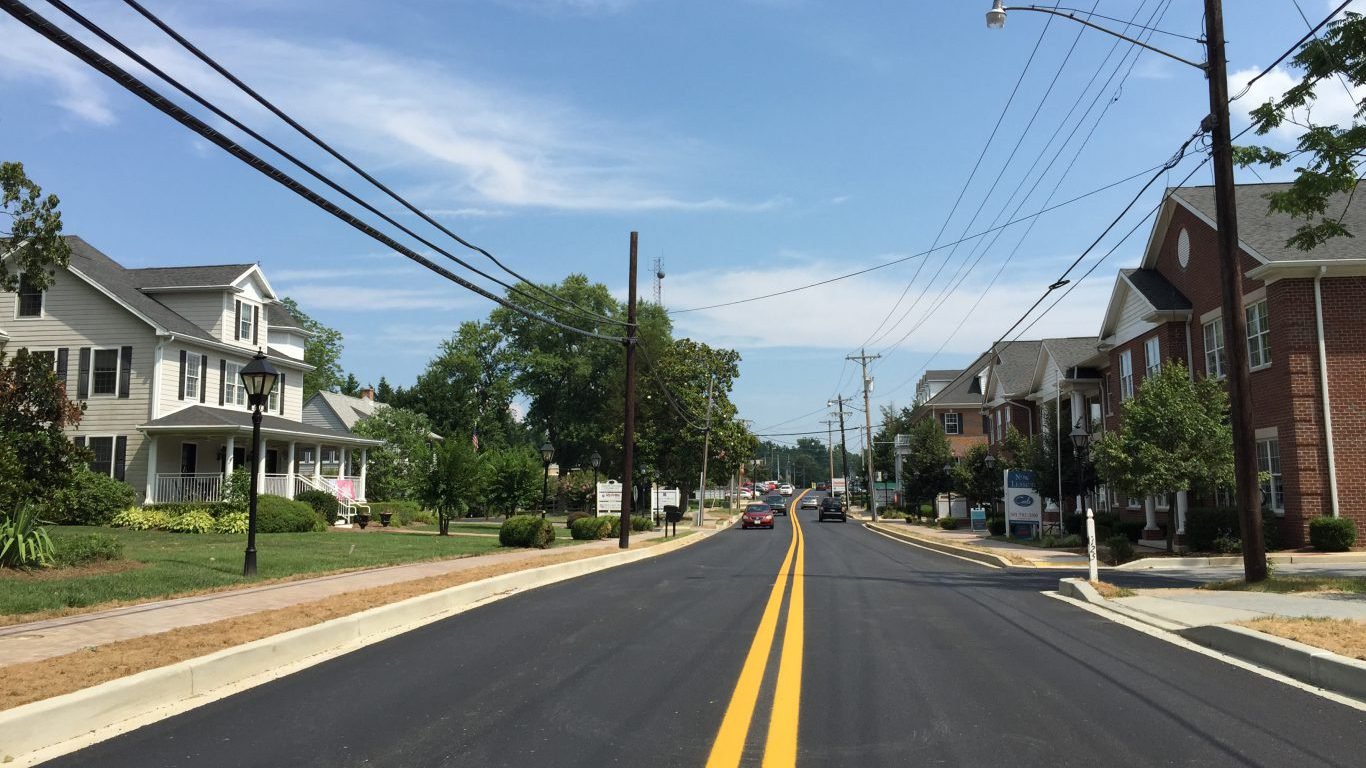
Maryland: Calvert County
> Homeownership rate: 84.7% (Maryland: 67.1%)
> Median home value: $364,800 (Maryland: $325,400)
> Median monthly housing costs (w/ a mortgage): $2,136 (Maryland: $2,038)
> Median monthly housing costs (no mortgage): $644 (Maryland: $633)
> Median household income: $112,696 (Maryland: $87,063)
> No. of counties considered in ranking: 24
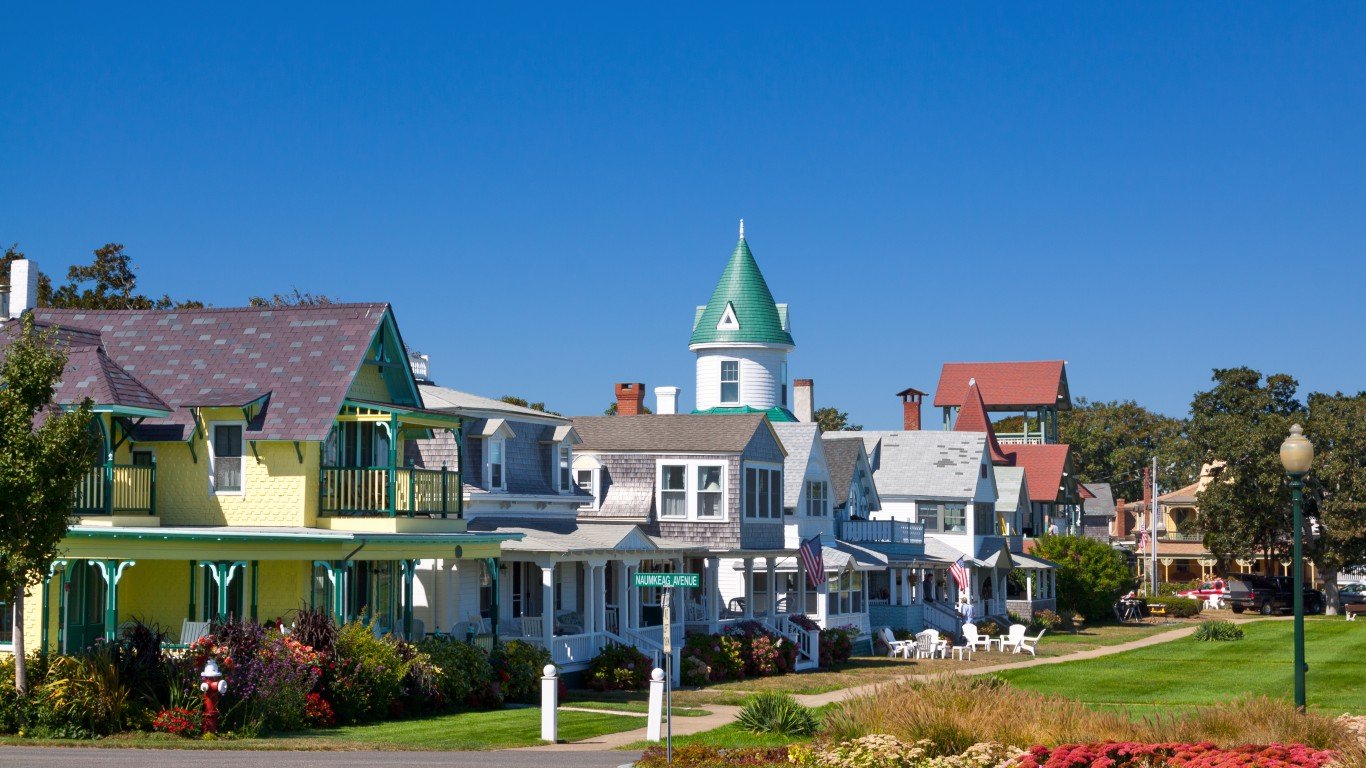
Massachusetts: Barnstable County
> Homeownership rate: 79.6% (Massachusetts: 62.5%)
> Median home value: $414,000 (Massachusetts: $398,800)
> Median monthly housing costs (w/ a mortgage): $2,015 (Massachusetts: $2,268)
> Median monthly housing costs (no mortgage): $739 (Massachusetts: $829)
> Median household income: $76,863 (Massachusetts: $84,385)
> No. of counties considered in ranking: 14
[in-text-ad]

Michigan: Benzie County
> Homeownership rate: 90.9% (Michigan: 71.7%)
> Median home value: $195,400 (Michigan: $162,600)
> Median monthly housing costs (w/ a mortgage): $1,164 (Michigan: $1,312)
> Median monthly housing costs (no mortgage): $460 (Michigan: $495)
> Median household income: $64,257 (Michigan: $59,234)
> No. of counties considered in ranking: 83
[recirclink id=1090988]

Minnesota: Chisago County
> Homeownership rate: 86.4% (Minnesota: 71.9%)
> Median home value: $244,600 (Minnesota: $235,700)
> Median monthly housing costs (w/ a mortgage): $1,703 (Minnesota: $1,606)
> Median monthly housing costs (no mortgage): $588 (Minnesota: $548)
> Median household income: $86,900 (Minnesota: $73,382)
> No. of counties considered in ranking: 87

Mississippi: Greene County
> Homeownership rate: 86.1% (Mississippi: 68.8%)
> Median home value: $83,100 (Mississippi: $125,500)
> Median monthly housing costs (w/ a mortgage): $977 (Mississippi: $1,161)
> Median monthly housing costs (no mortgage): $327 (Mississippi: $358)
> Median household income: $47,033 (Mississippi: $46,511)
> No. of counties considered in ranking: 81
[in-text-ad-2]

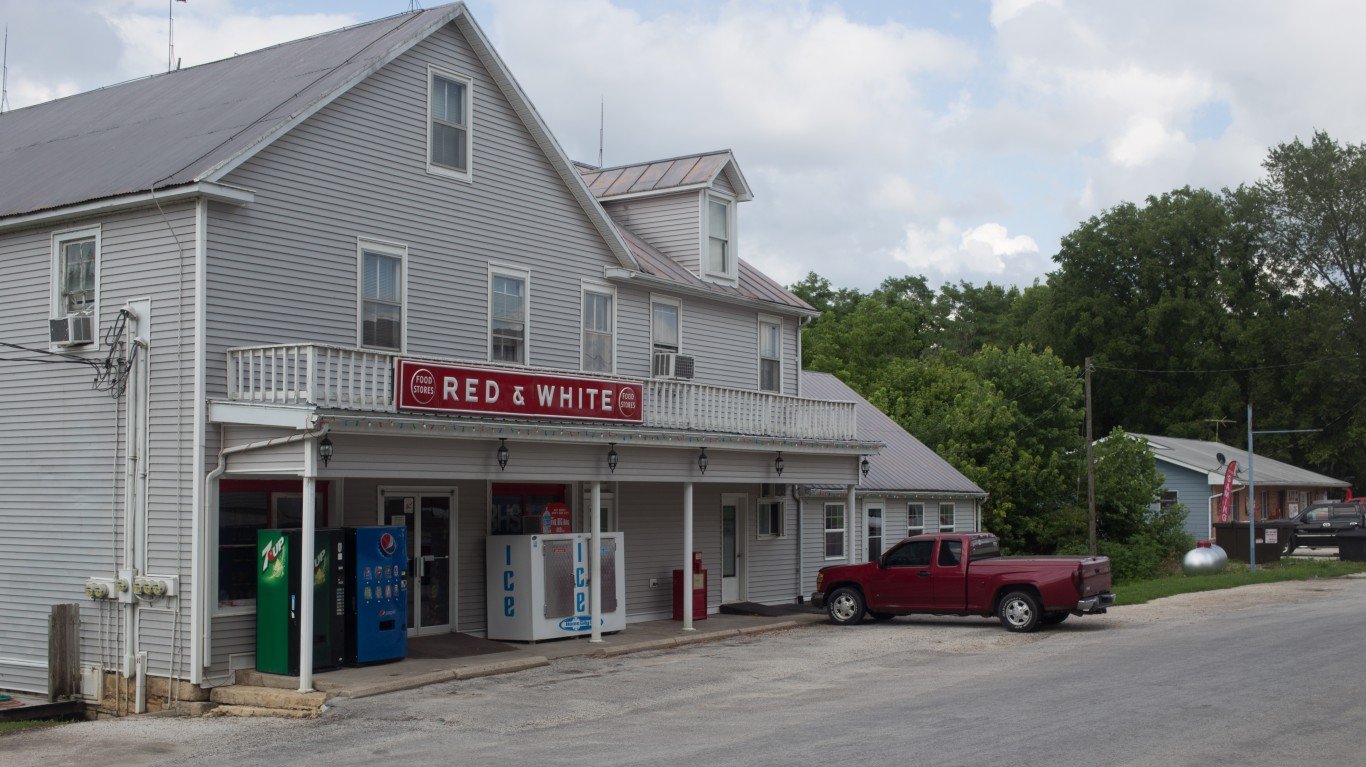
Missouri: Ralls County
> Homeownership rate: 85.4% (Missouri: 67.1%)
> Median home value: $134,700 (Missouri: $163,600)
> Median monthly housing costs (w/ a mortgage): $1,100 (Missouri: $1,287)
> Median monthly housing costs (no mortgage): $412 (Missouri: $449)
> Median household income: $54,194 (Missouri: $57,290)
> No. of counties considered in ranking: 115
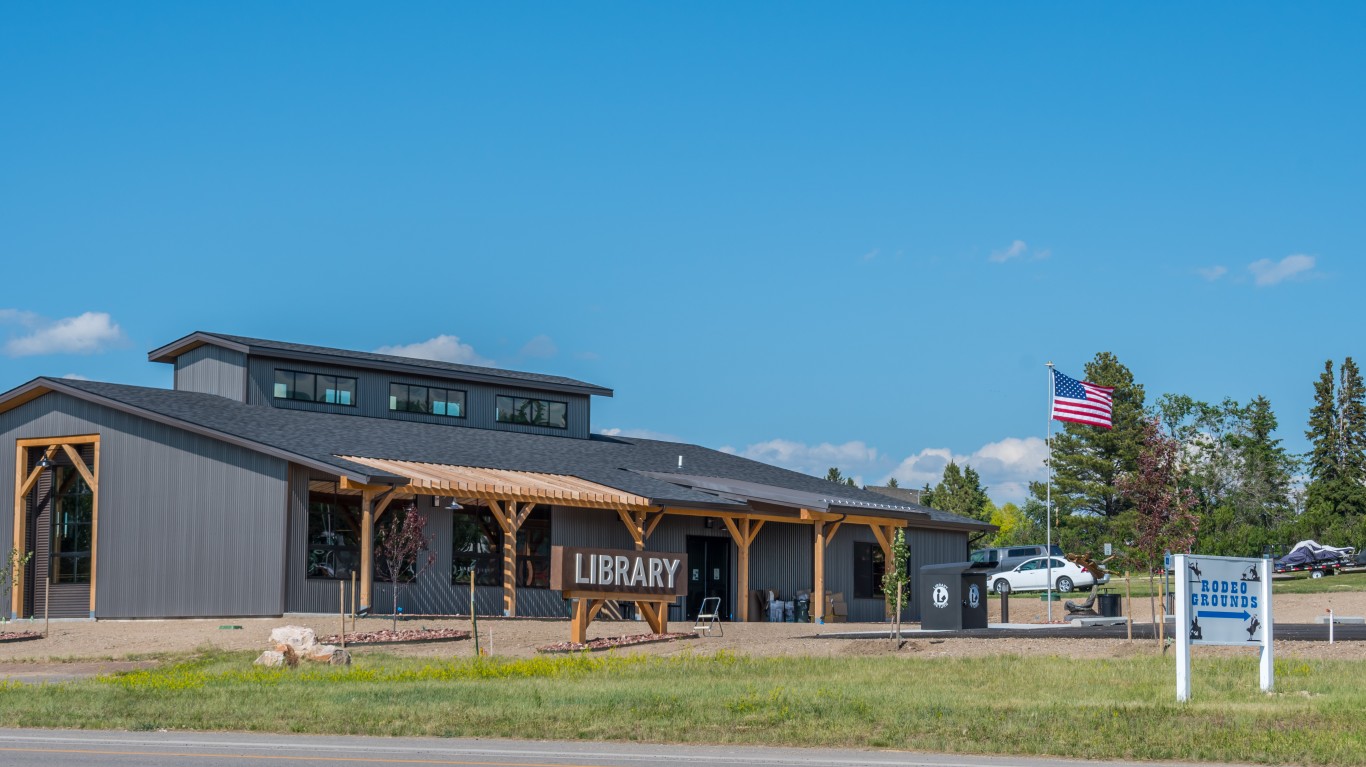
Montana: Meagher County
> Homeownership rate: 85.6% (Montana: 68.5%)
> Median home value: $170,700 (Montana: $244,900)
> Median monthly housing costs (w/ a mortgage): $1,167 (Montana: $1,456)
> Median monthly housing costs (no mortgage): $415 (Montana: $451)
> Median household income: $46,815 (Montana: $56,539)
> No. of counties considered in ranking: 49
[in-text-ad]

Nebraska: Nance County
> Homeownership rate: 87.0% (Nebraska: 66.2%)
> Median home value: $78,400 (Nebraska: $164,000)
> Median monthly housing costs (w/ a mortgage): $977 (Nebraska: $1,412)
> Median monthly housing costs (no mortgage): $401 (Nebraska: $539)
> Median household income: $53,147 (Nebraska: $63,015)
> No. of counties considered in ranking: 79
[recirclink id=1081420]

Nevada: Storey County
> Homeownership rate: 96.5% (Nevada: 57.1%)
> Median home value: $264,000 (Nevada: $290,200)
> Median monthly housing costs (w/ a mortgage): $1,397 (Nevada: $1,574)
> Median monthly housing costs (no mortgage): $434 (Nevada: $433)
> Median household income: $64,000 (Nevada: $62,043)
> No. of counties considered in ranking: 16
New Hampshire: Carroll County
> Homeownership rate: 79.4% (New Hampshire: 71.2%)
> Median home value: $251,400 (New Hampshire: $272,300)
> Median monthly housing costs (w/ a mortgage): $1,544 (New Hampshire: $1,967)
> Median monthly housing costs (no mortgage): $618 (New Hampshire: $812)
> Median household income: $66,932 (New Hampshire: $77,923)
> No. of counties considered in ranking: 10
[in-text-ad-2]

New Jersey: Hunterdon County
> Homeownership rate: 83.9% (New Jersey: 64.0%)
> Median home value: $418,700 (New Jersey: $343,500)
> Median monthly housing costs (w/ a mortgage): $2,787 (New Jersey: $2,476)
> Median monthly housing costs (no mortgage): $1,153 (New Jersey: $1,062)
> Median household income: $117,858 (New Jersey: $85,245)
> No. of counties considered in ranking: 21
New Mexico: Mora County
> Homeownership rate: 88.4% (New Mexico: 68.0%)
> Median home value: $104,300 (New Mexico: $175,700)
> Median monthly housing costs (w/ a mortgage): $1,039 (New Mexico: $1,293)
> Median monthly housing costs (no mortgage): $307 (New Mexico: $360)
> Median household income: $29,458 (New Mexico: $51,243)
> No. of counties considered in ranking: 32
[in-text-ad]
New York: Hamilton County
> Homeownership rate: 85.3% (New York: 54.1%)
> Median home value: $170,500 (New York: $325,000)
> Median monthly housing costs (w/ a mortgage): $1,265 (New York: $2,174)
> Median monthly housing costs (no mortgage): $453 (New York: $781)
> Median household income: $60,625 (New York: $71,117)
> No. of counties considered in ranking: 62
[recirclink id=1082534]
North Carolina: Currituck County
> Homeownership rate: 83.9% (North Carolina: 65.7%)
> Median home value: $263,400 (North Carolina: $182,100)
> Median monthly housing costs (w/ a mortgage): $1,677 (North Carolina: $1,328)
> Median monthly housing costs (no mortgage): $413 (North Carolina: $402)
> Median household income: $73,741 (North Carolina: $56,642)
> No. of counties considered in ranking: 100

North Dakota: Oliver County
> Homeownership rate: 88.8% (North Dakota: 62.5%)
> Median home value: $202,400 (North Dakota: $199,900)
> Median monthly housing costs (w/ a mortgage): $1,450 (North Dakota: $1,457)
> Median monthly housing costs (no mortgage): $513 (North Dakota: $476)
> Median household income: $66,641 (North Dakota: $65,315)
> No. of counties considered in ranking: 50
[in-text-ad-2]

Ohio: Geauga County
> Homeownership rate: 86.7% (Ohio: 66.3%)
> Median home value: $247,700 (Ohio: $151,400)
> Median monthly housing costs (w/ a mortgage): $1,676 (Ohio: $1,286)
> Median monthly housing costs (no mortgage): $617 (Ohio: $480)
> Median household income: $83,730 (Ohio: $58,116)
> No. of counties considered in ranking: 88
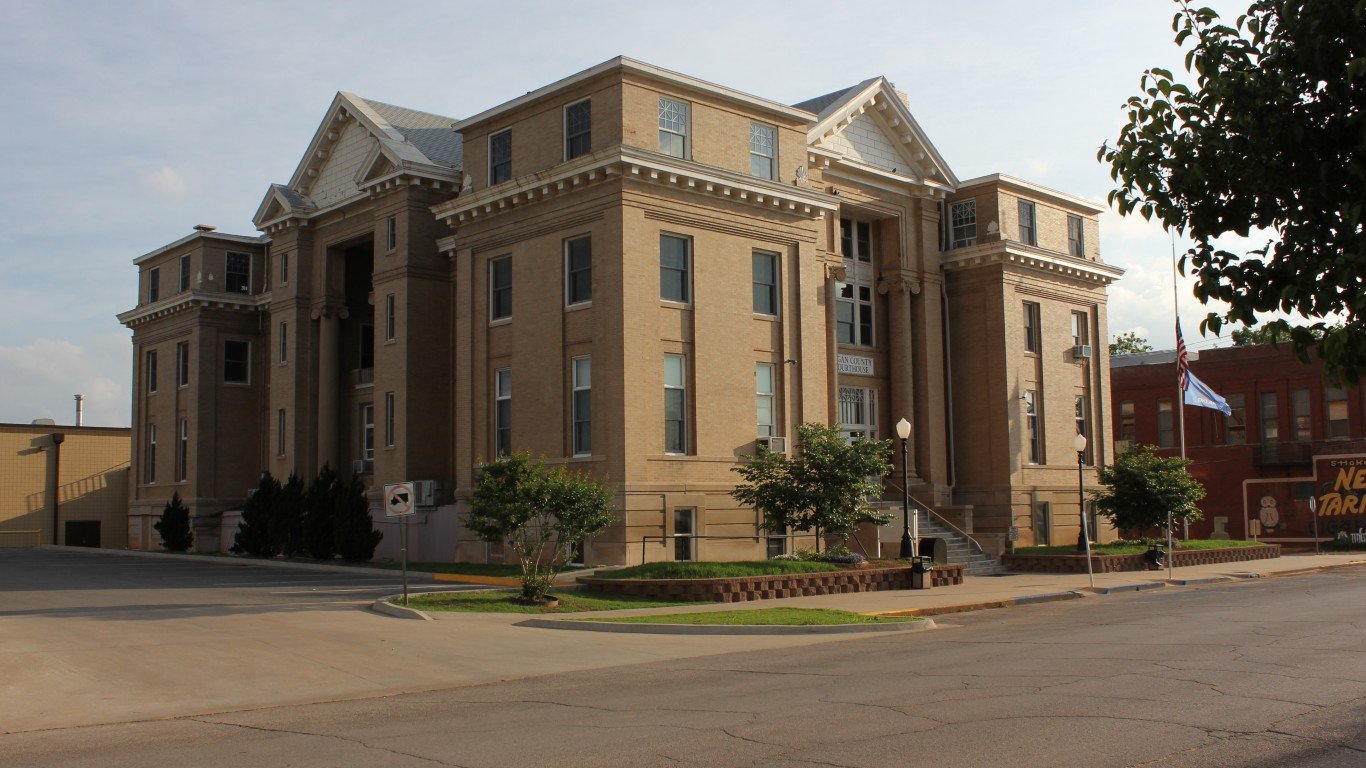
Oklahoma: Logan County
> Homeownership rate: 84.6% (Oklahoma: 66.1%)
> Median home value: $176,000 (Oklahoma: $142,400)
> Median monthly housing costs (w/ a mortgage): $1,433 (Oklahoma: $1,246)
> Median monthly housing costs (no mortgage): $405 (Oklahoma: $406)
> Median household income: $70,456 (Oklahoma: $53,840)
> No. of counties considered in ranking: 77
[in-text-ad]

Oregon: Columbia County
> Homeownership rate: 75.7% (Oregon: 62.8%)
> Median home value: $282,600 (Oregon: $336,700)
> Median monthly housing costs (w/ a mortgage): $1,570 (Oregon: $1,741)
> Median monthly housing costs (no mortgage): $496 (Oregon: $553)
> Median household income: $68,170 (Oregon: $65,667)
> No. of counties considered in ranking: 34
[recirclink id=1083492]

Pennsylvania: Pike County
> Homeownership rate: 84.3% (Pennsylvania: 69.0%)
> Median home value: $186,600 (Pennsylvania: $187,500)
> Median monthly housing costs (w/ a mortgage): $1,548 (Pennsylvania: $1,505)
> Median monthly housing costs (no mortgage): $617 (Pennsylvania: $542)
> Median household income: $67,495 (Pennsylvania: $63,627)
> No. of counties considered in ranking: 67

Rhode Island: Washington County
> Homeownership rate: 75.1% (Rhode Island: 61.6%)
> Median home value: $359,300 (Rhode Island: $276,600)
> Median monthly housing costs (w/ a mortgage): $2,010 (Rhode Island: $1,879)
> Median monthly housing costs (no mortgage): $776 (Rhode Island: $745)
> Median household income: $86,970 (Rhode Island: $70,305)
> No. of counties considered in ranking: 5
[in-text-ad-2]

South Carolina: Calhoun County
> Homeownership rate: 81.4% (South Carolina: 70.1%)
> Median home value: $104,500 (South Carolina: $170,100)
> Median monthly housing costs (w/ a mortgage): $1,206 (South Carolina: $1,265)
> Median monthly housing costs (no mortgage): $323 (South Carolina: $377)
> Median household income: $49,844 (South Carolina: $54,864)
> No. of counties considered in ranking: 46
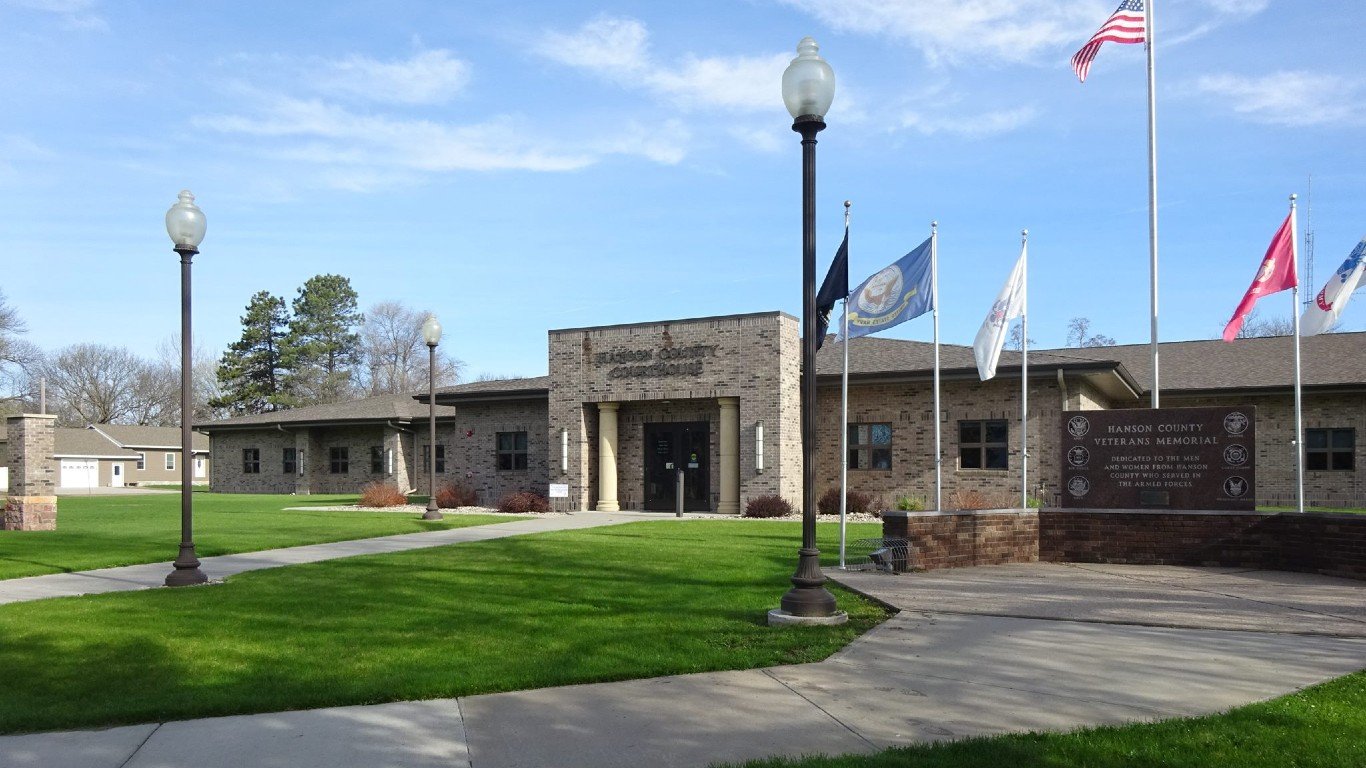
South Dakota: Hanson County
> Homeownership rate: 87.8% (South Dakota: 68.0%)
> Median home value: $139,900 (South Dakota: $174,600)
> Median monthly housing costs (w/ a mortgage): $1,130 (South Dakota: $1,367)
> Median monthly housing costs (no mortgage): $481 (South Dakota: $495)
> Median household income: $63,750 (South Dakota: $59,896)
> No. of counties considered in ranking: 60
[in-text-ad]

Tennessee: Moore County
> Homeownership rate: 83.7% (Tennessee: 66.5%)
> Median home value: $200,500 (Tennessee: $177,600)
> Median monthly housing costs (w/ a mortgage): $1,369 (Tennessee: $1,272)
> Median monthly housing costs (no mortgage): $408 (Tennessee: $389)
> Median household income: $63,762 (Tennessee: $54,833)
> No. of counties considered in ranking: 95
[recirclink id=1090849]

Texas: Crane County
> Homeownership rate: 88.6% (Texas: 62.3%)
> Median home value: $89,000 (Texas: $187,200)
> Median monthly housing costs (w/ a mortgage): $1,063 (Texas: $1,654)
> Median monthly housing costs (no mortgage): $341 (Texas: $526)
> Median household income: $54,596 (Texas: $63,826)
> No. of counties considered in ranking: 235

Utah: Morgan County
> Homeownership rate: 88.5% (Utah: 70.5%)
> Median home value: $417,600 (Utah: $305,400)
> Median monthly housing costs (w/ a mortgage): $2,035 (Utah: $1,597)
> Median monthly housing costs (no mortgage): $464 (Utah: $437)
> Median household income: $100,408 (Utah: $74,197)
> No. of counties considered in ranking: 27
[in-text-ad-2]

Vermont: Grand Isle County
> Homeownership rate: 85.9% (Vermont: 71.3%)
> Median home value: $287,200 (Vermont: $230,900)
> Median monthly housing costs (w/ a mortgage): $1,917 (Vermont: $1,630)
> Median monthly housing costs (no mortgage): $782 (Vermont: $686)
> Median household income: $81,667 (Vermont: $63,477)
> No. of counties considered in ranking: 14

Virginia: Powhatan County
> Homeownership rate: 92.8% (Virginia: 66.7%)
> Median home value: $291,300 (Virginia: $282,800)
> Median monthly housing costs (w/ a mortgage): $1,702 (Virginia: $1,822)
> Median monthly housing costs (no mortgage): $483 (Virginia: $481)
> Median household income: $93,833 (Virginia: $76,398)
> No. of counties considered in ranking: 133
[in-text-ad]

Washington: Wahkiakum County
> Homeownership rate: 89.0% (Washington: 63.3%)
> Median home value: $228,600 (Washington: $366,800)
> Median monthly housing costs (w/ a mortgage): $1,433 (Washington: $1,939)
> Median monthly housing costs (no mortgage): $459 (Washington: $605)
> Median household income: $54,524 (Washington: $77,006)
> No. of counties considered in ranking: 39
[recirclink id=1090988]
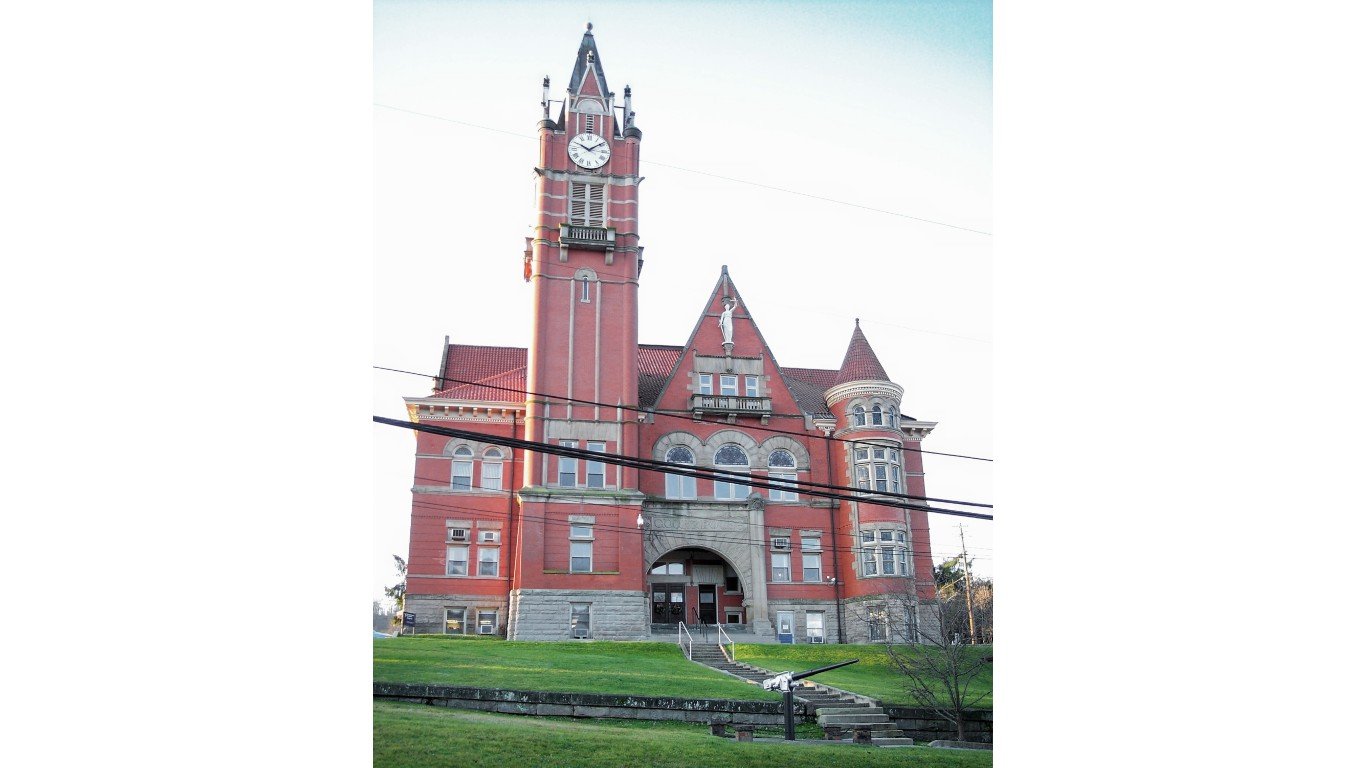
West Virginia: Doddridge County
> Homeownership rate: 91.0% (West Virginia: 73.7%)
> Median home value: $124,300 (West Virginia: $123,200)
> Median monthly housing costs (w/ a mortgage): $1,035 (West Virginia: $1,058)
> Median monthly housing costs (no mortgage): $275 (West Virginia: $331)
> Median household income: $51,300 (West Virginia: $48,037)
> No. of counties considered in ranking: 55
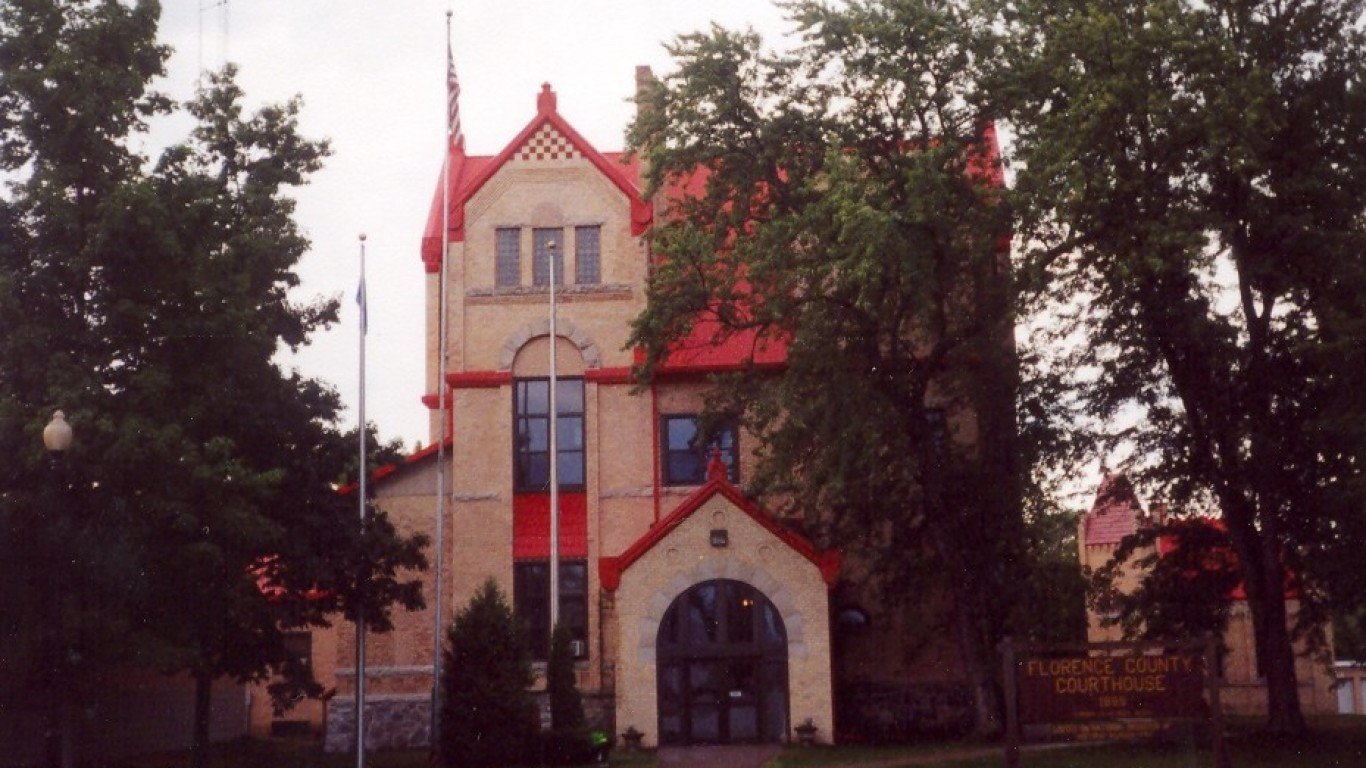
Wisconsin: Florence County
> Homeownership rate: 87.5% (Wisconsin: 67.1%)
> Median home value: $130,700 (Wisconsin: $189,200)
> Median monthly housing costs (w/ a mortgage): $1,095 (Wisconsin: $1,436)
> Median monthly housing costs (no mortgage): $451 (Wisconsin: $556)
> Median household income: $50,821 (Wisconsin: $63,293)
> No. of counties considered in ranking: 72
[in-text-ad-2]
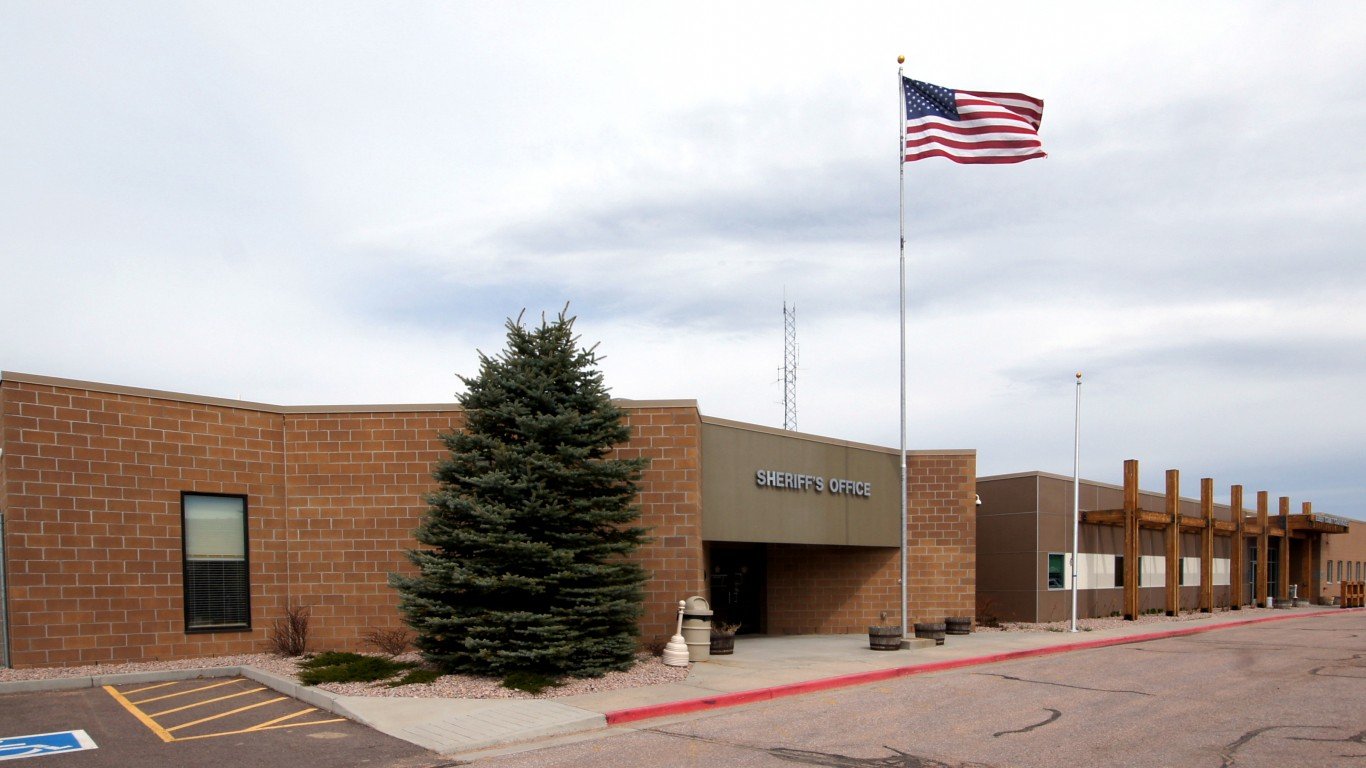
Wyoming: Weston County
> Homeownership rate: 83.9% (Wyoming: 71.0%)
> Median home value: $166,600 (Wyoming: $228,000)
> Median monthly housing costs (w/ a mortgage): $1,391 (Wyoming: $1,474)
> Median monthly housing costs (no mortgage): $426 (Wyoming: $429)
> Median household income: $53,333 (Wyoming: $65,304)
> No. of counties considered in ranking: 23
Methodology
To determine the county with the highest homeownership rate in each state, 24/7 Wall St. reviewed five-year estimates of the share of housing units that are occupied by their owners from the U.S. Census Bureau’s 2020 American Community Survey.
Counties and county equivalents, which can include independent cities, were ranked based on the percentage of housing units that are occupied by their owners. To break ties, we used the number of housing units that are occupied by their owners.
Counties were excluded if homeownership rates were not available in the 2020 ACS, if there were fewer than 1,000 housing units, or if the sampling error associated with a county’s data was deemed too high.
The sampling error was defined as too high if the coefficient of variation — a statistical assessment of how reliable an estimate is — for a county’s homeownership rate was above 15% and greater than two standard deviations above the mean CV for all counties’ homeownership rates. We similarly excluded counties that had a sampling error too high for their population, using the same definition.
Additional information on median home value, median housing costs with and without a mortgage, and median household income are also five-year estimates from the 2020 ACS.
Contact [email protected] for any questions or corrections.