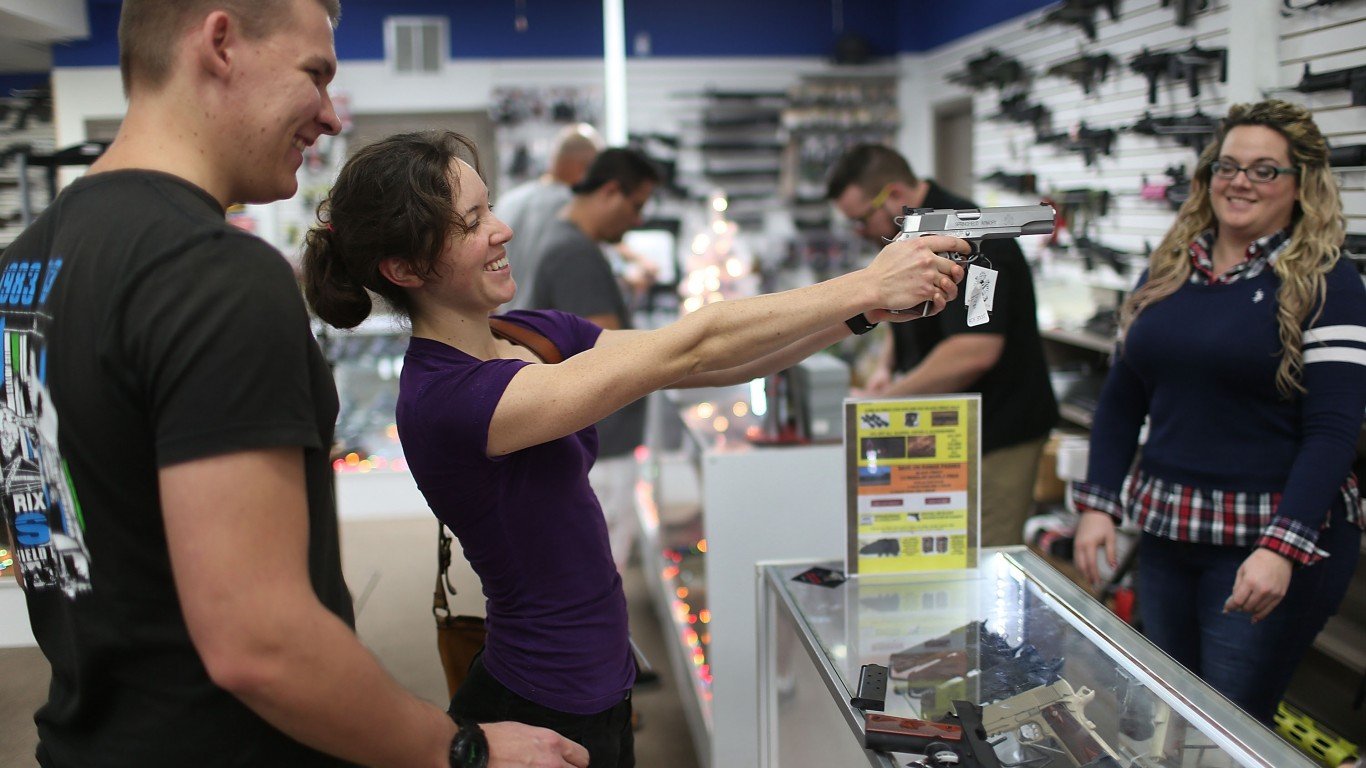
Through the first two months of 2023, roughly 5.1 million firearm background checks were conducted in the United States, according to data compiled by the FBI. That figure represents a slight increase compared to the first two months of 2022. Firearm background checks are often used to approximate the level of gun sales in the United States. (These are the companies selling the most guns, according to an online gun broker.)
However, there are a number of reasons to initiate a background check that are clearly not tied to gun sales, including rentals and pawn shop transactions. After controlling for some of these non-purchase causes, there were 3.3 million background checks that are likely tied to the purchase of a firearm through the end of February, or 9.9 checks per 1,000 Americans.
To find the states where the most people bought guns last month, 24/7 Wall St. used FBI data from its National Instant Criminal Background Check System. States are ranked based on the number of gun checks per 1000 people in the first two months of 2023, adjusted by removing several categories of checks, including pawn shop transactions, returns, rentals, and rechecks (which are conducted periodically by some states on existing permit holders).
We also adjusted the figures for Illinois, a state that reports an extremely high number of firearm background checks. Based on historical data, however, a large percentage of checks in Illinois are likely rechecks and not tied to the purchasing of a new firearm.
The vast majority of states with the most checks per person are in the South, Midwest, or West. The No. 1 state, Oregon, had 23.4 background checks per 1,000 residents, more than double the national figure. At the other end of the list are states in the Northeast and West Coast, including California, Hawaii, New Jersey, and New York, which are among the five states with the strictest gun control laws. (See how all 50 states rank for the strength of their gun control laws.)
Click here to see states where the most people have bought guns so far this year.
Click here to see our detailed methodology.
50. Hawaii
> Firearm background checks per 1,000 residents, Jan-Feb 2023: 2.5
> Firearm background checks, Jan-Feb 2023: 3,569 — the fewest
> Most common type of firearm check: N/A
> Firearm background checks per 1,000 residents, Jan-Feb 2022: 1.9 — the fewest
> Firearm background checks, Jan-Feb 2022: 2,679 — the fewest
> Change in background checks, Jan-Feb 2021 – Jan-Feb 2022: +890 (+33.2% — 3rd largest increase)
> 2022 Population: 1,440,196 — 11th smallest
[in-text-ad]
49. New York
> Firearm background checks per 1,000 residents, Jan-Feb 2023: 2.9
> Firearm background checks, Jan-Feb 2023: 56,452 — 23rd most
> Most common type of firearm check: Long guns
> Firearm background checks per 1,000 residents, Jan-Feb 2022: 2.9 — 3rd fewest
> Firearm background checks, Jan-Feb 2022: 57,900 — 22nd most
> Change in background checks, Jan-Feb 2021 – Jan-Feb 2022: -1,448 (-2.5% — 8th smallest decrease)
> 2022 Population: 19,677,151 — 4th largest
[recirclink id=1081968]
48. New Jersey
> Firearm background checks per 1,000 residents, Jan-Feb 2023: 3.2
> Firearm background checks, Jan-Feb 2023: 30,086 — 18th fewest
> Most common type of firearm check: Handguns
> Firearm background checks per 1,000 residents, Jan-Feb 2022: 2.8 — 2nd fewest
> Firearm background checks, Jan-Feb 2022: 25,751 — 16th fewest
> Change in background checks, Jan-Feb 2021 – Jan-Feb 2022: +4,335 (+16.8% — 5th largest increase)
> 2022 Population: 9,261,699 — 11th largest
47. Rhode Island
> Firearm background checks per 1,000 residents, Jan-Feb 2023: 4.0
> Firearm background checks, Jan-Feb 2023: 4,394 — 2nd fewest
> Most common type of firearm check: Handguns
> Firearm background checks per 1,000 residents, Jan-Feb 2022: 4.1 — 4th fewest
> Firearm background checks, Jan-Feb 2022: 4,537 — 2nd fewest
> Change in background checks, Jan-Feb 2021 – Jan-Feb 2022: -143 (-3.2% — 9th largest decrease)
> 2022 Population: 1,093,734 — 7th smallest
[in-text-ad-2]
46. California
> Firearm background checks per 1,000 residents, Jan-Feb 2023: 4.9
> Firearm background checks, Jan-Feb 2023: 190,787 — 4th most
> Most common type of firearm check: Handguns
> Firearm background checks per 1,000 residents, Jan-Feb 2022: 4.7 — 5th fewest
> Firearm background checks, Jan-Feb 2022: 183,205 — 4th most
> Change in background checks, Jan-Feb 2021 – Jan-Feb 2022: +7,582 (+4.1% — 13th smallest increase)
> 2022 Population: 39,029,342 — the largest
45. Massachusetts
> Firearm background checks per 1,000 residents, Jan-Feb 2023: 5.7
> Firearm background checks, Jan-Feb 2023: 39,997 — 22nd fewest
> Most common type of firearm check: Handguns
> Firearm background checks per 1,000 residents, Jan-Feb 2022: 5.1 — 6th fewest
> Firearm background checks, Jan-Feb 2022: 35,370 — 21st fewest
> Change in background checks, Jan-Feb 2021 – Jan-Feb 2022: +4,627 (+13.1% — 6th largest increase)
> 2022 Population: 6,981,974 — 16th largest
[in-text-ad]
44. Nevada
> Firearm background checks per 1,000 residents, Jan-Feb 2023: 6.5
> Firearm background checks, Jan-Feb 2023: 20,776 — 12th fewest
> Most common type of firearm check: Handguns
> Firearm background checks per 1,000 residents, Jan-Feb 2022: 7.7 — 10th fewest
> Firearm background checks, Jan-Feb 2022: 24,423 — 14th fewest
> Change in background checks, Jan-Feb 2021 – Jan-Feb 2022: -3,647 (-14.9% — 3rd largest decrease)
> 2022 Population: 3,177,772 — 19th smallest
[recirclink id=1207370]
43. Nebraska
> Firearm background checks per 1,000 residents, Jan-Feb 2023: 6.6
> Firearm background checks, Jan-Feb 2023: 13,055 — 9th fewest
> Most common type of firearm check: Long guns
> Firearm background checks per 1,000 residents, Jan-Feb 2022: 6.3 — 8th fewest
> Firearm background checks, Jan-Feb 2022: 12,363 — 8th fewest
> Change in background checks, Jan-Feb 2021 – Jan-Feb 2022: +692 (+5.6% — 13th largest increase)
> 2022 Population: 1,967,923 — 14th smallest
42. Iowa
> Firearm background checks per 1,000 residents, Jan-Feb 2023: 7.6
> Firearm background checks, Jan-Feb 2023: 24,476 — 14th fewest
> Most common type of firearm check: Long guns
> Firearm background checks per 1,000 residents, Jan-Feb 2022: 7.0 — 9th fewest
> Firearm background checks, Jan-Feb 2022: 22,362 — 13th fewest
> Change in background checks, Jan-Feb 2021 – Jan-Feb 2022: +2,114 (+9.5% — 9th largest increase)
> 2022 Population: 3,200,517 — 20th smallest
[in-text-ad-2]
41. Delaware
> Firearm background checks per 1,000 residents, Jan-Feb 2023: 8.1
> Firearm background checks, Jan-Feb 2023: 8,220 — 4th fewest
> Most common type of firearm check: Handguns
> Firearm background checks per 1,000 residents, Jan-Feb 2022: 9.3 — 14th fewest
> Firearm background checks, Jan-Feb 2022: 9,428 — 4th fewest
> Change in background checks, Jan-Feb 2021 – Jan-Feb 2022: -1,208 (-12.8% — 4th largest decrease)
> 2022 Population: 1,018,396 — 6th smallest

40. Texas
> Firearm background checks per 1,000 residents, Jan-Feb 2023: 8.3
> Firearm background checks, Jan-Feb 2023: 249,174 — the most
> Most common type of firearm check: Handguns
> Firearm background checks per 1,000 residents, Jan-Feb 2022: 8.2 — 11th fewest
> Firearm background checks, Jan-Feb 2022: 247,257 — the most
> Change in background checks, Jan-Feb 2021 – Jan-Feb 2022: +1,917 (+0.8% — the smallest increase)
> 2022 Population: 30,029,572 — 2nd largest
[in-text-ad]

39. Georgia
> Firearm background checks per 1,000 residents, Jan-Feb 2023: 8.6
> Firearm background checks, Jan-Feb 2023: 94,159 — 14th most
> Most common type of firearm check: Handguns
> Firearm background checks per 1,000 residents, Jan-Feb 2022: 8.9 — 13th fewest
> Firearm background checks, Jan-Feb 2022: 96,738 — 13th most
> Change in background checks, Jan-Feb 2021 – Jan-Feb 2022: -2,579 (-2.7% — 9th smallest decrease)
> 2022 Population: 10,912,876 — 8th largest
[recirclink id=1207112]

38. Ohio
> Firearm background checks per 1,000 residents, Jan-Feb 2023: 8.7
> Firearm background checks, Jan-Feb 2023: 102,688 — 9th most
> Most common type of firearm check: Handguns
> Firearm background checks per 1,000 residents, Jan-Feb 2022: 8.6 — 12th fewest
> Firearm background checks, Jan-Feb 2022: 101,562 — 11th most
> Change in background checks, Jan-Feb 2021 – Jan-Feb 2022: +1,126 (+1.1% — 4th smallest increase)
> 2022 Population: 11,756,058 — 7th largest
37. North Carolina
> Firearm background checks per 1,000 residents, Jan-Feb 2023: 9.3
> Firearm background checks, Jan-Feb 2023: 99,832 — 11th most
> Most common type of firearm check: Long guns
> Firearm background checks per 1,000 residents, Jan-Feb 2022: 9.4 — 16th fewest
> Firearm background checks, Jan-Feb 2022: 100,060 — 12th most
> Change in background checks, Jan-Feb 2021 – Jan-Feb 2022: -228 (-0.2% — the smallest decrease)
> 2022 Population: 10,698,973 — 9th largest
[in-text-ad-2]
36. Louisiana
> Firearm background checks per 1,000 residents, Jan-Feb 2023: 9.7
> Firearm background checks, Jan-Feb 2023: 44,490 — 25th fewest
> Most common type of firearm check: Handguns
> Firearm background checks per 1,000 residents, Jan-Feb 2022: 11.9 — 23rd most
> Firearm background checks, Jan-Feb 2022: 54,547 — 23rd most
> Change in background checks, Jan-Feb 2021 – Jan-Feb 2022: -10,057 (-18.4% — 2nd largest decrease)
> 2022 Population: 4,590,241 — 25th largest
35. Florida
> Firearm background checks per 1,000 residents, Jan-Feb 2023: 9.9
> Firearm background checks, Jan-Feb 2023: 220,412 — 2nd most
> Most common type of firearm check: Handguns
> Firearm background checks per 1,000 residents, Jan-Feb 2022: 10.0 — 18th fewest
> Firearm background checks, Jan-Feb 2022: 222,048 — 2nd most
> Change in background checks, Jan-Feb 2021 – Jan-Feb 2022: -1,636 (-0.7% — 3rd smallest decrease)
> 2022 Population: 22,244,823 — 3rd largest
[in-text-ad]
34. Kentucky
> Firearm background checks per 1,000 residents, Jan-Feb 2023: 9.9
> Firearm background checks, Jan-Feb 2023: 44,820 — 25th most
> Most common type of firearm check: Handguns
> Firearm background checks per 1,000 residents, Jan-Feb 2022: 9.8 — 17th fewest
> Firearm background checks, Jan-Feb 2022: 44,432 — 25th most
> Change in background checks, Jan-Feb 2021 – Jan-Feb 2022: +388 (+0.9% — 3rd smallest increase)
> 2022 Population: 4,512,310 — 25th smallest
[recirclink id=1206181]
33. Kansas
> Firearm background checks per 1,000 residents, Jan-Feb 2023: 10.2
> Firearm background checks, Jan-Feb 2023: 29,886 — 17th fewest
> Most common type of firearm check: Handguns
> Firearm background checks per 1,000 residents, Jan-Feb 2022: 10.1 — 19th fewest
> Firearm background checks, Jan-Feb 2022: 29,708 — 18th fewest
> Change in background checks, Jan-Feb 2021 – Jan-Feb 2022: +178 (+0.6% — 20th smallest increase)
> 2022 Population: 2,937,150 — 16th smallest
32. Connecticut
> Firearm background checks per 1,000 residents, Jan-Feb 2023: 10.4
> Firearm background checks, Jan-Feb 2023: 37,682 — 21st fewest
> Most common type of firearm check: Handguns
> Firearm background checks per 1,000 residents, Jan-Feb 2022: 10.5 — 22nd fewest
> Firearm background checks, Jan-Feb 2022: 37,898 — 23rd fewest
> Change in background checks, Jan-Feb 2021 – Jan-Feb 2022: -216 (-0.6% — 2nd smallest decrease)
> 2022 Population: 3,626,205 — 22nd smallest
[in-text-ad-2]
31. Arizona
> Firearm background checks per 1,000 residents, Jan-Feb 2023: 10.4
> Firearm background checks, Jan-Feb 2023: 76,569 — 19th most
> Most common type of firearm check: Handguns
> Firearm background checks per 1,000 residents, Jan-Feb 2022: 9.3 — 15th fewest
> Firearm background checks, Jan-Feb 2022: 68,291 — 19th most
> Change in background checks, Jan-Feb 2021 – Jan-Feb 2022: +8,278 (+12.1% — 7th largest increase)
> 2022 Population: 7,359,197 — 14th largest

30. Virginia
> Firearm background checks per 1,000 residents, Jan-Feb 2023: 10.6
> Firearm background checks, Jan-Feb 2023: 91,872 — 15th most
> Most common type of firearm check: Handguns
> Firearm background checks per 1,000 residents, Jan-Feb 2022: 10.3 — 20th fewest
> Firearm background checks, Jan-Feb 2022: 89,018 — 14th most
> Change in background checks, Jan-Feb 2021 – Jan-Feb 2022: +2,854 (+3.2% — 11th smallest increase)
> 2022 Population: 8,683,619 — 12th largest
[in-text-ad]
29. Arkansas
> Firearm background checks per 1,000 residents, Jan-Feb 2023: 10.7
> Firearm background checks, Jan-Feb 2023: 32,530 — 19th fewest
> Most common type of firearm check: Handguns
> Firearm background checks per 1,000 residents, Jan-Feb 2022: 10.4 — 21st fewest
> Firearm background checks, Jan-Feb 2022: 31,537 — 19th fewest
> Change in background checks, Jan-Feb 2021 – Jan-Feb 2022: +993 (+3.1% — 9th smallest increase)
> 2022 Population: 3,045,637 — 18th smallest
[recirclink id=1205786]
28. South Carolina
> Firearm background checks per 1,000 residents, Jan-Feb 2023: 10.9
> Firearm background checks, Jan-Feb 2023: 57,416 — 22nd most
> Most common type of firearm check: Handguns
> Firearm background checks per 1,000 residents, Jan-Feb 2022: 12.1 — 20th most
> Firearm background checks, Jan-Feb 2022: 64,115 — 20th most
> Change in background checks, Jan-Feb 2021 – Jan-Feb 2022: -6,699 (-10.4% — 7th largest decrease)
> 2022 Population: 5,282,634 — 23rd largest
27. Vermont
> Firearm background checks per 1,000 residents, Jan-Feb 2023: 11.1
> Firearm background checks, Jan-Feb 2023: 7,164 — 3rd fewest
> Most common type of firearm check: Handguns
> Firearm background checks per 1,000 residents, Jan-Feb 2022: 10.6 — 23rd fewest
> Firearm background checks, Jan-Feb 2022: 6,854 — 3rd fewest
> Change in background checks, Jan-Feb 2021 – Jan-Feb 2022: +310 (+4.5% — 15th smallest increase)
> 2022 Population: 647,064 — 2nd smallest
[in-text-ad-2]
26. Minnesota
> Firearm background checks per 1,000 residents, Jan-Feb 2023: 11.4
> Firearm background checks, Jan-Feb 2023: 65,283 — 21st most
> Most common type of firearm check: Handguns
> Firearm background checks per 1,000 residents, Jan-Feb 2022: 12.3 — 19th most
> Firearm background checks, Jan-Feb 2022: 70,436 — 18th most
> Change in background checks, Jan-Feb 2021 – Jan-Feb 2022: -5,153 (-7.3% — 8th largest decrease)
> 2022 Population: 5,717,184 — 22nd largest

25. Indiana
> Firearm background checks per 1,000 residents, Jan-Feb 2023: 11.6
> Firearm background checks, Jan-Feb 2023: 78,943 — 18th most
> Most common type of firearm check: Handguns
> Firearm background checks per 1,000 residents, Jan-Feb 2022: 11.5 — 24th most
> Firearm background checks, Jan-Feb 2022: 78,265 — 17th most
> Change in background checks, Jan-Feb 2021 – Jan-Feb 2022: +678 (+0.9% — 2nd smallest increase)
> 2022 Population: 6,833,037 — 17th largest
[in-text-ad]

24. Maryland
> Firearm background checks per 1,000 residents, Jan-Feb 2023: 11.6
> Firearm background checks, Jan-Feb 2023: 71,619 — 20th most
> Most common type of firearm check: Handguns
> Firearm background checks per 1,000 residents, Jan-Feb 2022: 5.8 — 7th fewest
> Firearm background checks, Jan-Feb 2022: 35,593 — 22nd fewest
> Change in background checks, Jan-Feb 2021 – Jan-Feb 2022: +36,026 (+101.2% — the largest increase)
> 2022 Population: 6,164,660 — 19th largest
[recirclink id=1081968]
23. Maine
> Firearm background checks per 1,000 residents, Jan-Feb 2023: 11.8
> Firearm background checks, Jan-Feb 2023: 16,280 — 10th fewest
> Most common type of firearm check: Handguns
> Firearm background checks per 1,000 residents, Jan-Feb 2022: 11.1 — 25th fewest
> Firearm background checks, Jan-Feb 2022: 15,386 — 10th fewest
> Change in background checks, Jan-Feb 2021 – Jan-Feb 2022: +894 (+5.8% — 12th largest increase)
> 2022 Population: 1,385,340 — 9th smallest
22. Michigan
> Firearm background checks per 1,000 residents, Jan-Feb 2023: 11.9
> Firearm background checks, Jan-Feb 2023: 119,560 — 7th most
> Most common type of firearm check: Handguns
> Firearm background checks per 1,000 residents, Jan-Feb 2022: 11.2 — 25th most
> Firearm background checks, Jan-Feb 2022: 112,407 — 8th most
> Change in background checks, Jan-Feb 2021 – Jan-Feb 2022: +7,153 (+6.4% — 11th largest increase)
> 2022 Population: 10,034,113 — 10th largest
[in-text-ad-2]
21. Utah
> Firearm background checks per 1,000 residents, Jan-Feb 2023: 12.5
> Firearm background checks, Jan-Feb 2023: 42,160 — 24th fewest
> Most common type of firearm check: Handguns
> Firearm background checks per 1,000 residents, Jan-Feb 2022: 11.9 — 21st most
> Firearm background checks, Jan-Feb 2022: 40,364 — 24th fewest
> Change in background checks, Jan-Feb 2021 – Jan-Feb 2022: +1,796 (+4.4% — 14th smallest increase)
> 2022 Population: 3,380,800 — 21st smallest

20. New Mexico
> Firearm background checks per 1,000 residents, Jan-Feb 2023: 12.5
> Firearm background checks, Jan-Feb 2023: 26,486 — 15th fewest
> Most common type of firearm check: Handguns
> Firearm background checks per 1,000 residents, Jan-Feb 2022: 11.9 — 22nd most
> Firearm background checks, Jan-Feb 2022: 25,135 — 15th fewest
> Change in background checks, Jan-Feb 2021 – Jan-Feb 2022: +1,351 (+5.4% — 14th largest increase)
> 2022 Population: 2,113,344 — 15th smallest
[in-text-ad]
19. South Dakota
> Firearm background checks per 1,000 residents, Jan-Feb 2023: 12.8
> Firearm background checks, Jan-Feb 2023: 11,664 — 8th fewest
> Most common type of firearm check: Long guns
> Firearm background checks per 1,000 residents, Jan-Feb 2022: 14.6 — 9th most
> Firearm background checks, Jan-Feb 2022: 13,263 — 9th fewest
> Change in background checks, Jan-Feb 2021 – Jan-Feb 2022: -1,599 (-12.1% — 5th largest decrease)
> 2022 Population: 909,824 — 5th smallest
[recirclink id=1207370]
18. Illinois
> Firearm background checks per 1,000 residents, Jan-Feb 2023: 12.9
> Firearm background checks, Jan-Feb 2023: 162,187 — 5th most
> Most common type of firearm check: Handguns
> Firearm background checks per 1,000 residents, Jan-Feb 2022: 10.7 — 24th fewest
> Firearm background checks, Jan-Feb 2022: 134,934 — 6th most
> Change in background checks, Jan-Feb 2021 – Jan-Feb 2022: +27,253 (+20.2% — 4th largest increase)
> 2022 Population: 12,582,032 — 6th largest
17. Missouri
> Firearm background checks per 1,000 residents, Jan-Feb 2023: 13.0
> Firearm background checks, Jan-Feb 2023: 80,038 — 17th most
> Most common type of firearm check: Handguns
> Firearm background checks per 1,000 residents, Jan-Feb 2022: 12.7 — 18th most
> Firearm background checks, Jan-Feb 2022: 78,280 — 16th most
> Change in background checks, Jan-Feb 2021 – Jan-Feb 2022: +1,758 (+2.2% — 6th smallest increase)
> 2022 Population: 6,177,957 — 18th largest
[in-text-ad-2]

16. Oklahoma
> Firearm background checks per 1,000 residents, Jan-Feb 2023: 13.2
> Firearm background checks, Jan-Feb 2023: 53,012 — 24th most
> Most common type of firearm check: Handguns
> Firearm background checks per 1,000 residents, Jan-Feb 2022: 12.8 — 17th most
> Firearm background checks, Jan-Feb 2022: 51,371 — 24th most
> Change in background checks, Jan-Feb 2021 – Jan-Feb 2022: +1,641 (+3.2% — 10th smallest increase)
> 2022 Population: 4,019,800 — 23rd smallest
15. North Dakota
> Firearm background checks per 1,000 residents, Jan-Feb 2023: 13.6
> Firearm background checks, Jan-Feb 2023: 10,568 — 7th fewest
> Most common type of firearm check: Long guns
> Firearm background checks per 1,000 residents, Jan-Feb 2022: 13.2 — 16th most
> Firearm background checks, Jan-Feb 2022: 10,293 — 6th fewest
> Change in background checks, Jan-Feb 2021 – Jan-Feb 2022: +275 (+2.7% — 7th smallest increase)
> 2022 Population: 779,261 — 4th smallest
[in-text-ad]
14. Mississippi
> Firearm background checks per 1,000 residents, Jan-Feb 2023: 13.7
> Firearm background checks, Jan-Feb 2023: 40,398 — 23rd fewest
> Most common type of firearm check: Handguns
> Firearm background checks per 1,000 residents, Jan-Feb 2022: 13.9 — 13th most
> Firearm background checks, Jan-Feb 2022: 41,006 — 25th fewest
> Change in background checks, Jan-Feb 2021 – Jan-Feb 2022: -608 (-1.5% — 5th smallest decrease)
> 2022 Population: 2,940,057 — 17th smallest
[recirclink id=1207112]
13. Alaska
> Firearm background checks per 1,000 residents, Jan-Feb 2023: 14.0
> Firearm background checks, Jan-Feb 2023: 10,248 — 6th fewest
> Most common type of firearm check: Handguns
> Firearm background checks per 1,000 residents, Jan-Feb 2022: 14.3 — 11th most
> Firearm background checks, Jan-Feb 2022: 10,459 — 7th fewest
> Change in background checks, Jan-Feb 2021 – Jan-Feb 2022: -211 (-2.0% — 6th smallest decrease)
> 2022 Population: 733,583 — 3rd smallest
12. Washington
> Firearm background checks per 1,000 residents, Jan-Feb 2023: 14.2
> Firearm background checks, Jan-Feb 2023: 110,855 — 8th most
> Most common type of firearm check: Handguns
> Firearm background checks per 1,000 residents, Jan-Feb 2022: 13.6 — 15th most
> Firearm background checks, Jan-Feb 2022: 105,605 — 9th most
> Change in background checks, Jan-Feb 2021 – Jan-Feb 2022: +5,250 (+5.0% — 15th largest increase)
> 2022 Population: 7,785,786 — 13th largest
[in-text-ad-2]

11. Colorado
> Firearm background checks per 1,000 residents, Jan-Feb 2023: 14.5
> Firearm background checks, Jan-Feb 2023: 84,560 — 16th most
> Most common type of firearm check: Handguns
> Firearm background checks per 1,000 residents, Jan-Feb 2022: 14.2 — 12th most
> Firearm background checks, Jan-Feb 2022: 82,849 — 15th most
> Change in background checks, Jan-Feb 2021 – Jan-Feb 2022: +1,711 (+2.1% — 5th smallest increase)
> 2022 Population: 5,839,926 — 21st largest
10. New Hampshire
> Firearm background checks per 1,000 residents, Jan-Feb 2023: 15.1
> Firearm background checks, Jan-Feb 2023: 21,059 — 13th fewest
> Most common type of firearm check: Handguns
> Firearm background checks per 1,000 residents, Jan-Feb 2022: 13.9 — 14th most
> Firearm background checks, Jan-Feb 2022: 19,445 — 12th fewest
> Change in background checks, Jan-Feb 2021 – Jan-Feb 2022: +1,614 (+8.3% — 10th largest increase)
> 2022 Population: 1,395,231 — 10th smallest
[in-text-ad]

9. Wyoming
> Firearm background checks per 1,000 residents, Jan-Feb 2023: 15.2
> Firearm background checks, Jan-Feb 2023: 8,832 — 5th fewest
> Most common type of firearm check: Handguns
> Firearm background checks per 1,000 residents, Jan-Feb 2022: 17.1 — 5th most
> Firearm background checks, Jan-Feb 2022: 9,956 — 5th fewest
> Change in background checks, Jan-Feb 2021 – Jan-Feb 2022: -1,124 (-11.3% — 6th largest decrease)
> 2022 Population: 581,381 — the smallest
[recirclink id=1206181]
8. Pennsylvania
> Firearm background checks per 1,000 residents, Jan-Feb 2023: 15.8
> Firearm background checks, Jan-Feb 2023: 204,772 — 3rd most
> Most common type of firearm check: Handguns
> Firearm background checks per 1,000 residents, Jan-Feb 2022: 15.2 — 7th most
> Firearm background checks, Jan-Feb 2022: 196,758 — 3rd most
> Change in background checks, Jan-Feb 2021 – Jan-Feb 2022: +8,014 (+4.1% — 12th smallest increase)
> 2022 Population: 12,972,008 — 5th largest
7. Montana
> Firearm background checks per 1,000 residents, Jan-Feb 2023: 16.1
> Firearm background checks, Jan-Feb 2023: 18,100 — 11th fewest
> Most common type of firearm check: Handguns
> Firearm background checks per 1,000 residents, Jan-Feb 2022: 16.2 — 6th most
> Firearm background checks, Jan-Feb 2022: 18,235 — 11th fewest
> Change in background checks, Jan-Feb 2021 – Jan-Feb 2022: -135 (-0.7% — 4th smallest decrease)
> 2022 Population: 1,122,867 — 8th smallest
[in-text-ad-2]
6. West Virginia
> Firearm background checks per 1,000 residents, Jan-Feb 2023: 16.7
> Firearm background checks, Jan-Feb 2023: 29,660 — 16th fewest
> Most common type of firearm check: Handguns
> Firearm background checks per 1,000 residents, Jan-Feb 2022: 15.1 — 8th most
> Firearm background checks, Jan-Feb 2022: 26,760 — 17th fewest
> Change in background checks, Jan-Feb 2021 – Jan-Feb 2022: +2,900 (+10.8% — 8th largest increase)
> 2022 Population: 1,775,156 — 12th smallest
5. Wisconsin
> Firearm background checks per 1,000 residents, Jan-Feb 2023: 17.3
> Firearm background checks, Jan-Feb 2023: 101,858 — 10th most
> Most common type of firearm check: Handguns
> Firearm background checks per 1,000 residents, Jan-Feb 2022: 17.7 — 4th most
> Firearm background checks, Jan-Feb 2022: 104,031 — 10th most
> Change in background checks, Jan-Feb 2021 – Jan-Feb 2022: -2,173 (-2.1% — 7th smallest decrease)
> 2022 Population: 5,892,539 — 20th largest
[in-text-ad]
4. Idaho
> Firearm background checks per 1,000 residents, Jan-Feb 2023: 18.5
> Firearm background checks, Jan-Feb 2023: 35,780 — 20th fewest
> Most common type of firearm check: Handguns
> Firearm background checks per 1,000 residents, Jan-Feb 2022: 17.9 — 3rd most
> Firearm background checks, Jan-Feb 2022: 34,776 — 20th fewest
> Change in background checks, Jan-Feb 2021 – Jan-Feb 2022: +1,004 (+2.9% — 8th smallest increase)
> 2022 Population: 1,939,033 — 13th smallest
[recirclink id=1205786]
3. Tennessee
> Firearm background checks per 1,000 residents, Jan-Feb 2023: 19.0
> Firearm background checks, Jan-Feb 2023: 133,798 — 6th most
> Most common type of firearm check: Handguns
> Firearm background checks per 1,000 residents, Jan-Feb 2022: 19.5 — 2nd most
> Firearm background checks, Jan-Feb 2022: 137,698 — 5th most
> Change in background checks, Jan-Feb 2021 – Jan-Feb 2022: -3,900 (-2.8% — 10th smallest decrease)
> 2022 Population: 7,051,339 — 15th largest
2. Alabama
> Firearm background checks per 1,000 residents, Jan-Feb 2023: 19.4
> Firearm background checks, Jan-Feb 2023: 98,330 — 13th most
> Most common type of firearm check: Handguns
> Firearm background checks per 1,000 residents, Jan-Feb 2022: 24.4 — the most
> Firearm background checks, Jan-Feb 2022: 123,956 — 7th most
> Change in background checks, Jan-Feb 2021 – Jan-Feb 2022: -25,626 (-20.7% — the largest decrease)
> 2022 Population: 5,074,296 — 24th largest
[in-text-ad-2]

1. Oregon
> Firearm background checks per 1,000 residents, Jan-Feb 2023: 23.4
> Firearm background checks, Jan-Feb 2023: 99,409 — 12th most
> Most common type of firearm check: Handguns
> Firearm background checks per 1,000 residents, Jan-Feb 2022: 14.4 — 10th most
> Firearm background checks, Jan-Feb 2022: 60,963 — 21st most
> Change in background checks, Jan-Feb 2021 – Jan-Feb 2022: +38,446 (+63.1% — 2nd largest increase)
> 2022 Population: 4,240,137 — 24th smallest
Methodology
To find the states where the most people bought gun so far this year, 24/7 Wall St. used FBI data from its National Instant Criminal Background Check System for the first two months of 2023. To get closer to an accurate approximation of gun sales, we excluded several categories of checks, including pawn shop transactions, returns, rentals, and rechecks, which are conducted periodically by some states on existing permit holders. We ranked states based on the combined number of gun checks in January and February 2023 per 1,000 people.
Even after removing some types of checks that are clearly unrelated to a new firearm purchase, because every state has different laws in terms of when background checks are required and different accounting practices, background checks still only serve as a rough approximation.
The most glaring example of this is Illinois, which alone accounted for about half of the background checks in the country after excluding the aforementioned categories of checks. Illinois no longer breaks down background checks separately, but did from July 2016 through July 2021. During the four full years of data, an average of 9.2% of Illinois’s non-private sale or gun-specific permit checks were non-rechecks. We applied that average to the most recent state figures to estimate Illinois’ count. This was done only because Illinois is such a glaring example of inconsistency and because there was historical data to produce an estimate.
There are likely other states for which the background check figures listed are inflated or underestimated proxies for gun sales.
Population data came from the U.S. Census Bureau’s Population and Housing Unit Estimates Program, and are for July of 2022, the most recent data available.
Contact [email protected] for any questions or corrections.