At the start of 2023, the United States government surpassed its debt limit of $31.4 trillion, and in the months since, the Department of the Treasury has taken extraordinary measures to fund public services. These measures are merely a stop-gap, however, and as early as June 1, 2023, the federal government may default on its debt – an outcome that would have disastrous economic consequences.
According to analysis from the Council of Economic Advisors, a protracted default could result in the loss of 8.3 million American jobs and a five percentage point increase to the unemployment rate, along with a 6.3% economic contraction in the third quarter alone.
But raising the debt ceiling requires cooperation between Congress and the president, and in the new era of divided government, the two sides appear to have hit a stalemate. House Republicans have signaled an unwillingness to raise the debt ceiling without significant concessions from the Biden Administration – concessions the White House has flatly stated it is not willing to make. (Here is a look at the members of Congress who didn’t last 100 days on the job.)
While raising the debt ceiling is a practical necessity, concerns over rapid growth in government spending are not entirely unfounded.
Precipitated in part by higher government spending during the wars in Iraq and Afghanistan as well as the COVID-19 pandemic – and in conjunction with reduced revenue from tax cuts and economic recessions – the national debt has ballooned by 430% over the last two decades alone.
Already grappling with record levels of debt, the federal government has again exceeded its statutory spending limit and must raise its borrowing limit to remain solvent. This routine procedure has happened 78 times since 1960 – during Republican and Democratic presidencies. But this year, the process promises to be anything but straightforward.
Raising the debt ceiling requires cooperation between Congress and the president, and in the new era of divided government, any bipartisan agreement is likely to be hard fought. House Republicans have signaled an unwillingness to raise the debt ceiling without significant concessions from the Biden Administration – concessions the White House has flatly stated it is not willing to make. Failure to reach an agreement would be an unprecedented event with dire consequences for the U.S. economy and global financial markets. (Here is a look at the members of Congress who didn’t last 100 days on the job.)
Using data from the U.S. Treasury Department, 24/7 Wall St. identified the U.S. presidents who oversaw the largest increase to the national debt in the last 100 years. Not all presidents were in office for the same amount of time, so to compare the administrations, we ranked each president – from Herbert Hoover to Joe Biden – on the compound annual growth rate of the national debt (unadjusted for inflation) during their time in office.
No president in the last 100 years has added more to the national debt on an annual basis than Franklin Roosevelt, a Democrat. Faced with World War II, as well as the Great Depression, Roosevelt served during an extraordinary time. Over the 12 years of his administration, the national debt climbed from $22.5 billion to $258.7 billion, at a compound annual growth rate of 22.6%.
Still, of the five presidents who added the most to the national debt each year, four were Republicans: Gerald Ford, Ronald Reagan, George H.W. Bush, and George W. Bush. Of them, Reagan added the most debt each year, with a compound annual growth rate of 14.1%. (Here is a look at the 13 leading Republican presidential candidates for 2024.)
It is important to note that while the president is responsible for setting the national budget each year, administrations have only limited control over the national debt while they are in office. Factors outside the control of the White House, including macroeconomic circumstances, geopolitical crises, global pandemics, and laws set by previous administrations that impact government spending and revenue, affect the national budget.
Click here to see which US presidents the national debt increased the most under.
Click here to see our detailed methodology.

16. Harry S. Truman (in office from 1945-1953)
> Compound annual growth rate for years in office: 0.4% ($923.6 million)
> Overall change in national debt during presidency: +2.9% (+$7.4 billion)
> Total federal debt first year in office: $258.7 billion (113.5% of GDP)
> Total federal debt final year in office: $266.1 billion (68.4% of GDP)
> Party affiliation: Democratic
[in-text-ad]

15. Dwight Eisenhower (in office from 1953-1961)
> Compound annual growth rate for years in office: 1.0% ($2.9 billion)
> Overall change in national debt during presidency: +8.6% (+$22.9 billion)
> Total federal debt first year in office: $266.1 billion (68.4% of GDP)
> Total federal debt final year in office: $289.0 billion (51.4% of GDP)
> Party affiliation: Republican
[recirclink id=1182369]
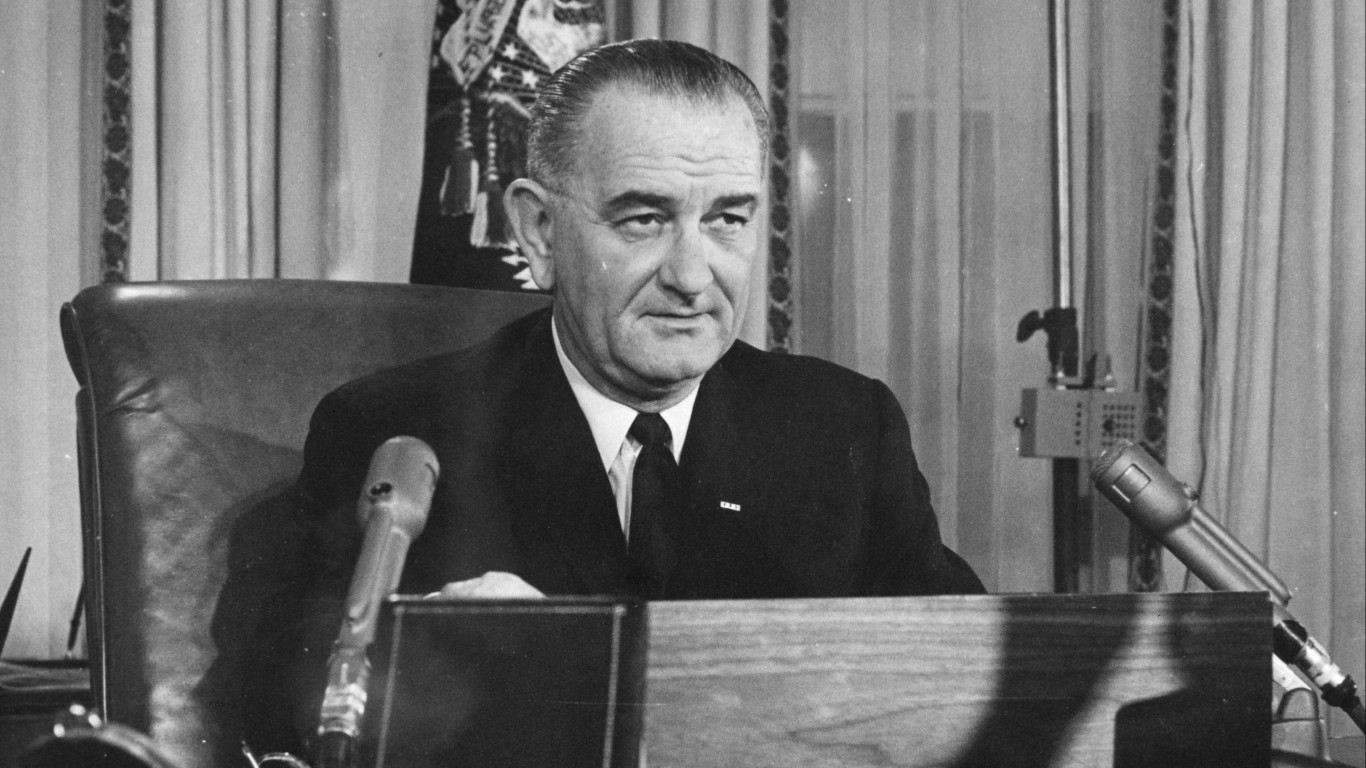
14. Lyndon Johnson (in office from 1963-1969)
> Compound annual growth rate for years in office: 2.5% ($8.0 billion)
> Overall change in national debt during presidency: +15.7% (+$47.9 billion)
> Total federal debt first year in office: $305.9 billion (48.0% of GDP)
> Total federal debt final year in office: $353.7 billion (34.8% of GDP)
> Party affiliation: Democratic

13. John F. Kennedy (in office from 1961-1963)
> Compound annual growth rate for years in office: 2.9% ($8.4 billion)
> Overall change in national debt during presidency: +5.8% (+$16.9 billion)
> Total federal debt first year in office: $289.0 billion (51.4% of GDP)
> Total federal debt final year in office: $305.9 billion (48.0% of GDP)
> Party affiliation: Democratic
[in-text-ad-2]

12. William J. Clinton (in office from 1993-2001)
> Compound annual growth rate for years in office: 3.5% ($174.5 billion)
> Overall change in national debt during presidency: +31.6% (+$1.4 trillion)
> Total federal debt first year in office: $4.4 trillion (64.3% of GDP)
> Total federal debt final year in office: $5.8 trillion (54.9% of GDP)
> Party affiliation: Democratic
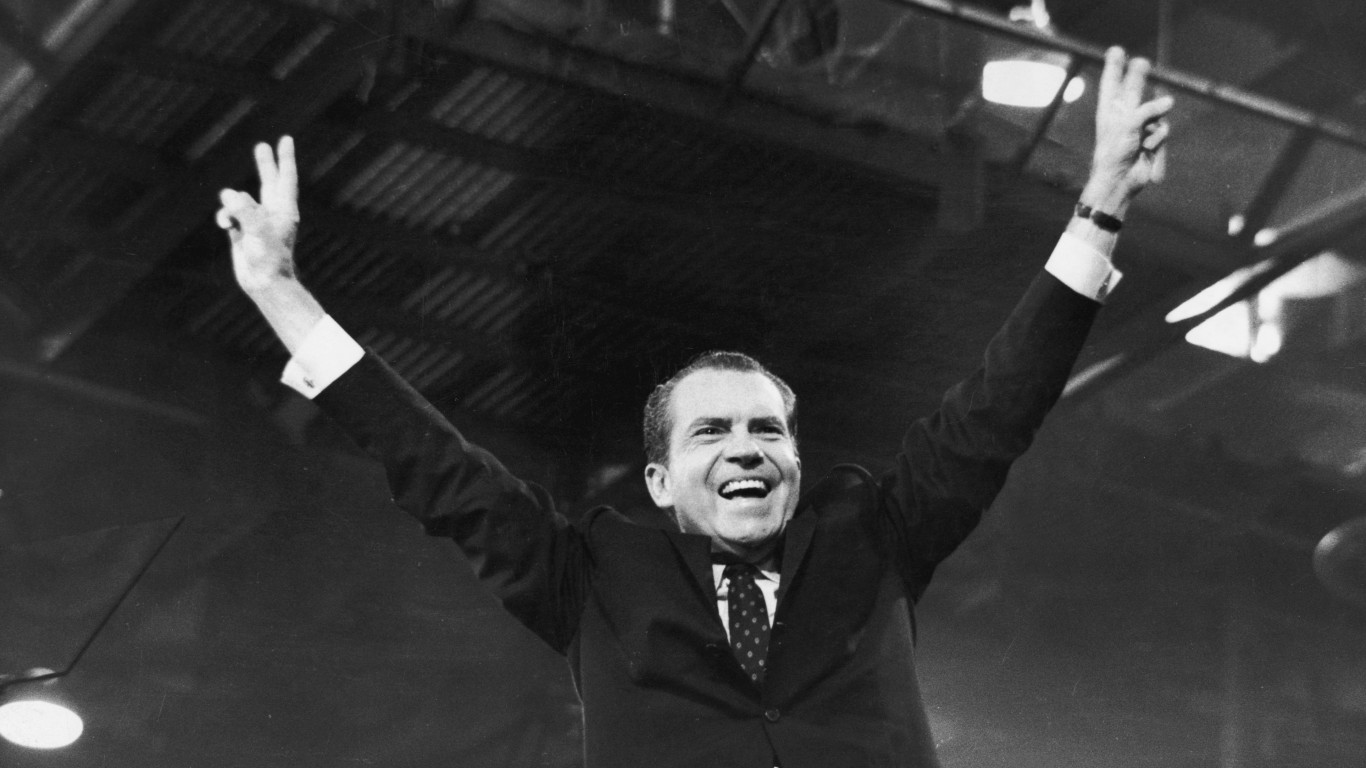
11. Richard Nixon (in office from 1969-1974)
> Compound annual growth rate for years in office: 6.1% ($24.3 billion)
> Overall change in national debt during presidency: +34.3% (+$121.3 billion)
> Total federal debt first year in office: $353.7 billion (34.8% of GDP)
> Total federal debt final year in office: $475.1 billion (30.7% of GDP)
> Party affiliation: Republican
[in-text-ad]

10. Barack Obama (in office from 2009-2017)
> Compound annual growth rate for years in office: 6.9% ($1.0 trillion)
> Overall change in national debt during presidency: +70.0% (+$8.3 trillion)
> Total federal debt first year in office: $11.9 trillion (82.3% of GDP)
> Total federal debt final year in office: $20.2 trillion (103.9% of GDP)
> Party affiliation: Democratic
[recirclink id=1155146]

9. Herbert Hoover (in office from 1929-1933)
> Compound annual growth rate for years in office: 7.4% ($1.4 billion)
> Overall change in national debt during presidency: +33.1% (+$5.6 billion)
> Total federal debt first year in office: $16.9 billion (16.2% of GDP)
> Total federal debt final year in office: $22.5 billion (39.4% of GDP)
> Party affiliation: Republican

8. Joe Biden (in office from 2021-Present)
> Compound annual growth rate for years in office: 8.8% ($2.5 trillion)
> Overall change in national debt during presidency: +8.8% (+$2.5 trillion)
> Total federal debt first year in office: $28.4 trillion (121.9% of GDP)
> Total federal debt as of September 2022: $30.9 trillion (120.2% of GDP)
> Party affiliation: Democratic
[in-text-ad-2]

7. Donald J. Trump (in office from 2017-2021)
> Compound annual growth rate for years in office: 8.9% ($2.0 trillion)
> Overall change in national debt during presidency: +40.4% (+$8.2 trillion)
> Total federal debt first year in office: $20.2 trillion (103.9% of GDP)
> Total federal debt final year in office: $28.4 trillion (121.9% of GDP)
> Party affiliation: Republican

6. Jimmy Carter (in office from 1977-1981)
> Compound annual growth rate for years in office: 9.3% ($74.8 billion)
> Overall change in national debt during presidency: +42.8% (+$299.0 billion)
> Total federal debt first year in office: $698.8 billion (33.6% of GDP)
> Total federal debt final year in office: $997.9 billion (31.1% of GDP)
> Party affiliation: Democratic
[in-text-ad]

5. George W. Bush (in office from 2001-2009)
> Compound annual growth rate for years in office: 9.4% ($762.8 billion)
> Overall change in national debt during presidency: +105.1% (+$6.1 trillion)
> Total federal debt first year in office: $5.8 trillion (54.9% of GDP)
> Total federal debt final year in office: $11.9 trillion (82.3% of GDP)
> Party affiliation: Republican
[recirclink id=1168269]

4. George H. W. Bush (in office from 1989-1993)
> Compound annual growth rate for years in office: 11.5% ($388.5 billion)
> Overall change in national debt during presidency: +54.4% (+$1.6 trillion)
> Total federal debt first year in office: $2.9 trillion (50.6% of GDP)
> Total federal debt final year in office: $4.4 trillion (64.3% of GDP)
> Party affiliation: Republican
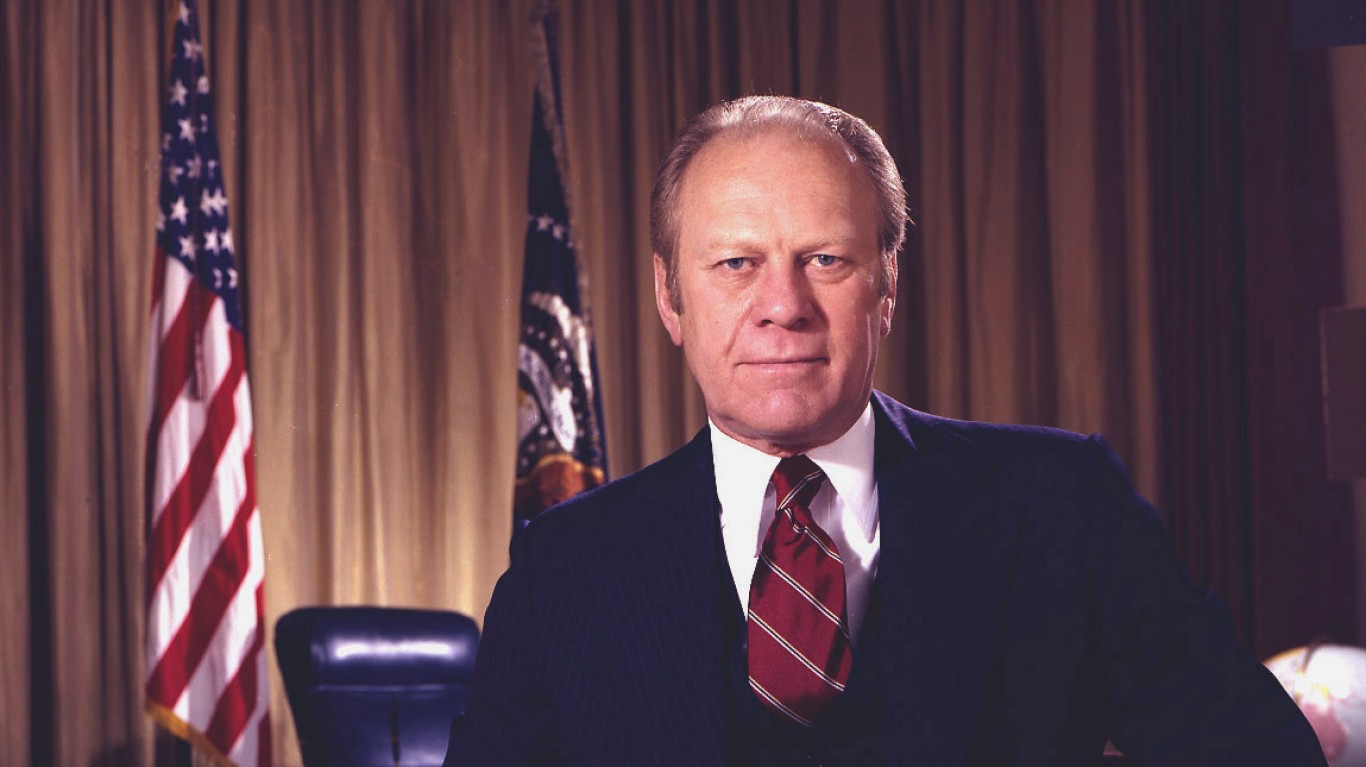
3. Gerald Ford (in office from 1974-1977)
> Compound annual growth rate for years in office: 13.7% ($74.6 billion)
> Overall change in national debt during presidency: +47.1% (+$223.8 billion)
> Total federal debt first year in office: $475.1 billion (30.7% of GDP)
> Total federal debt final year in office: $698.8 billion (33.6% of GDP)
> Party affiliation: Republican
[in-text-ad-2]

2. Ronald Reagan (in office from 1981-1989)
> Compound annual growth rate for years in office: 14.1% ($232.4 billion)
> Overall change in national debt during presidency: +186.4% (+$1.9 trillion)
> Total federal debt first year in office: $997.9 billion (31.1% of GDP)
> Total federal debt final year in office: $2.9 trillion (50.6% of GDP)
> Party affiliation: Republican

1. Franklin D. Roosevelt (in office from 1933-1945)
> Compound annual growth rate for years in office: 22.6% ($19.7 billion)
> Overall change in national debt during presidency: +1,047.7% (+$236.1 billion)
> Total federal debt first year in office: $22.5 billion (39.4% of GDP)
> Total federal debt final year in office: $258.7 billion (113.5% of GDP)
> Party affiliation: Democratic
Methodology
To determine the U.S. Presidents who oversaw the largest increase to the national debt in the last 100 years, 24/7 Wall St. reviewed total government debt each year since 1929 with data from the U.S. Treasury Department. For each presidential administration, we calculated the compound annual growth rate of the national debt, from their first year in office to their last. Debt figures are not adjusted for inflation. It is important to note that due to data limitations, debt measurements do not align with each presidential administration to the day.
We also reviewed data on U.S. gross domestic product, unadjusted for inflation, each year from the Bureau of Economic Analysis. We used GDP data to calculate debt as a share of GDP, or the debt-to-GDP ratio.
Contact [email protected] for any questions or corrections.