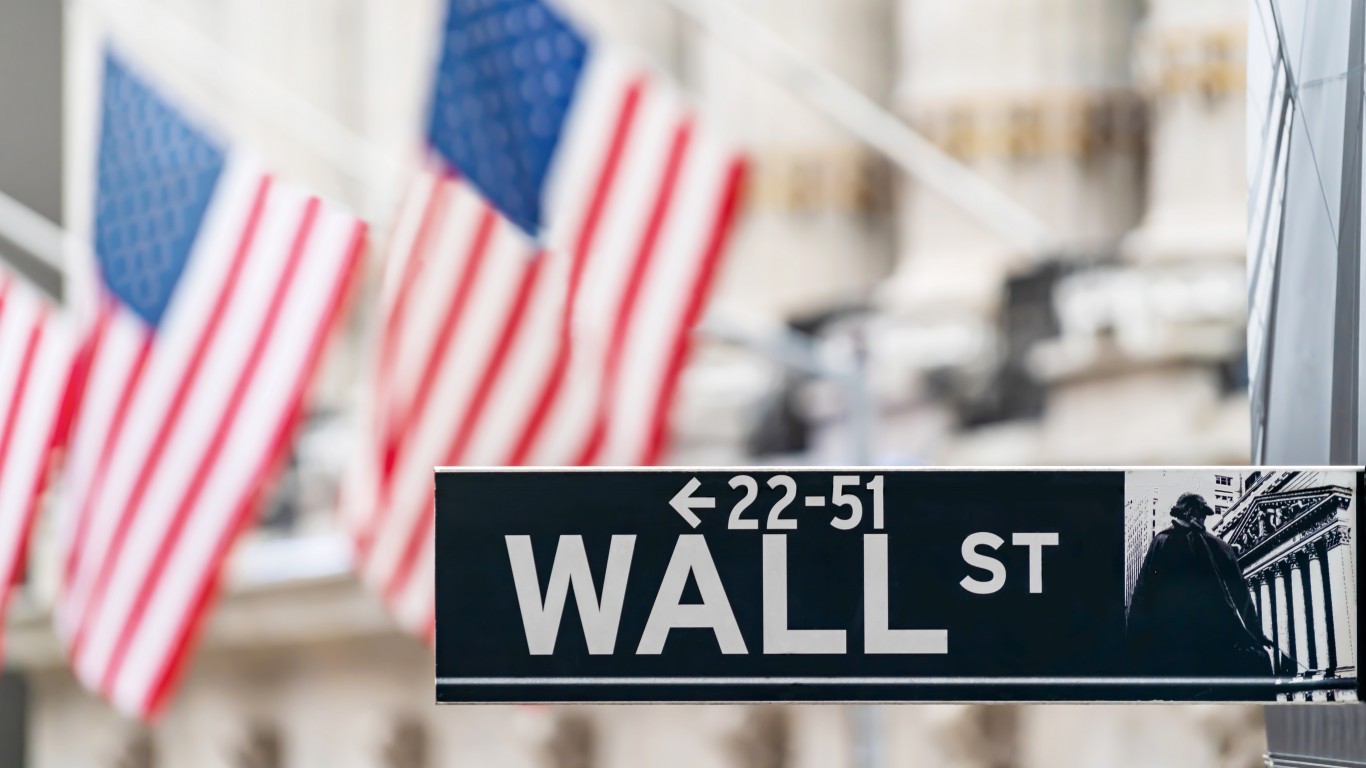
Participation in the stock market is at an all-time high in the United States. Whether as retail investors or under a professionally managed fund, 58% of American households owned stocks in 2022, according to the latest available estimates from the Federal Reserve.
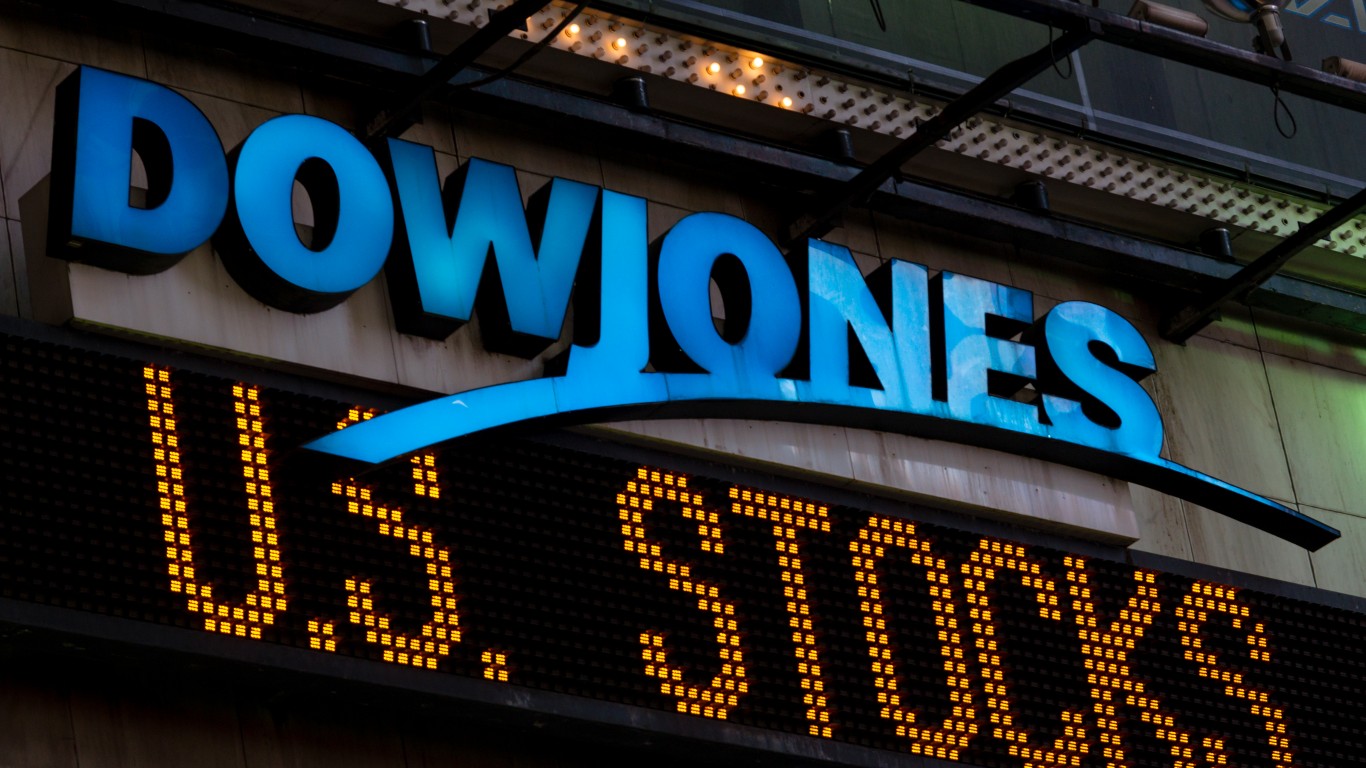
While the stock market can be volatile — and no investment is guaranteed to generate returns — over a long enough time horizon, history has shown that the broader market trends upwards. Over the last five years alone, the Dow Jones Industrial Average — a weighted index of 30 major American stocks — climbed by over 44%.
The price of an individual stock is driven by supply and demand for shares of the company, factors largely influenced by corporate fundamentals. Meanwhile, the wider market — typically gauged by indexes like the DJIA — is subject to multiple macroeconomic forces, including consumer sentiment, inflation, interest rates, and even politics.
While U.S. presidents have no direct influence over the stock market’s performance, they do control certain conditions that can affect investor sentiment and behavior. These include, but are not limited to, Fed chair appointments, business and market regulations, federal spending programs, and tax cuts. While these are only some of the many factors that can move markets, in the minds of voters, deserving or not, presidents are often credited or blamed for the stock market’s performance. (Here is a look at the presidents who added the most to the national debt.)
Using historical data on the DJIA over the last 100 years, 24/7 Wall St. identified the presidents who led during the biggest stock market booms and busts. We ranked every president since Warren Harding on the change in the DJIA during their time in office. DJIA performance is based on the change in the average, inflation adjusted, closing price from the president’s first year in office to the last. Average year-end closing prices do not align with the first or last day of any president, and as a result, we used the closest annual average. For example, if a president left office in March, calculations were made with the average DJIA closing price from the previous year.
The DJIA’s performance during the administrations of the 18 presidents on this list ranges from a 79% contraction to 204% growth. Of the five highest ranking presidents, two were Democrats, and three were Republicans. Meanwhile, three of three of the lowest ranking presidents were Democrats, and two were Republicans. (Here is a look at the federal agencies wasting the most taxpayer money.)
The lowest ranking president on this list took office at the end of the 1920’s, a decade of one of the largest bull markets in history, and left in 1933, when the country was several years into the Great Depression. The highest ranking president, meanwhile, was in office for most of the 1990s and the dotcom bubble era.
Why It Matters
Presidents have little direct influence over the stock market. Still, a president’s decisions and priorities can have meaningful bearing on investor sentiment. Right or wrong, the stock market’s performance can also influence public opinion of political leadership. The economy is often top of mind for millions of American voters around election time, and for many of those voters, perceptions of the economy are informed — at least in part — by the stock market.
18. Herbert Hoover (in office March 1929 – March 1933)
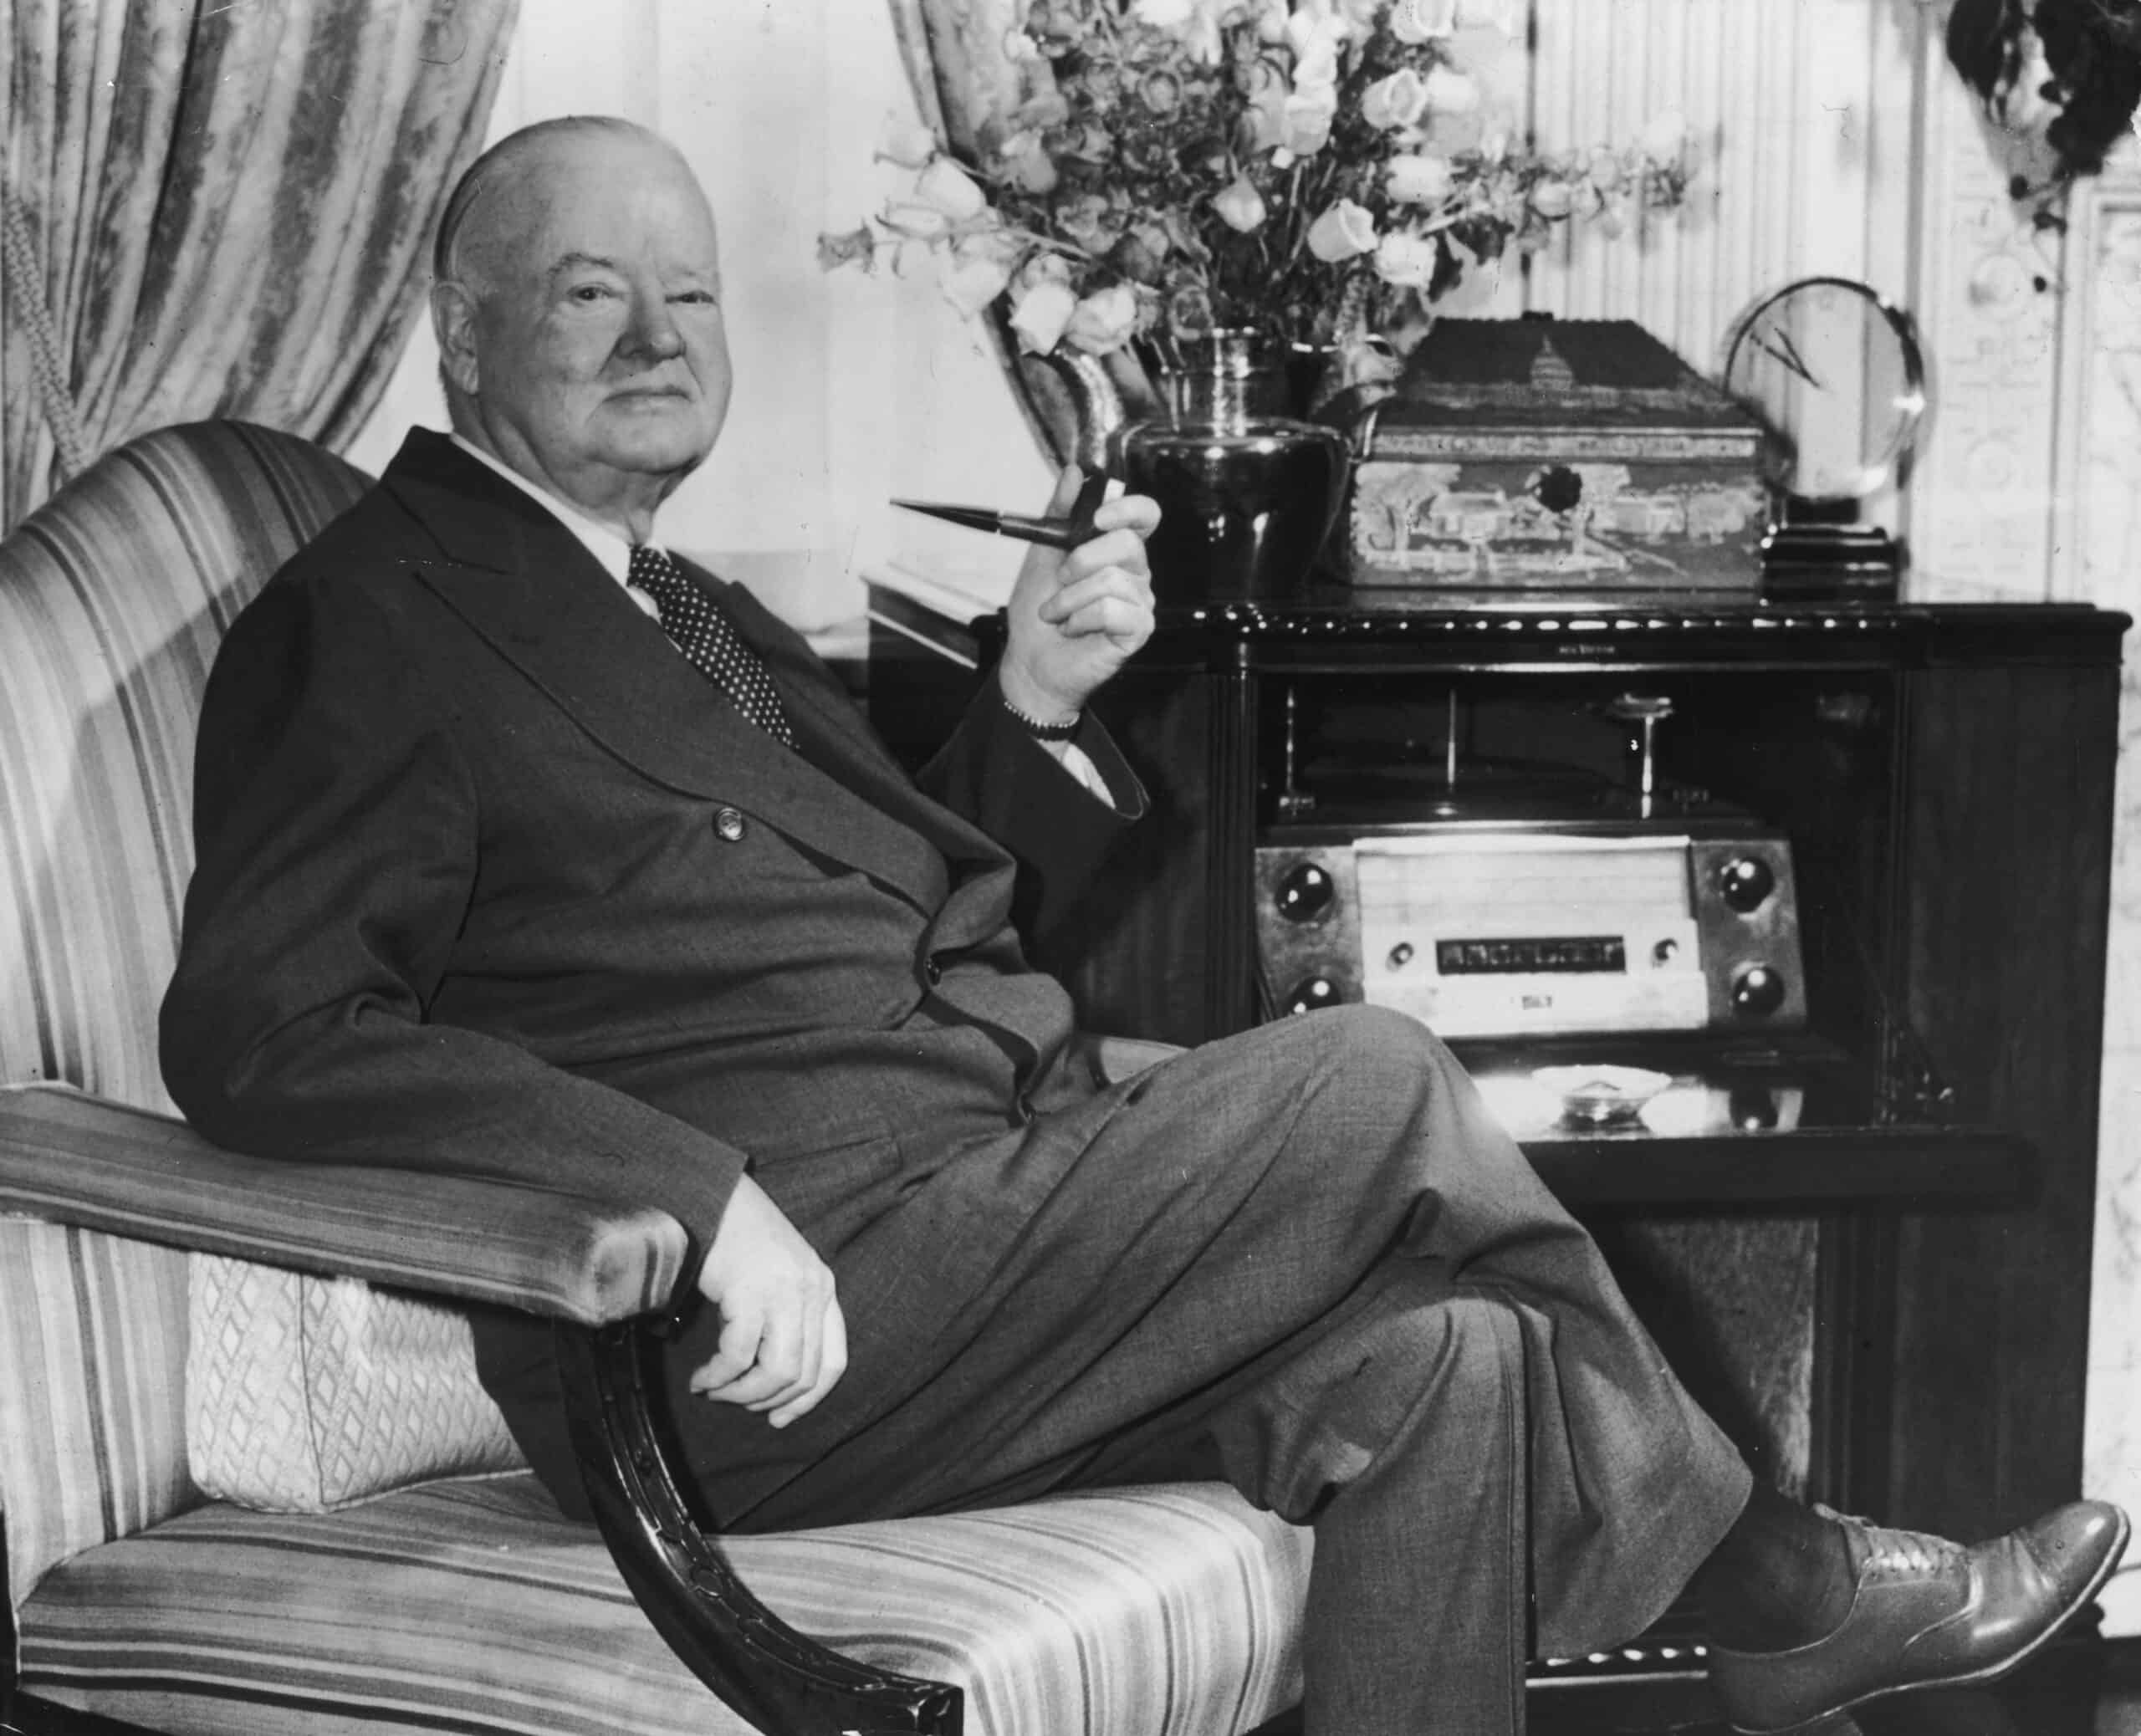
- Change in avg. annual DJIA during presidency: -79.4%
- Avg. DJIA closing price in 1932: 64.53
- Avg. DJIA closing price in 1929: 313.54
- Party affiliation: Republican
17. Richard M. Nixon (in office Jan. 1969 – August 1974)
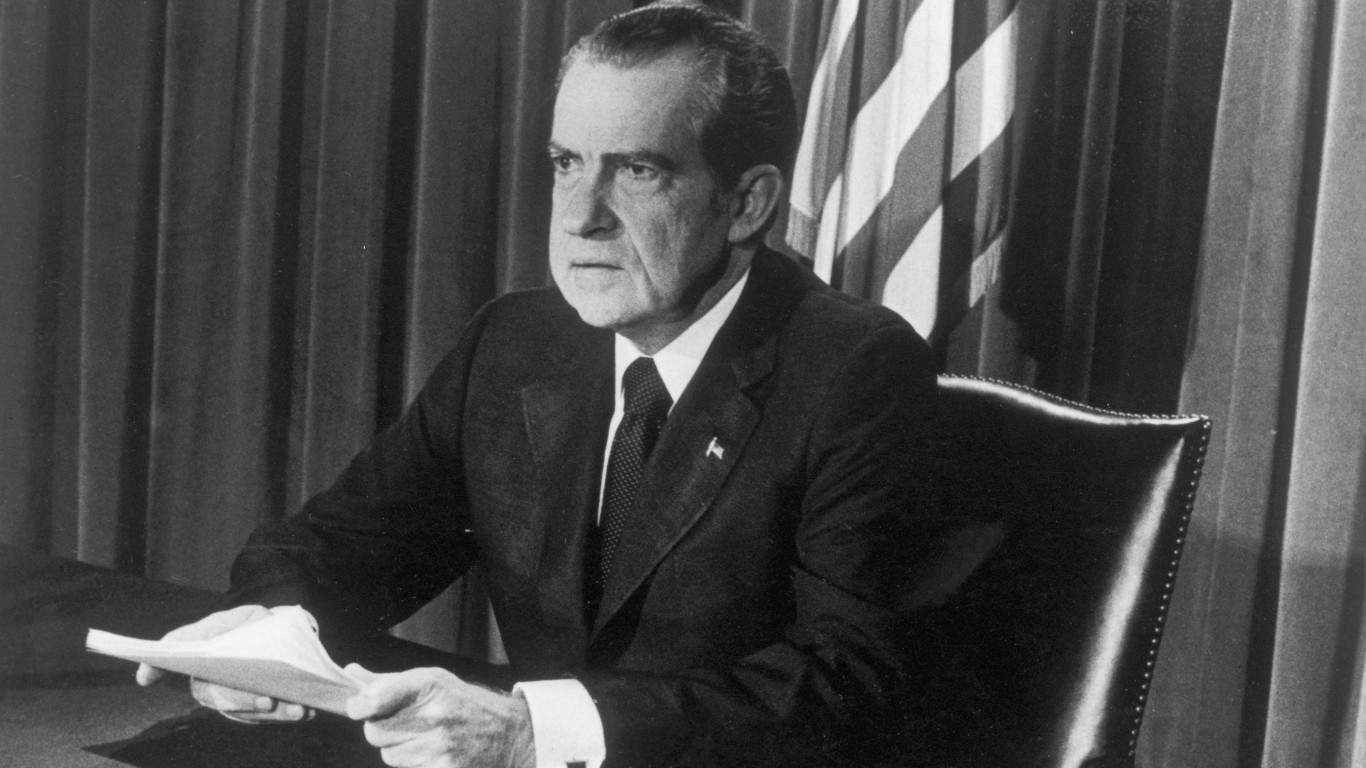
- Change in avg. annual DJIA during presidency: -13.3%
- Avg. DJIA closing price in 1974: 759.13
- Avg. DJIA closing price in 1969: 875.72
- Party affiliation: Republican
16. Jimmy Carter (in office Jan. 1977 – Jan. 1981)
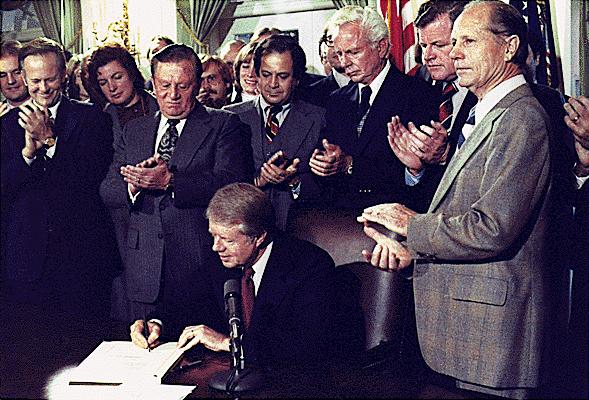
- Change in avg. annual DJIA during presidency: -0.4%
- Avg. DJIA closing price in 1980: 891.14
- Avg. DJIA closing price in 1977: 894.37
- Party affiliation: Democratic
15. John F. Kennedy (in office Jan. 1961 – Nov. 1963)
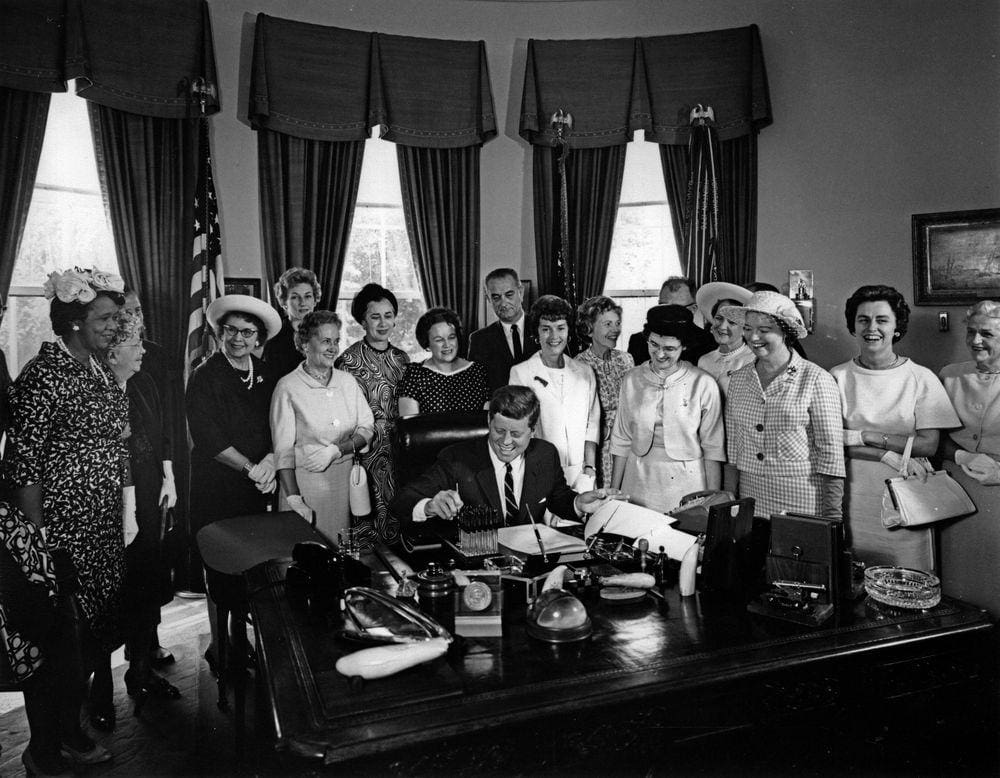
- Change in avg. annual DJIA during presidency: +3.3%
- Avg. DJIA closing price in 1963: 714.69
- Avg. DJIA closing price in 1961: 691.74
- Party affiliation: Democratic
14. Lyndon B. Johnson (in office Nov. 1963 – Jan. 1969)
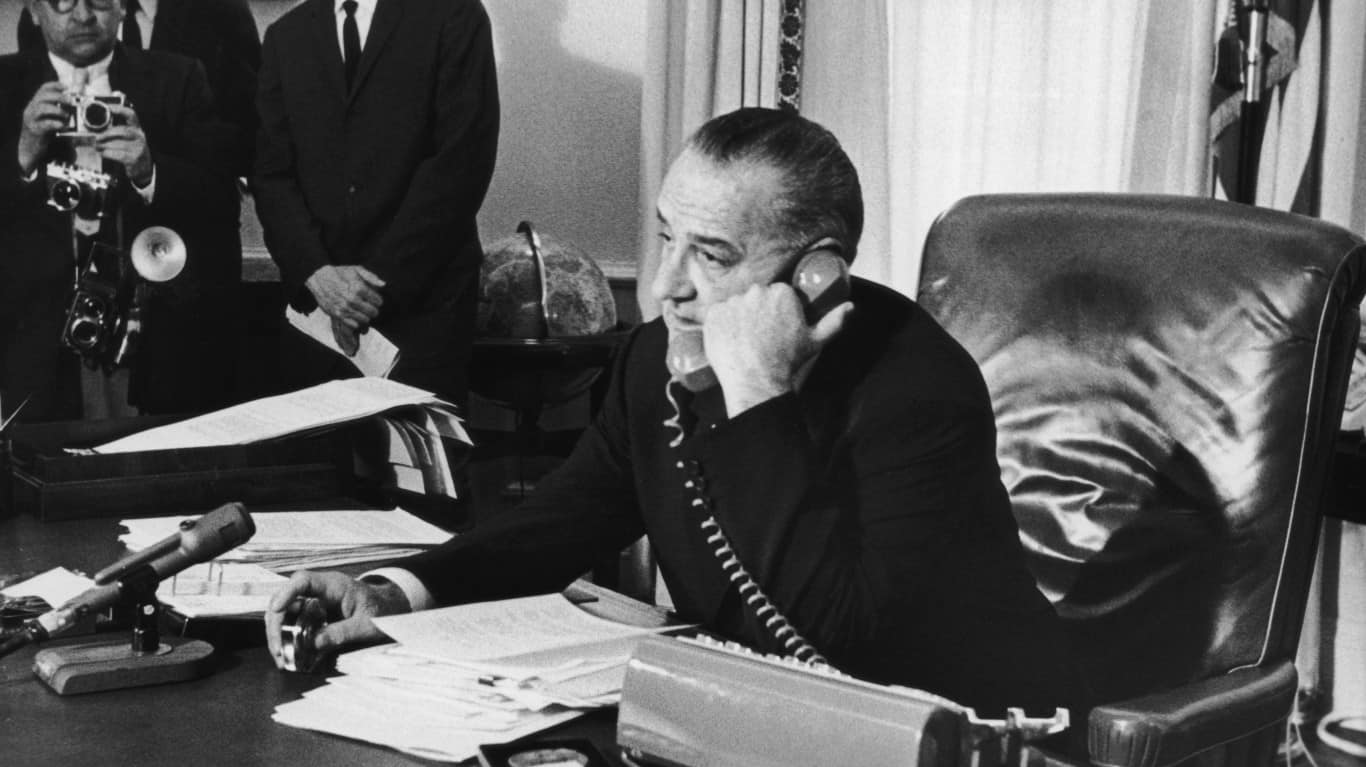
- Change in avg. annual DJIA during presidency: +8.4%
- Avg. DJIA closing price in 1968: 903.96
- Avg. DJIA closing price in 1964: 834.09
- Party affiliation: Democratic
13. George W. Bush (in office Jan. 2001 – Jan. 2009)
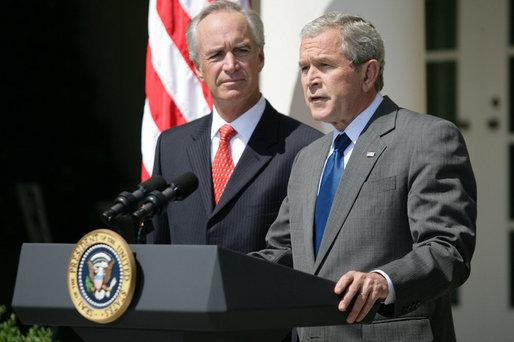
- Change in avg. annual DJIA during presidency: +10.2%
- Avg. DJIA closing price in 2008: 11,244.06
- Avg. DJIA closing price in 2001: 10,199.29
- Party affiliation: Republican
12. Joseph R. Biden Jr. (in office Jan. 2021 – present)
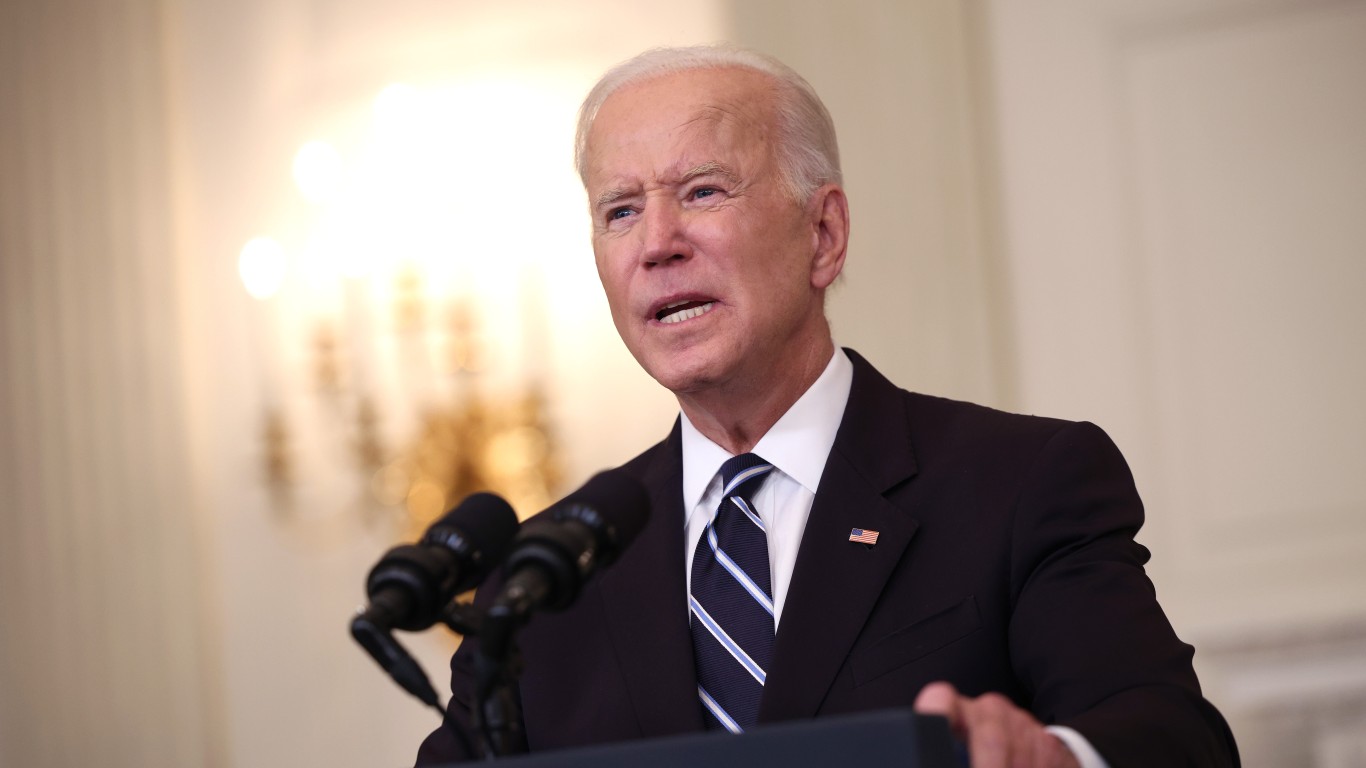
- Change in avg. annual DJIA during presidency: +13.0%
- Avg. DJIA closing price in 2024: 38,496.16
- Avg. DJIA closing price in 2021: 34,055.29
- Party affiliation: Democratic
11. Gerald R. Ford (in office August 1974 – Jan.. 1977)
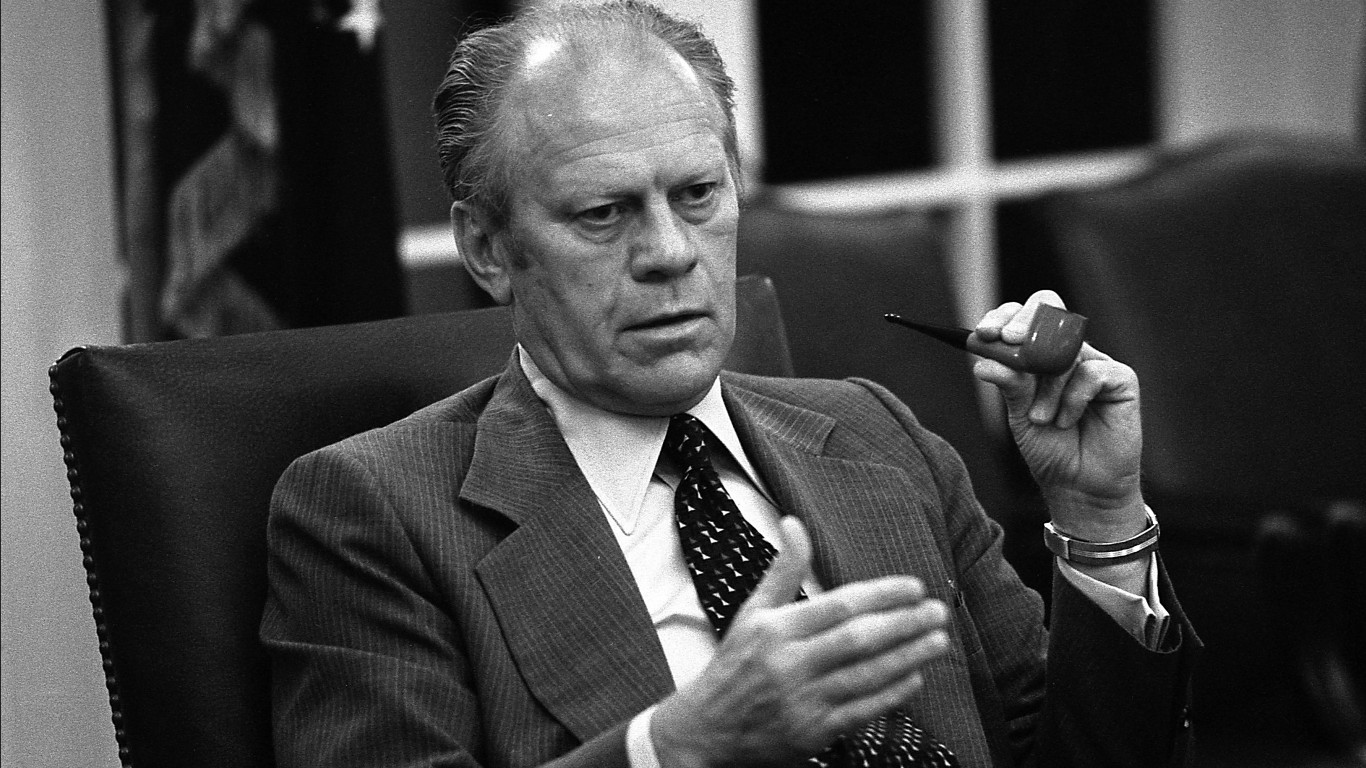
- Change in avg. annual DJIA during presidency: +21.5%
- Avg. DJIA closing price in 1976: 975.20
- Avg. DJIA closing price in 1975: 802.89
- Party affiliation: Republican
10. Donald J. Trump (in office Jan. 2017 – Jan. 2021)
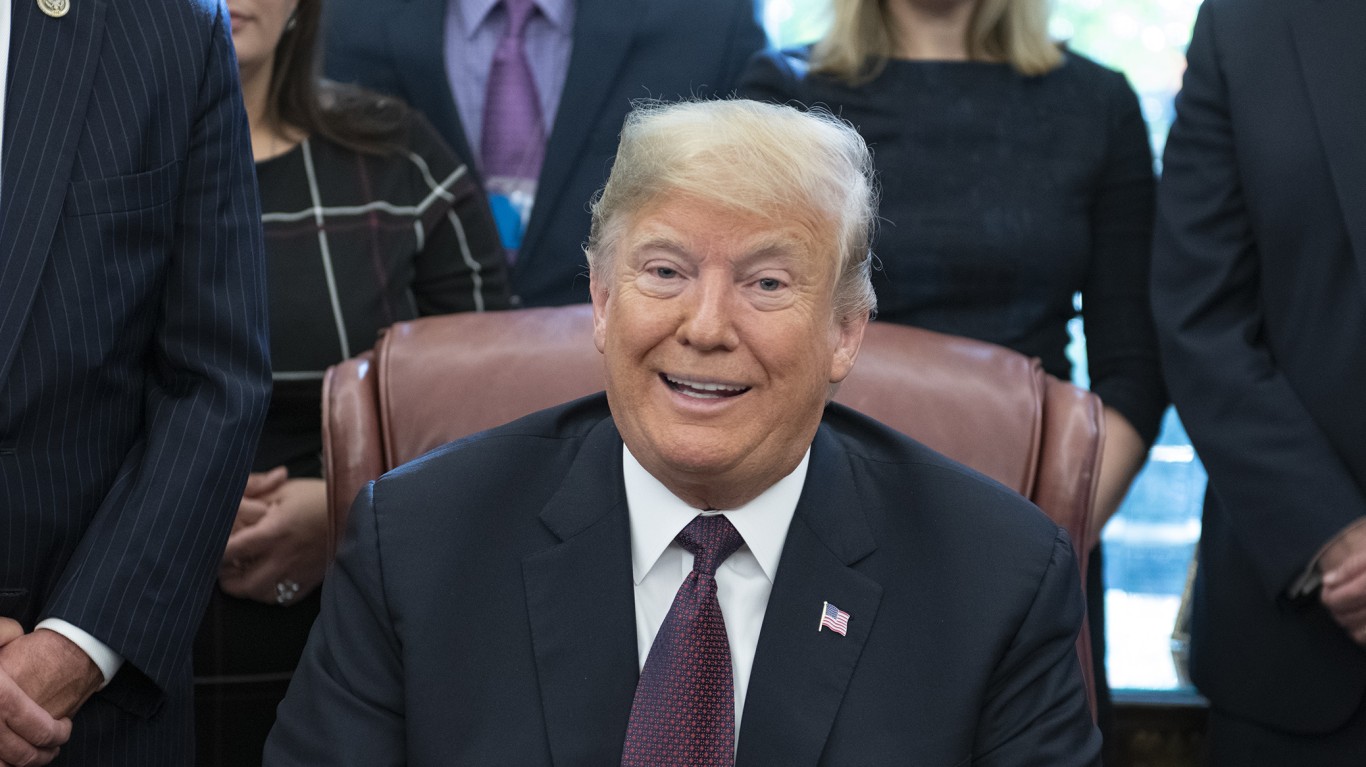
- Change in avg. annual DJIA during presidency: +23.6%
- Avg. DJIA closing price in 2020: 26,890.67
- Avg. DJIA closing price in 2017: 21,750.20
- Party affiliation: Republican
9. Warren G. Harding (in office March 1921 – August 1923)
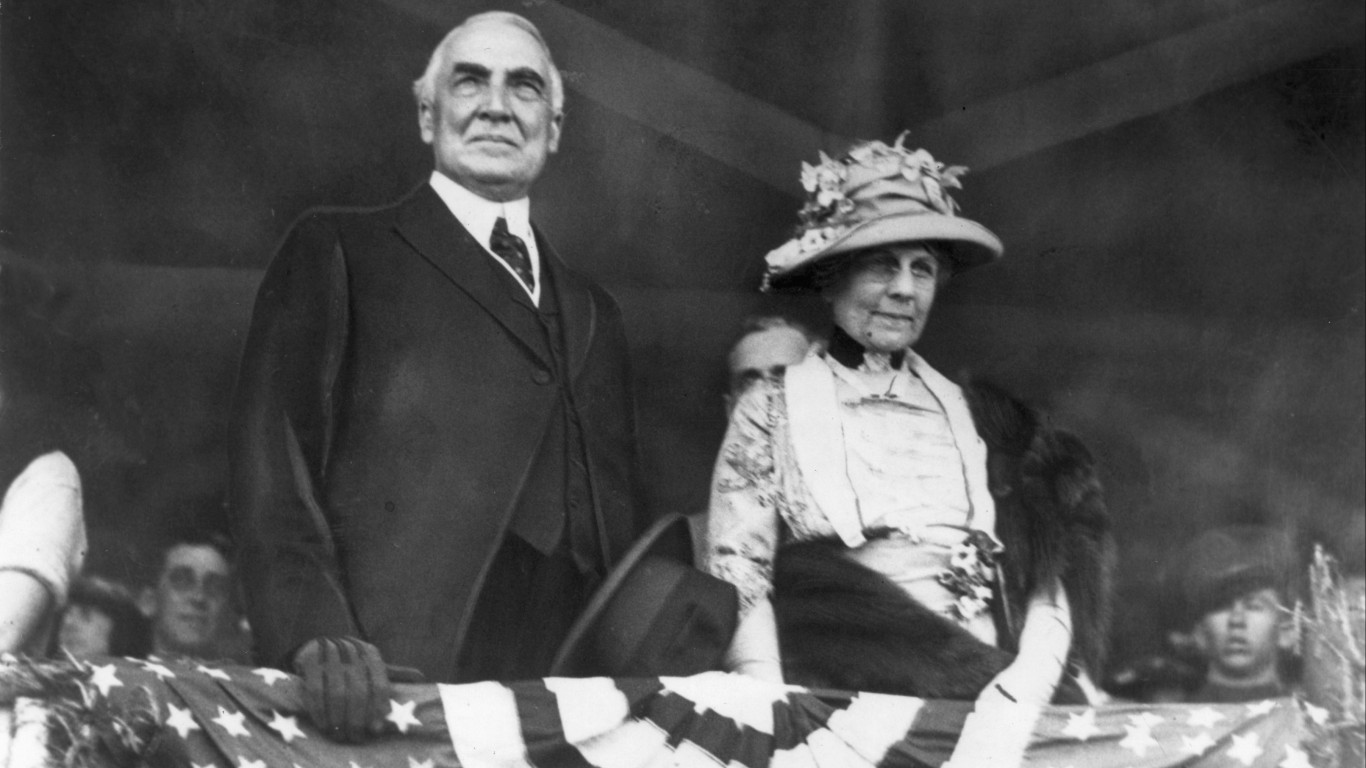
- Change in avg. annual DJIA during presidency: +29.3%
- Avg. DJIA closing price in 1923: 94.87
- Avg. DJIA closing price in 1921: 73.39
- Party affiliation: Republican
8. George H. W. Bush (in office Jan. 1989 – Jan. 1993)
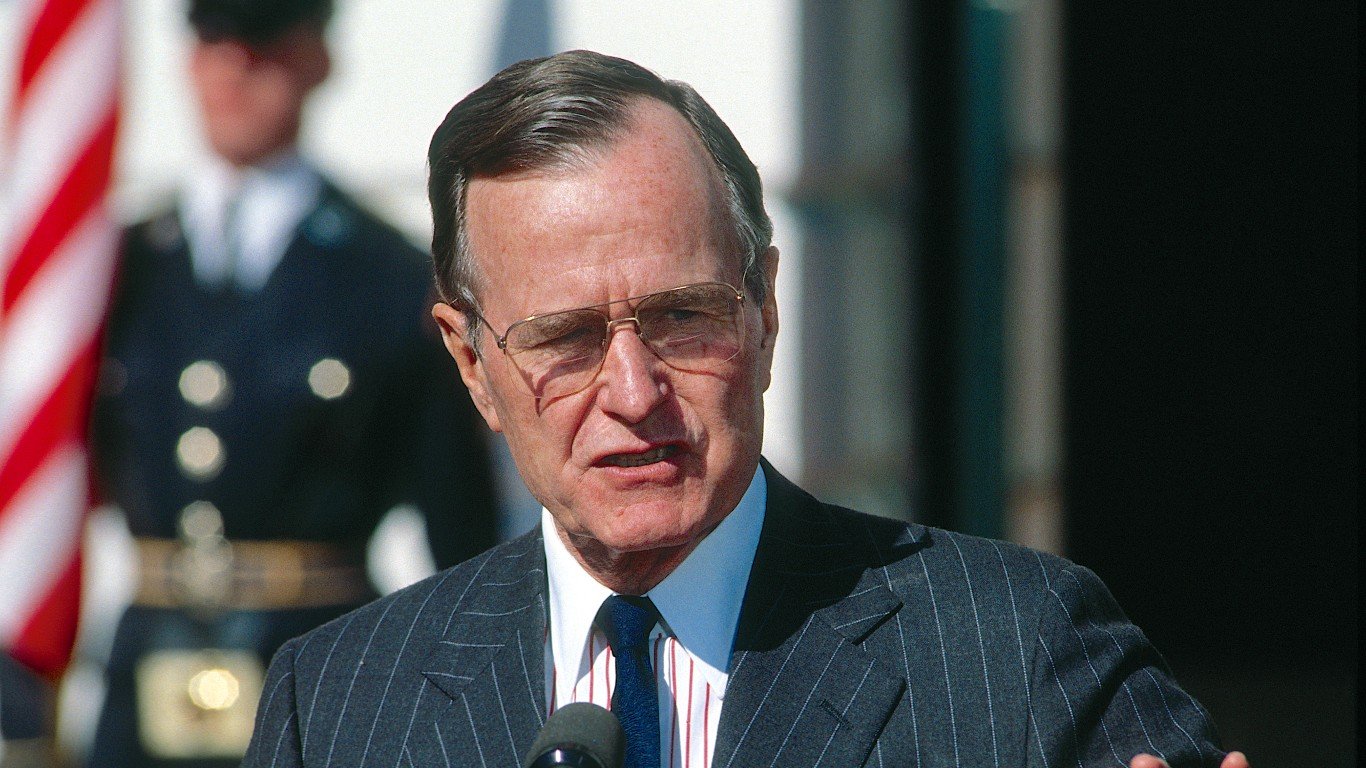
- Change in avg. annual DJIA during presidency: +30.8%
- Avg. DJIA closing price in 1992: 3,284.08
- Avg. DJIA closing price in 1989: 2,510.33
- Party affiliation: Republican
7. Harry S. Truman (in office April 1945 – Jan. 1953)
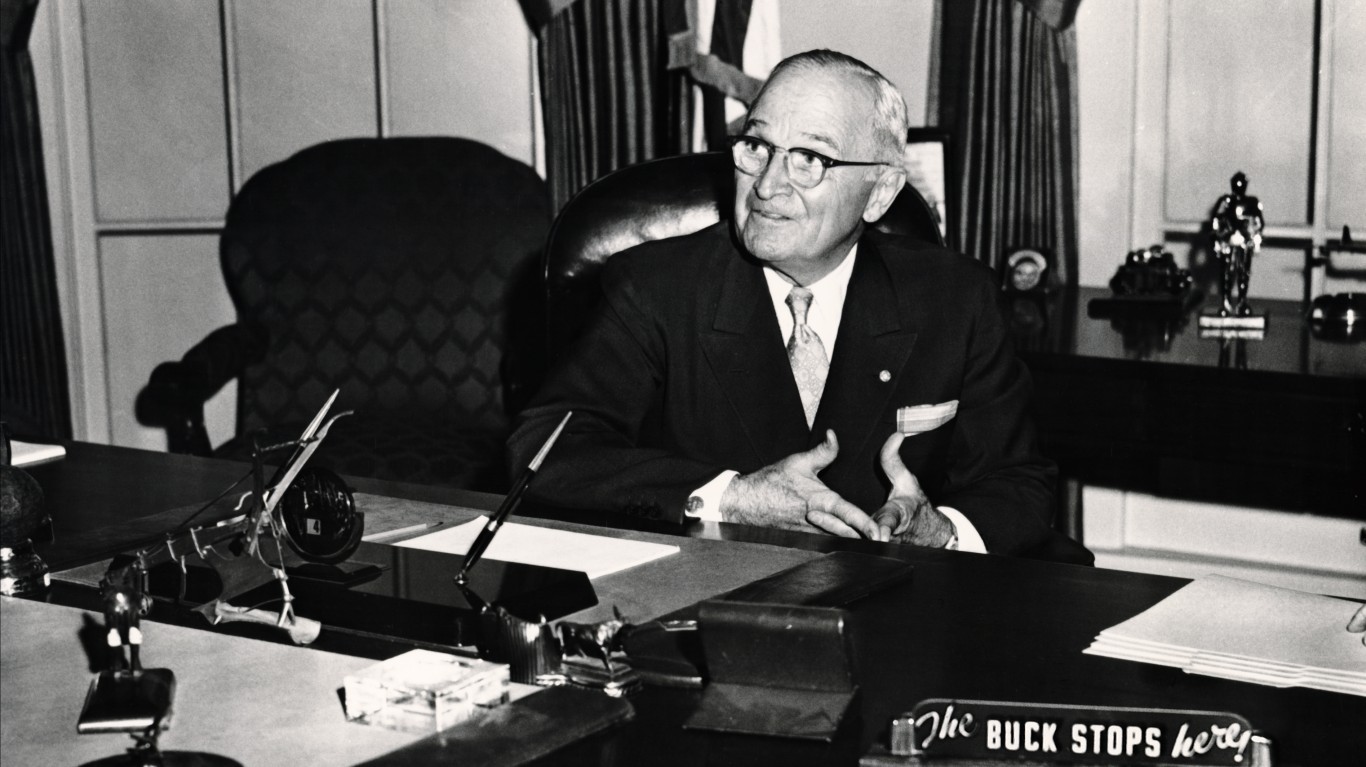
- Change in avg. annual DJIA during presidency: +59.3%
- Avg. DJIA closing price in 1952: 270.35
- Avg. DJIA closing price in 1945: 169.66
- Party affiliation: Democratic
6. Franklin D. Roosevelt (in office March 1933 – April 1945)
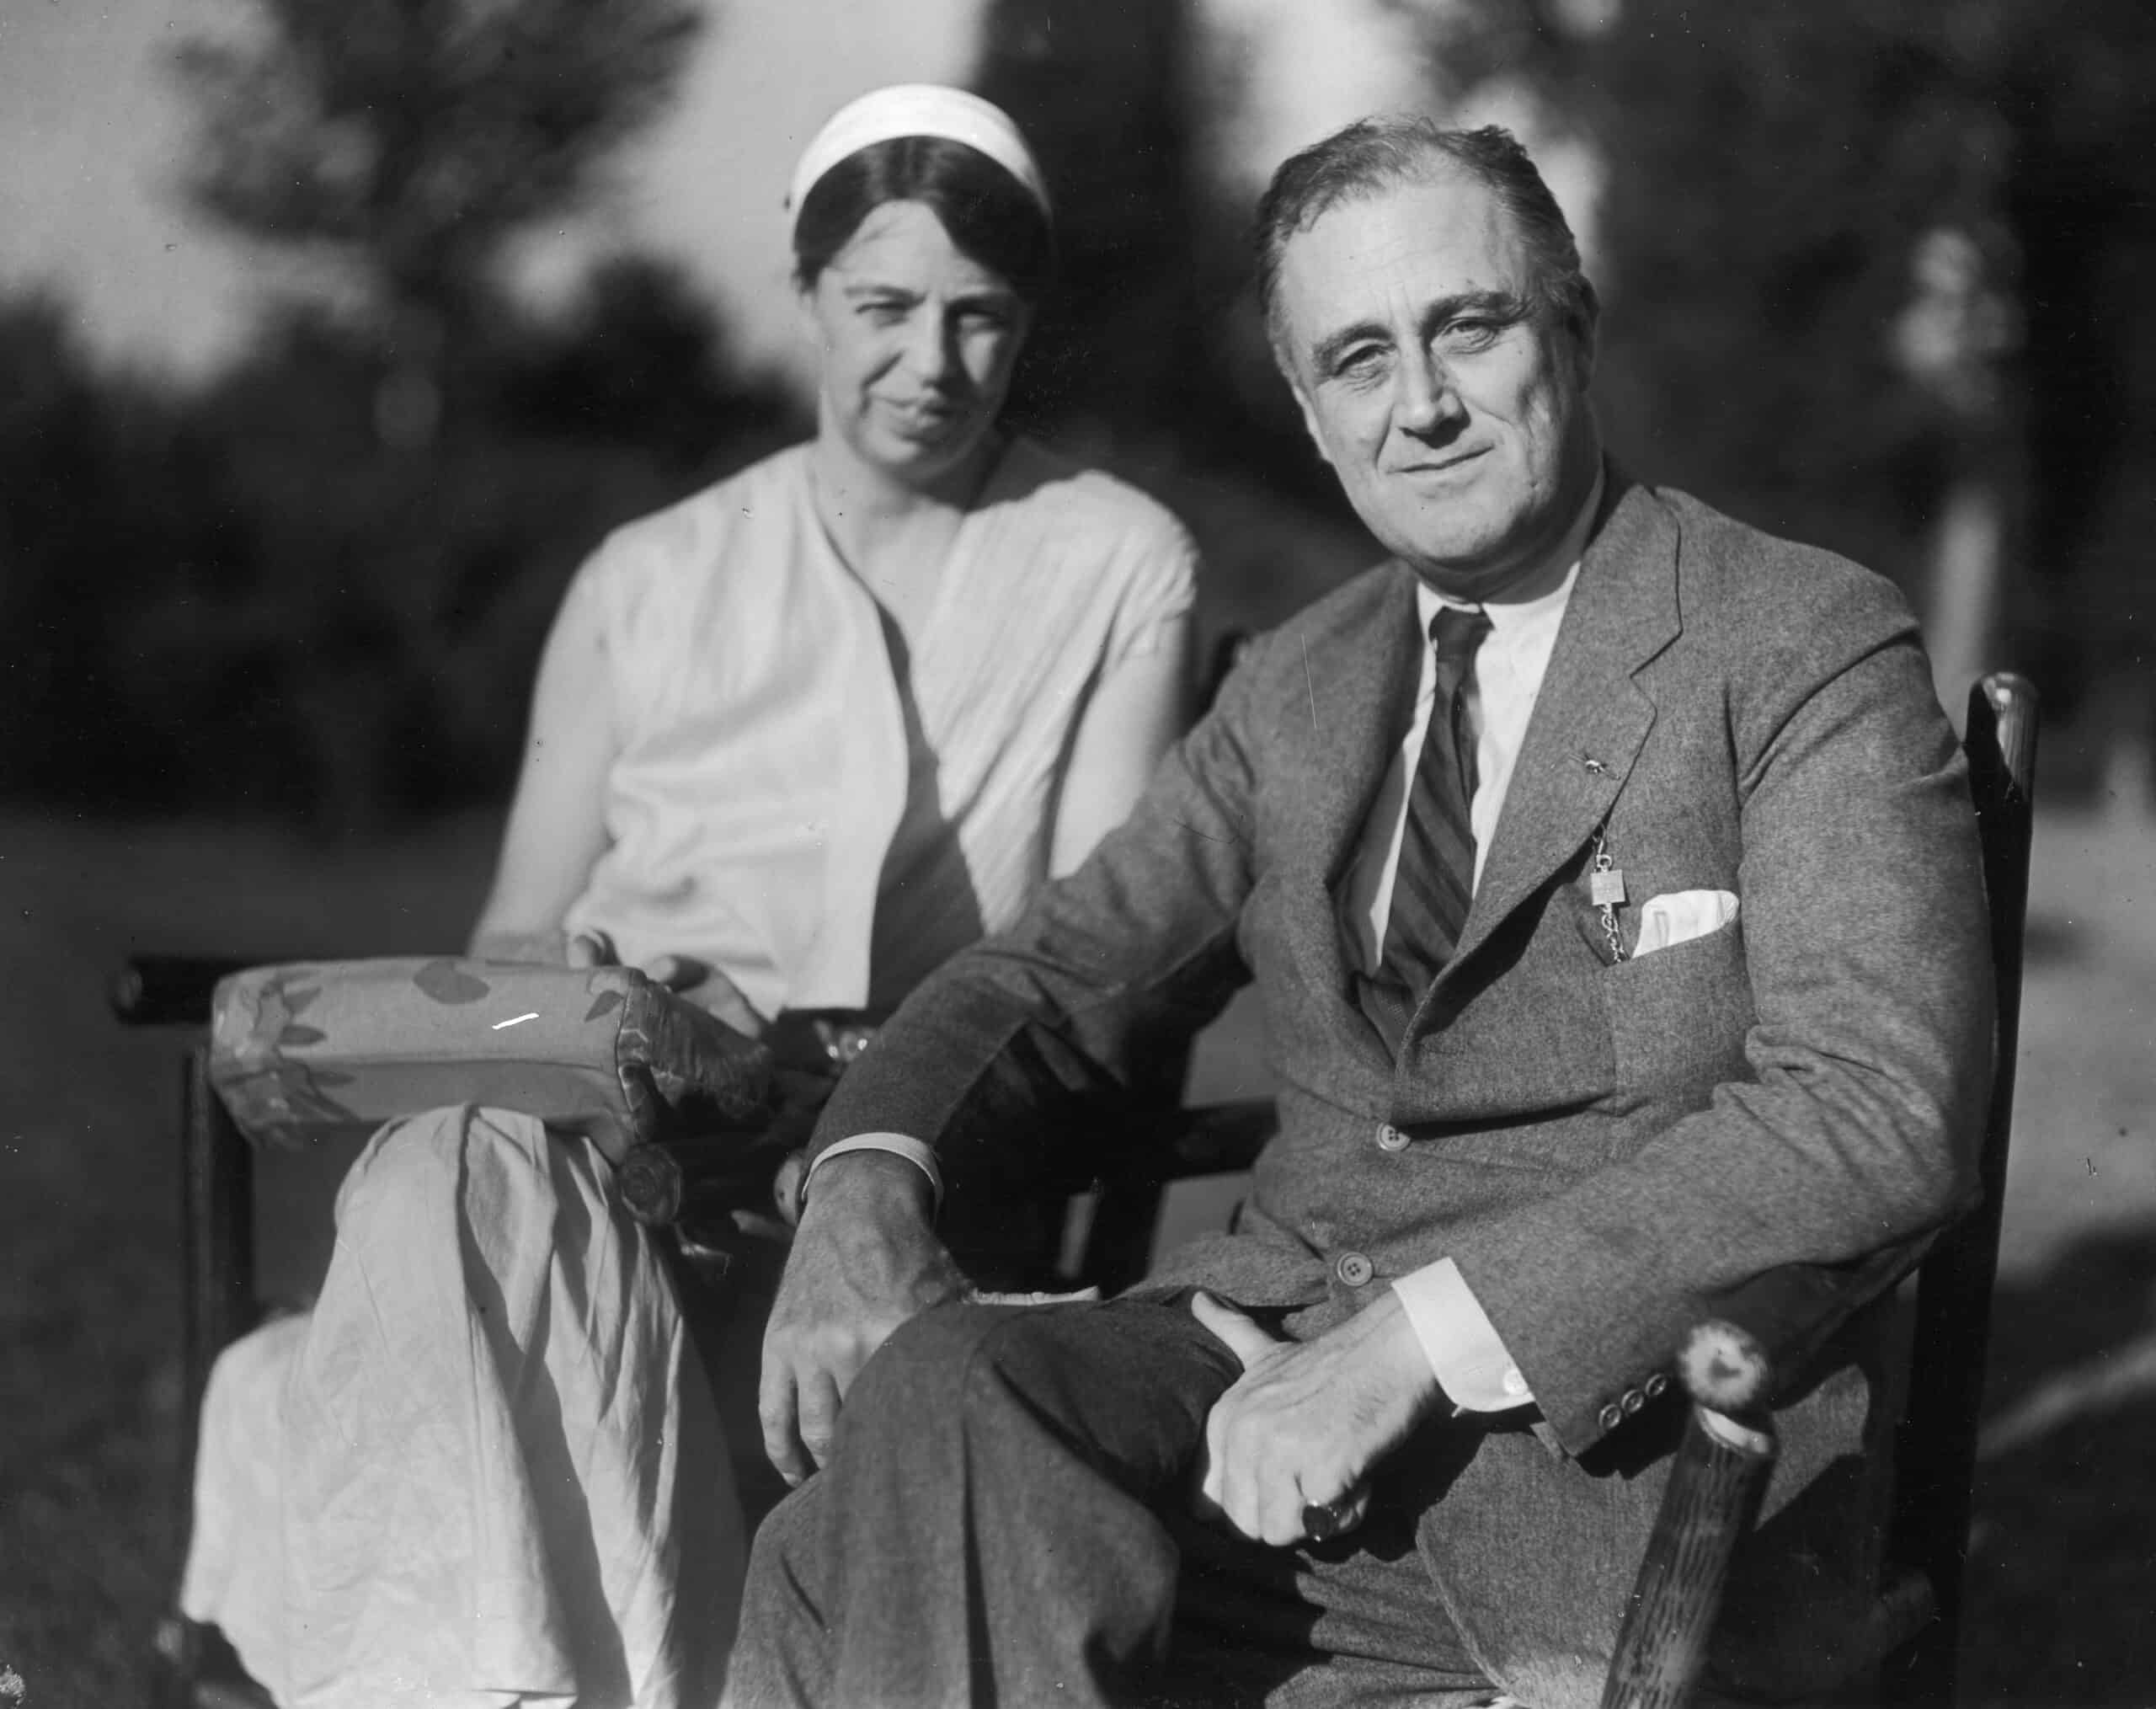
- Change in avg. annual DJIA during presidency: +69.6%
- Avg. DJIA closing price in 1944: 143.32
- Avg. DJIA closing price in 1933: 84.50
- Party affiliation: Democratic
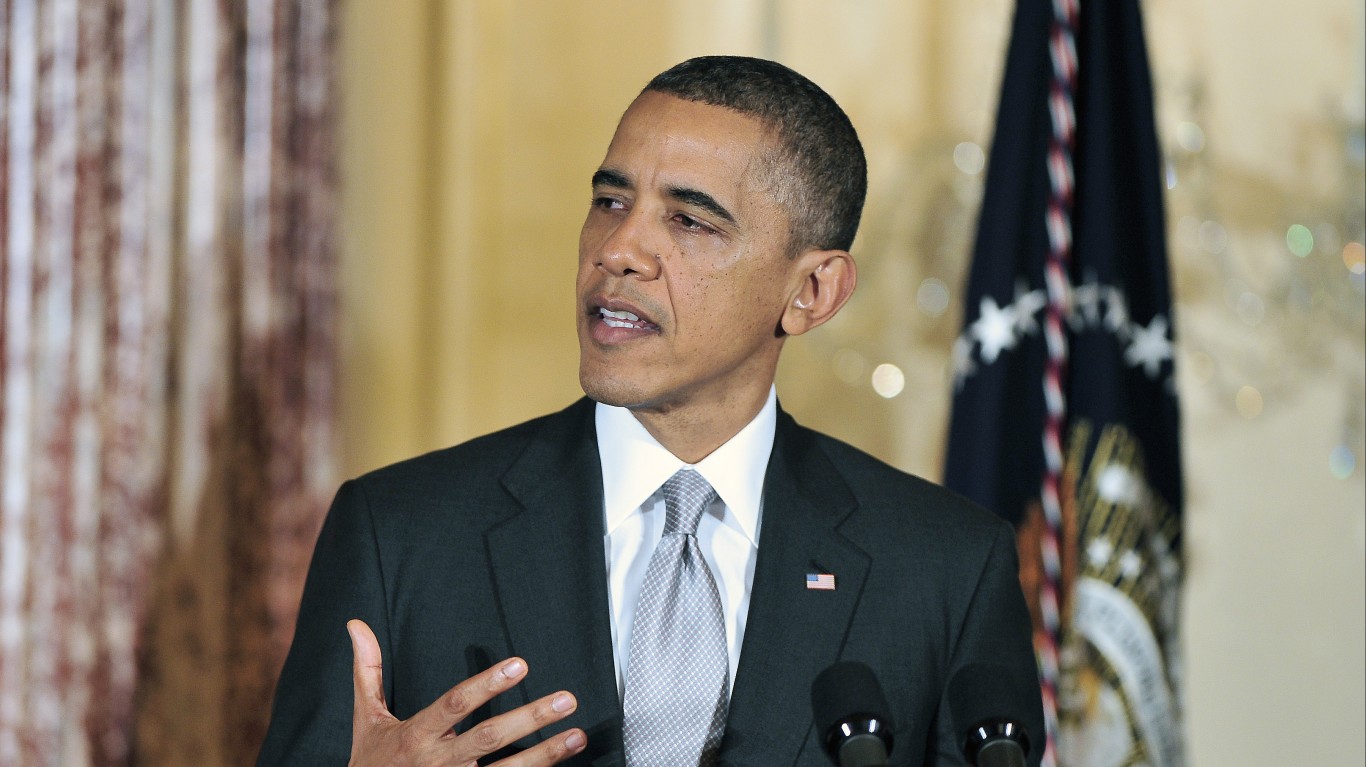
5. Barack Obama (in office Jan. 2009 – Jan. 2017)
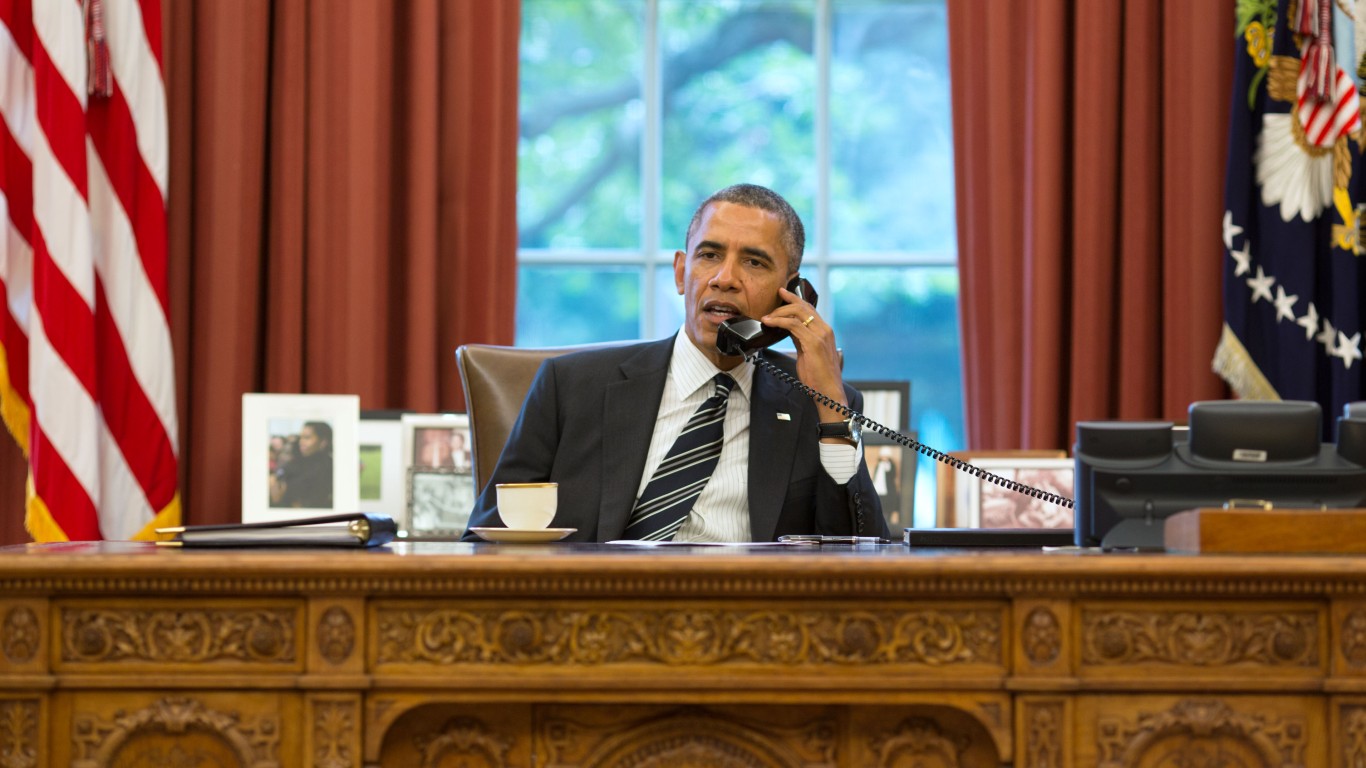
- Change in avg. annual DJIA during presidency: +101.8%
- Avg. DJIA closing price in 2016: 17,927.11
- Avg. DJIA closing price in 2009: 8,885.65
- Party affiliation: Democratic
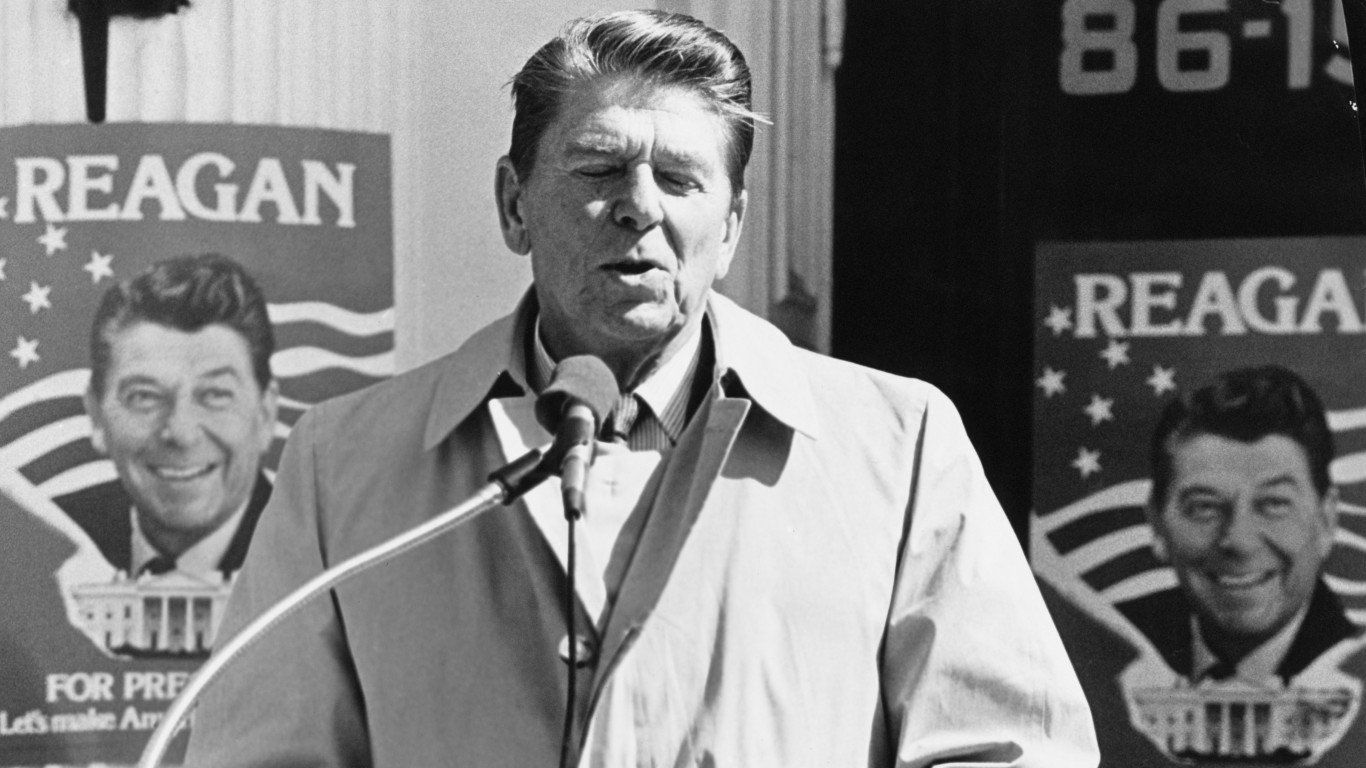
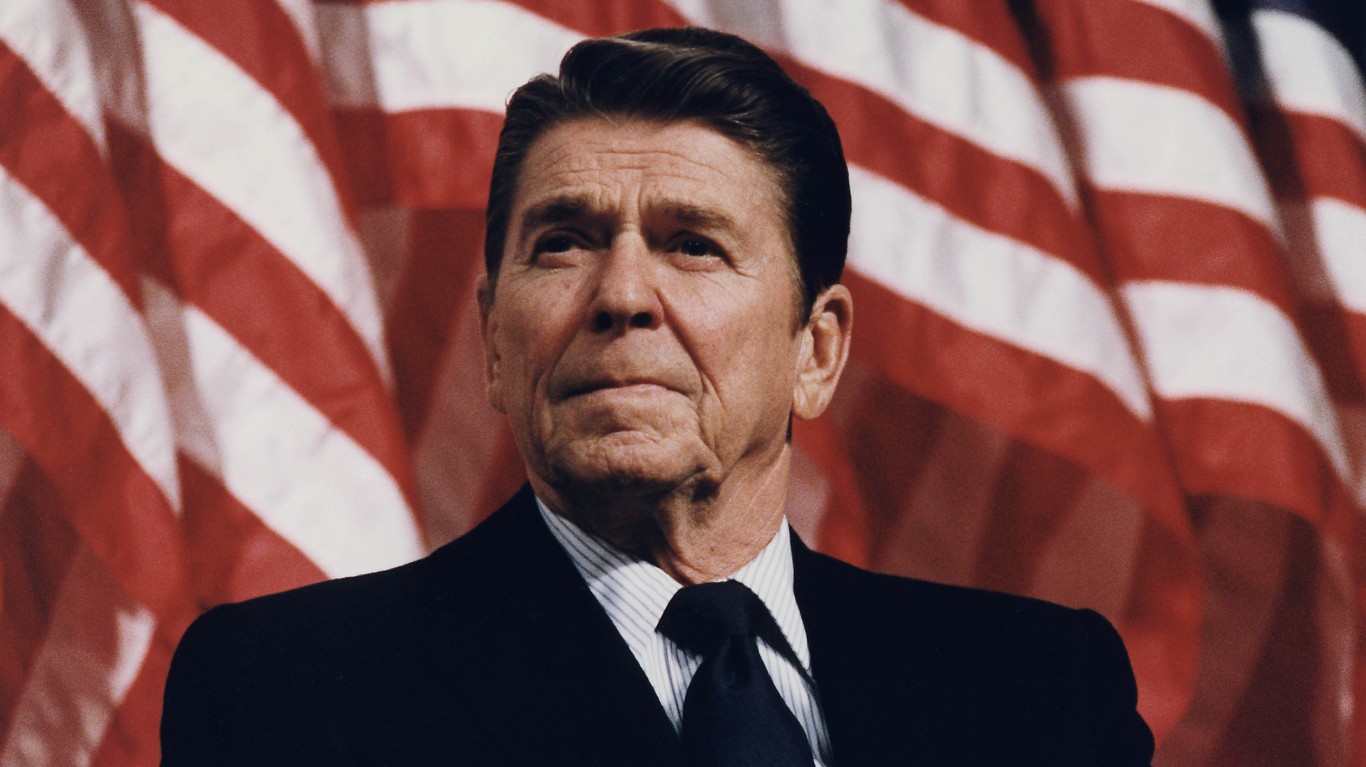
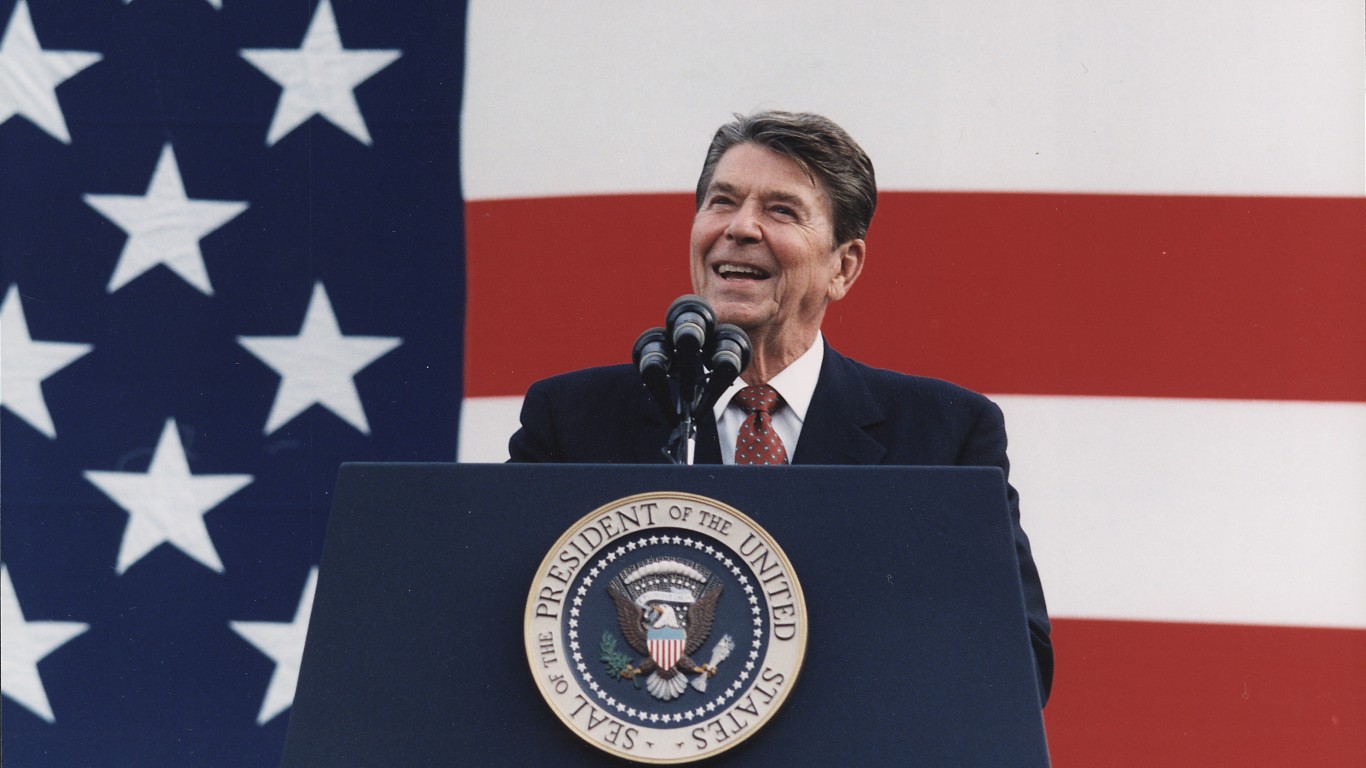
4. Ronald Reagan (in office Jan. 1981 – Jan. 1989)
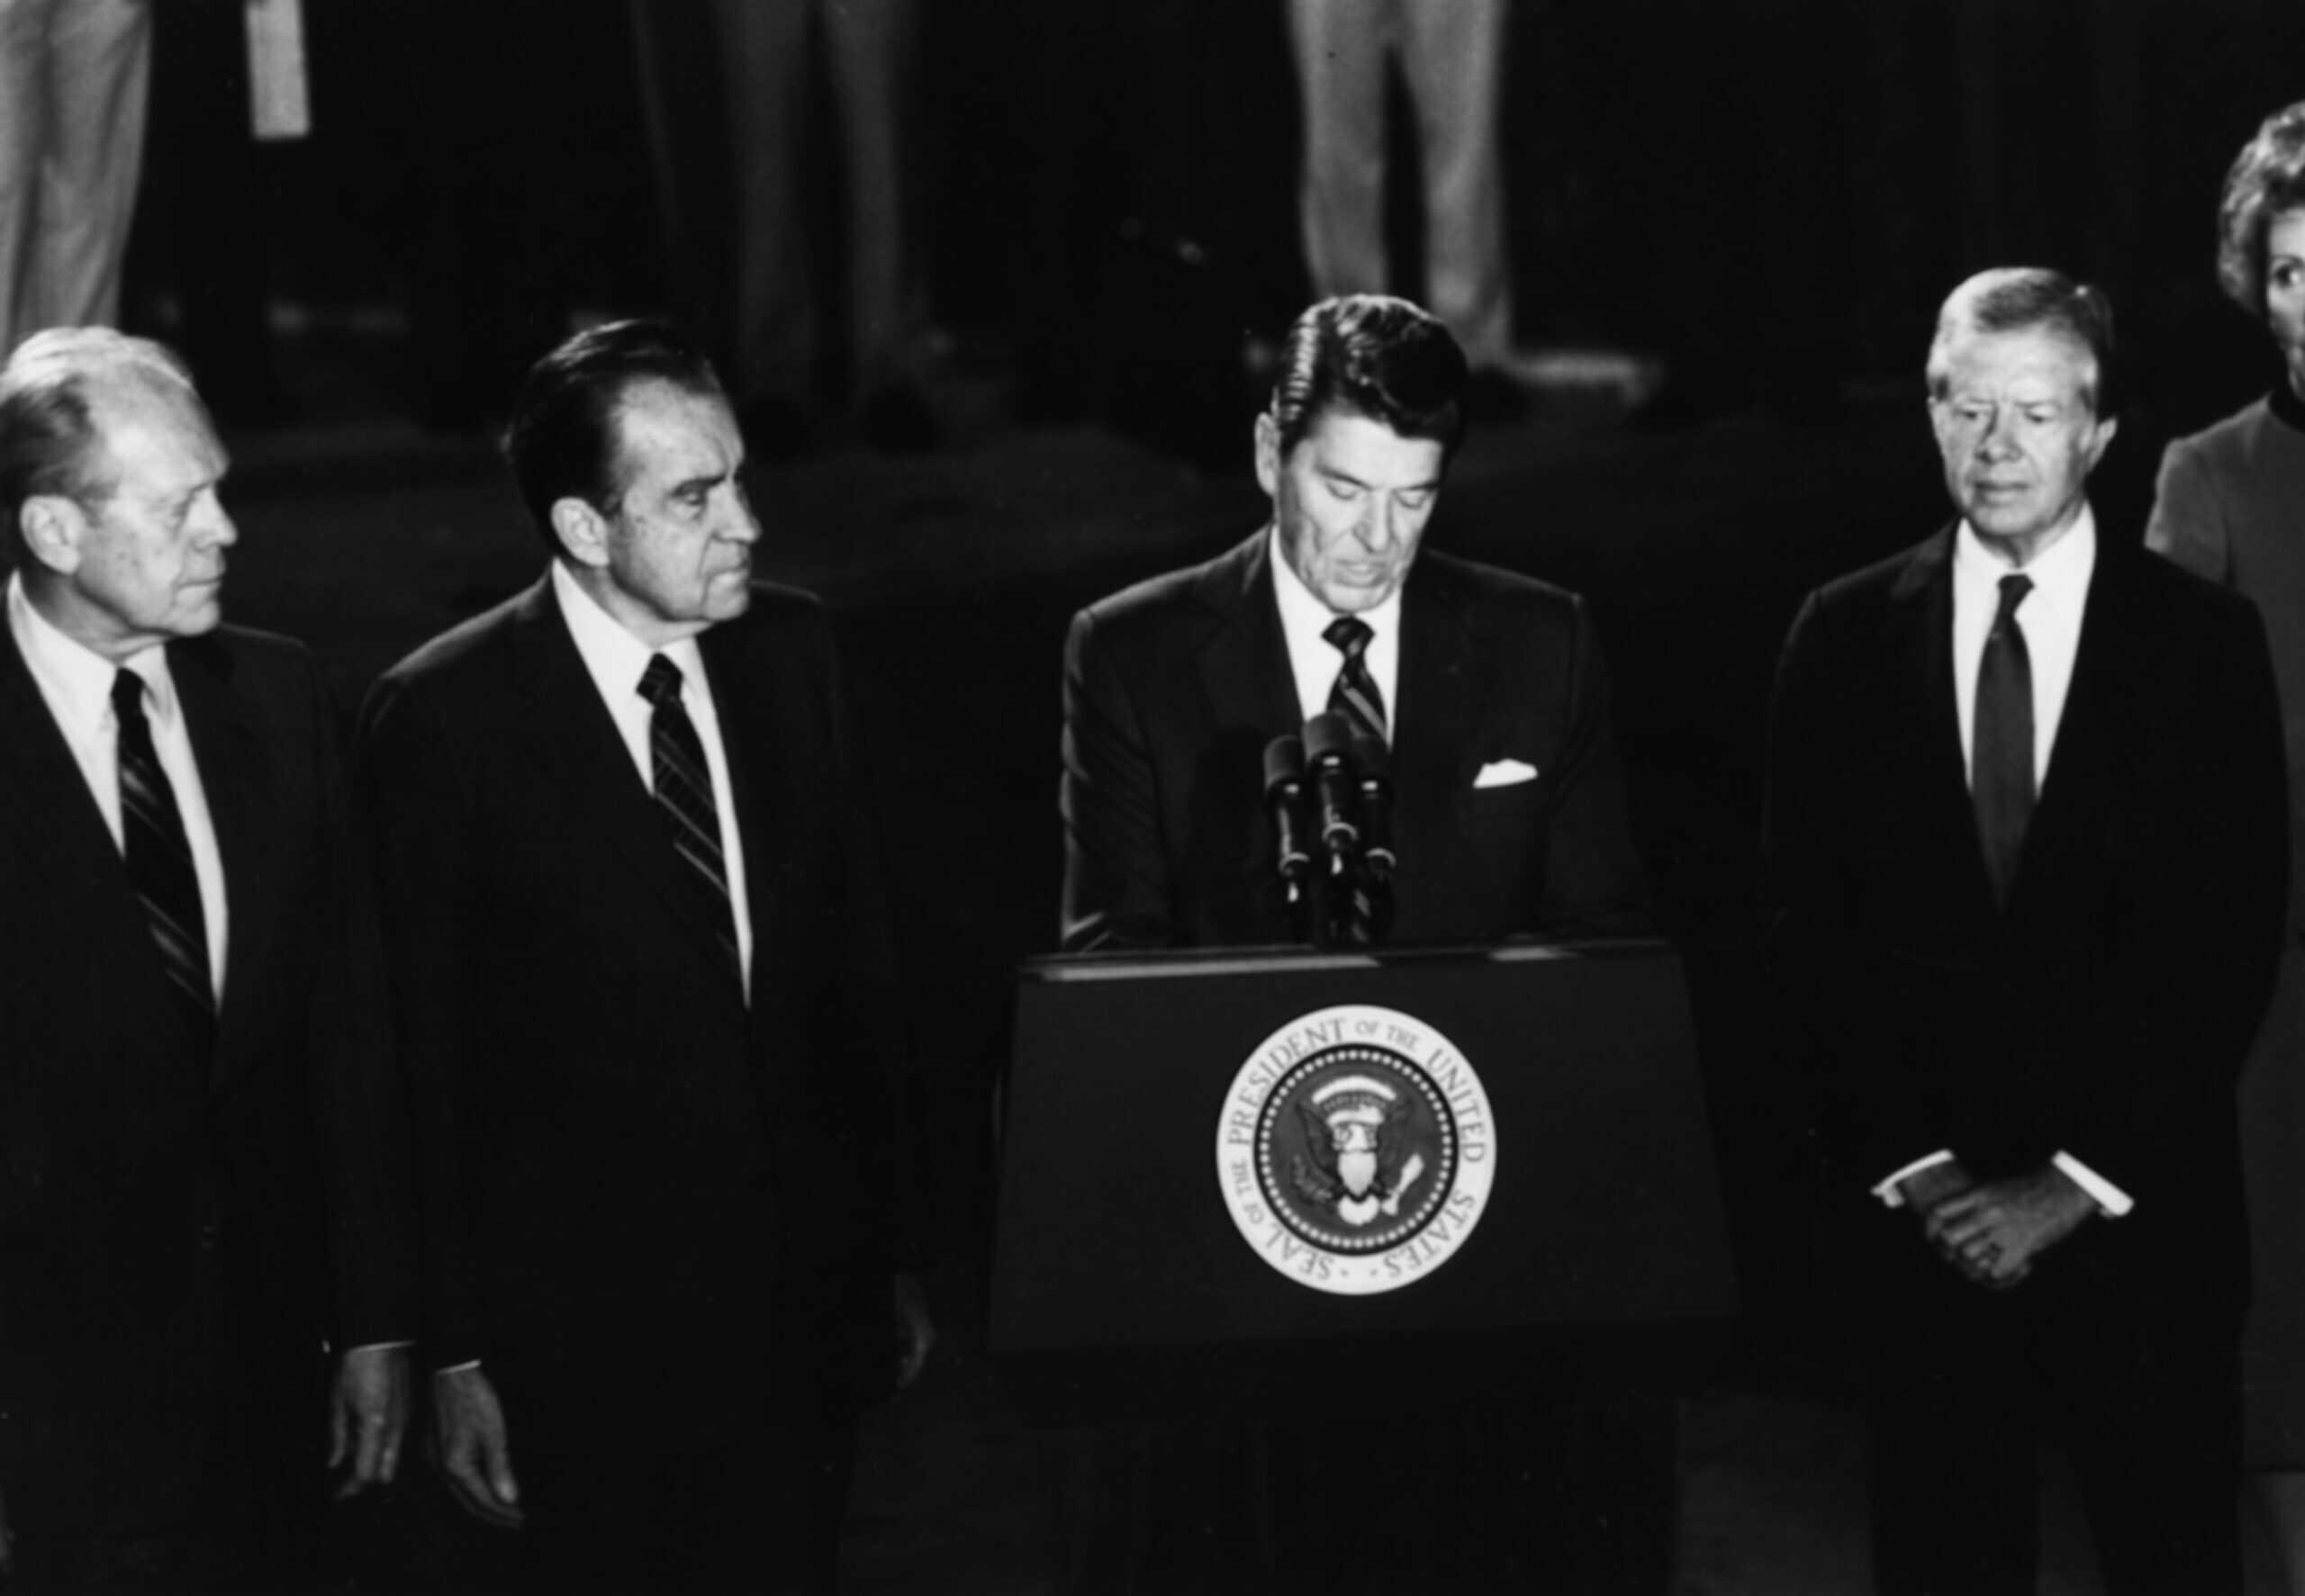
- Change in avg. annual DJIA during presidency: +121.0%
- Avg. DJIA closing price in 1988: 2,061.48
- Avg. DJIA closing price in 1981: 932.95
- Party affiliation: Republican
3. Dwight D. Eisenhower (in office Jan. 1953 – Jan. 1961)
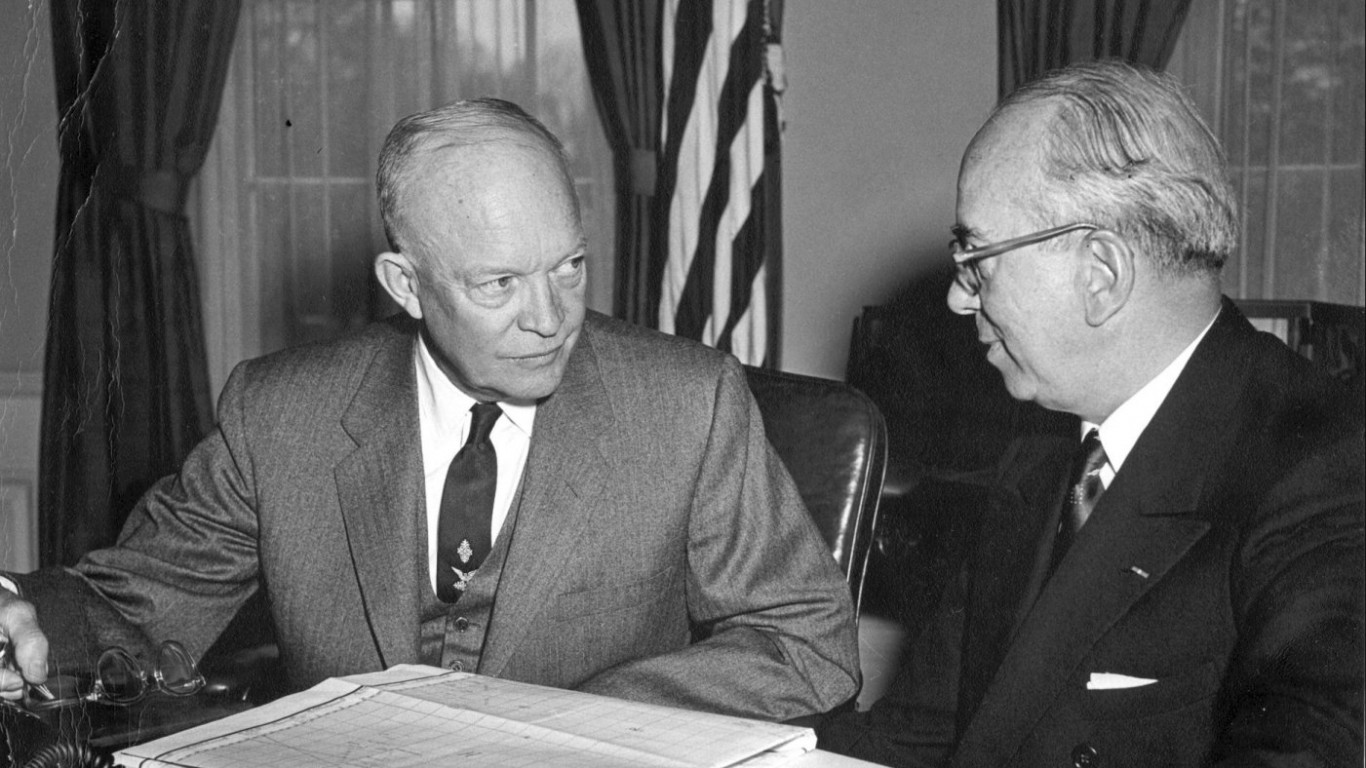
- Change in avg. annual DJIA during presidency: +124.1%
- Avg. DJIA closing price in 1960: 618.02
- Avg. DJIA closing price in 1953: 275.84
- Party affiliation: Republican
2. Calvin Coolidge (in office August 1923 – March 1929)
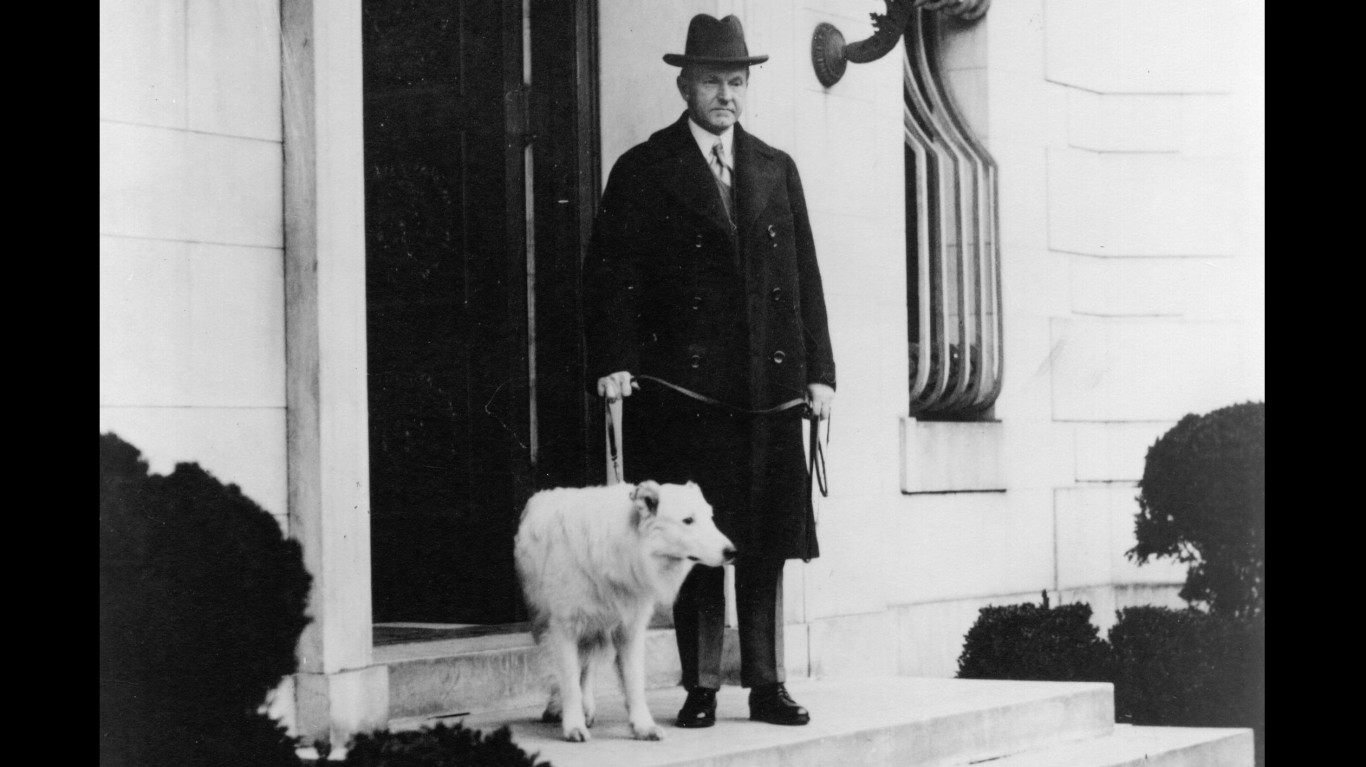
- Change in avg. annual DJIA during presidency: +127.0%
- Avg. DJIA closing price in 1928: 226.17
- Avg. DJIA closing price in 1924: 99.65
- Party affiliation: Republican
1. William J. Clinton (in office Jan. 1993 – Jan. 2001)
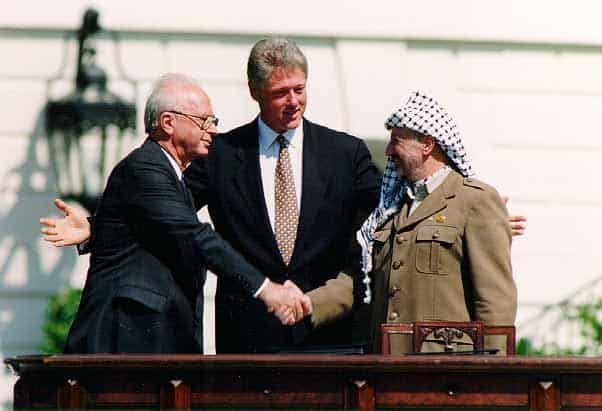
- Change in avg. annual DJIA during presidency: +204.4%
- Avg. DJIA closing price in 2000: 10,729.38
- Avg. DJIA closing price in 1993: 3,524.92
- Party affiliation: Democratic
Contact [email protected] for any questions or corrections.