
24/7 Wall St. Insights
- Americans spent $1,434 per capita on home goods in 2023.
- Spending on run varies widely from state to state, ranging from $1,068 to $1,767.
- While home good expenditures correlates with overall cost of living, several outliers persist throughout the country.
- Also: Discover the next Nvidia
From sofas to smart TVs, Americans are dropping serious cash to outfit their homes — and the price tag depends heavily on where they live. Spending on furniture and home equipment has surged, and in some states, it’s become a major category of personal expenditure.
In 2023, Americans spent $616.6 billion on furnishings and durable housing equipment — anything from laptops to beds to washers to power tools — up 35.2% from 2018. Adjusted for population, Americans spent an average of $1,434 per capita on home goods in 2023. Per capita home goods spending varies widely across the country, ranging from just $1,068 in the lowest spending state to $1,767 in the highest. A closer look at the data reveals the states where people spend the most on home goods.
To determine the states spending the most on home goods, 24/7 Wall St. reviewed data on personal consumption expenditures from the Bureau of Economic Analysis. States were ranked based on annual personal expenditure on furnishings and durable housing equipment per capita in 2023. Expenditure totals were adjusted for population using data from the U.S. Census Bureau.
50. Mississippi

- Personal home goods expenditure, adjusted for population: $1,068 per capita
- Cost of living: -12.7% less than national average
- Total home goods expenditure: $3.1 billion
- Total population: 2.9 million
- Other major spending categories: Gasoline and other energy goods, clothing and footwear, motor vehicles and parts, groceries, health care, food services and accommodations
49. West Virginia

- Personal home goods expenditure, adjusted for population: $1,089 per capita
- Cost of living: -10.2% less than national average
- Total home goods expenditure: $1.9 billion
- Total population: 1.8 million
- Other major spending categories: Health care, gasoline and other energy goods, groceries, motor vehicles and parts, financial services and insurance, housing and utilities
48. Kentucky

- Personal home goods expenditure, adjusted for population: $1,187 per capita
- Cost of living: -9.5% less than national average
- Total home goods expenditure: $5.4 billion
- Total population: 4.5 million
- Other major spending categories: Gasoline and other energy goods, health care, groceries, motor vehicles and parts, recreation services, food services and accommodations
47. New Mexico
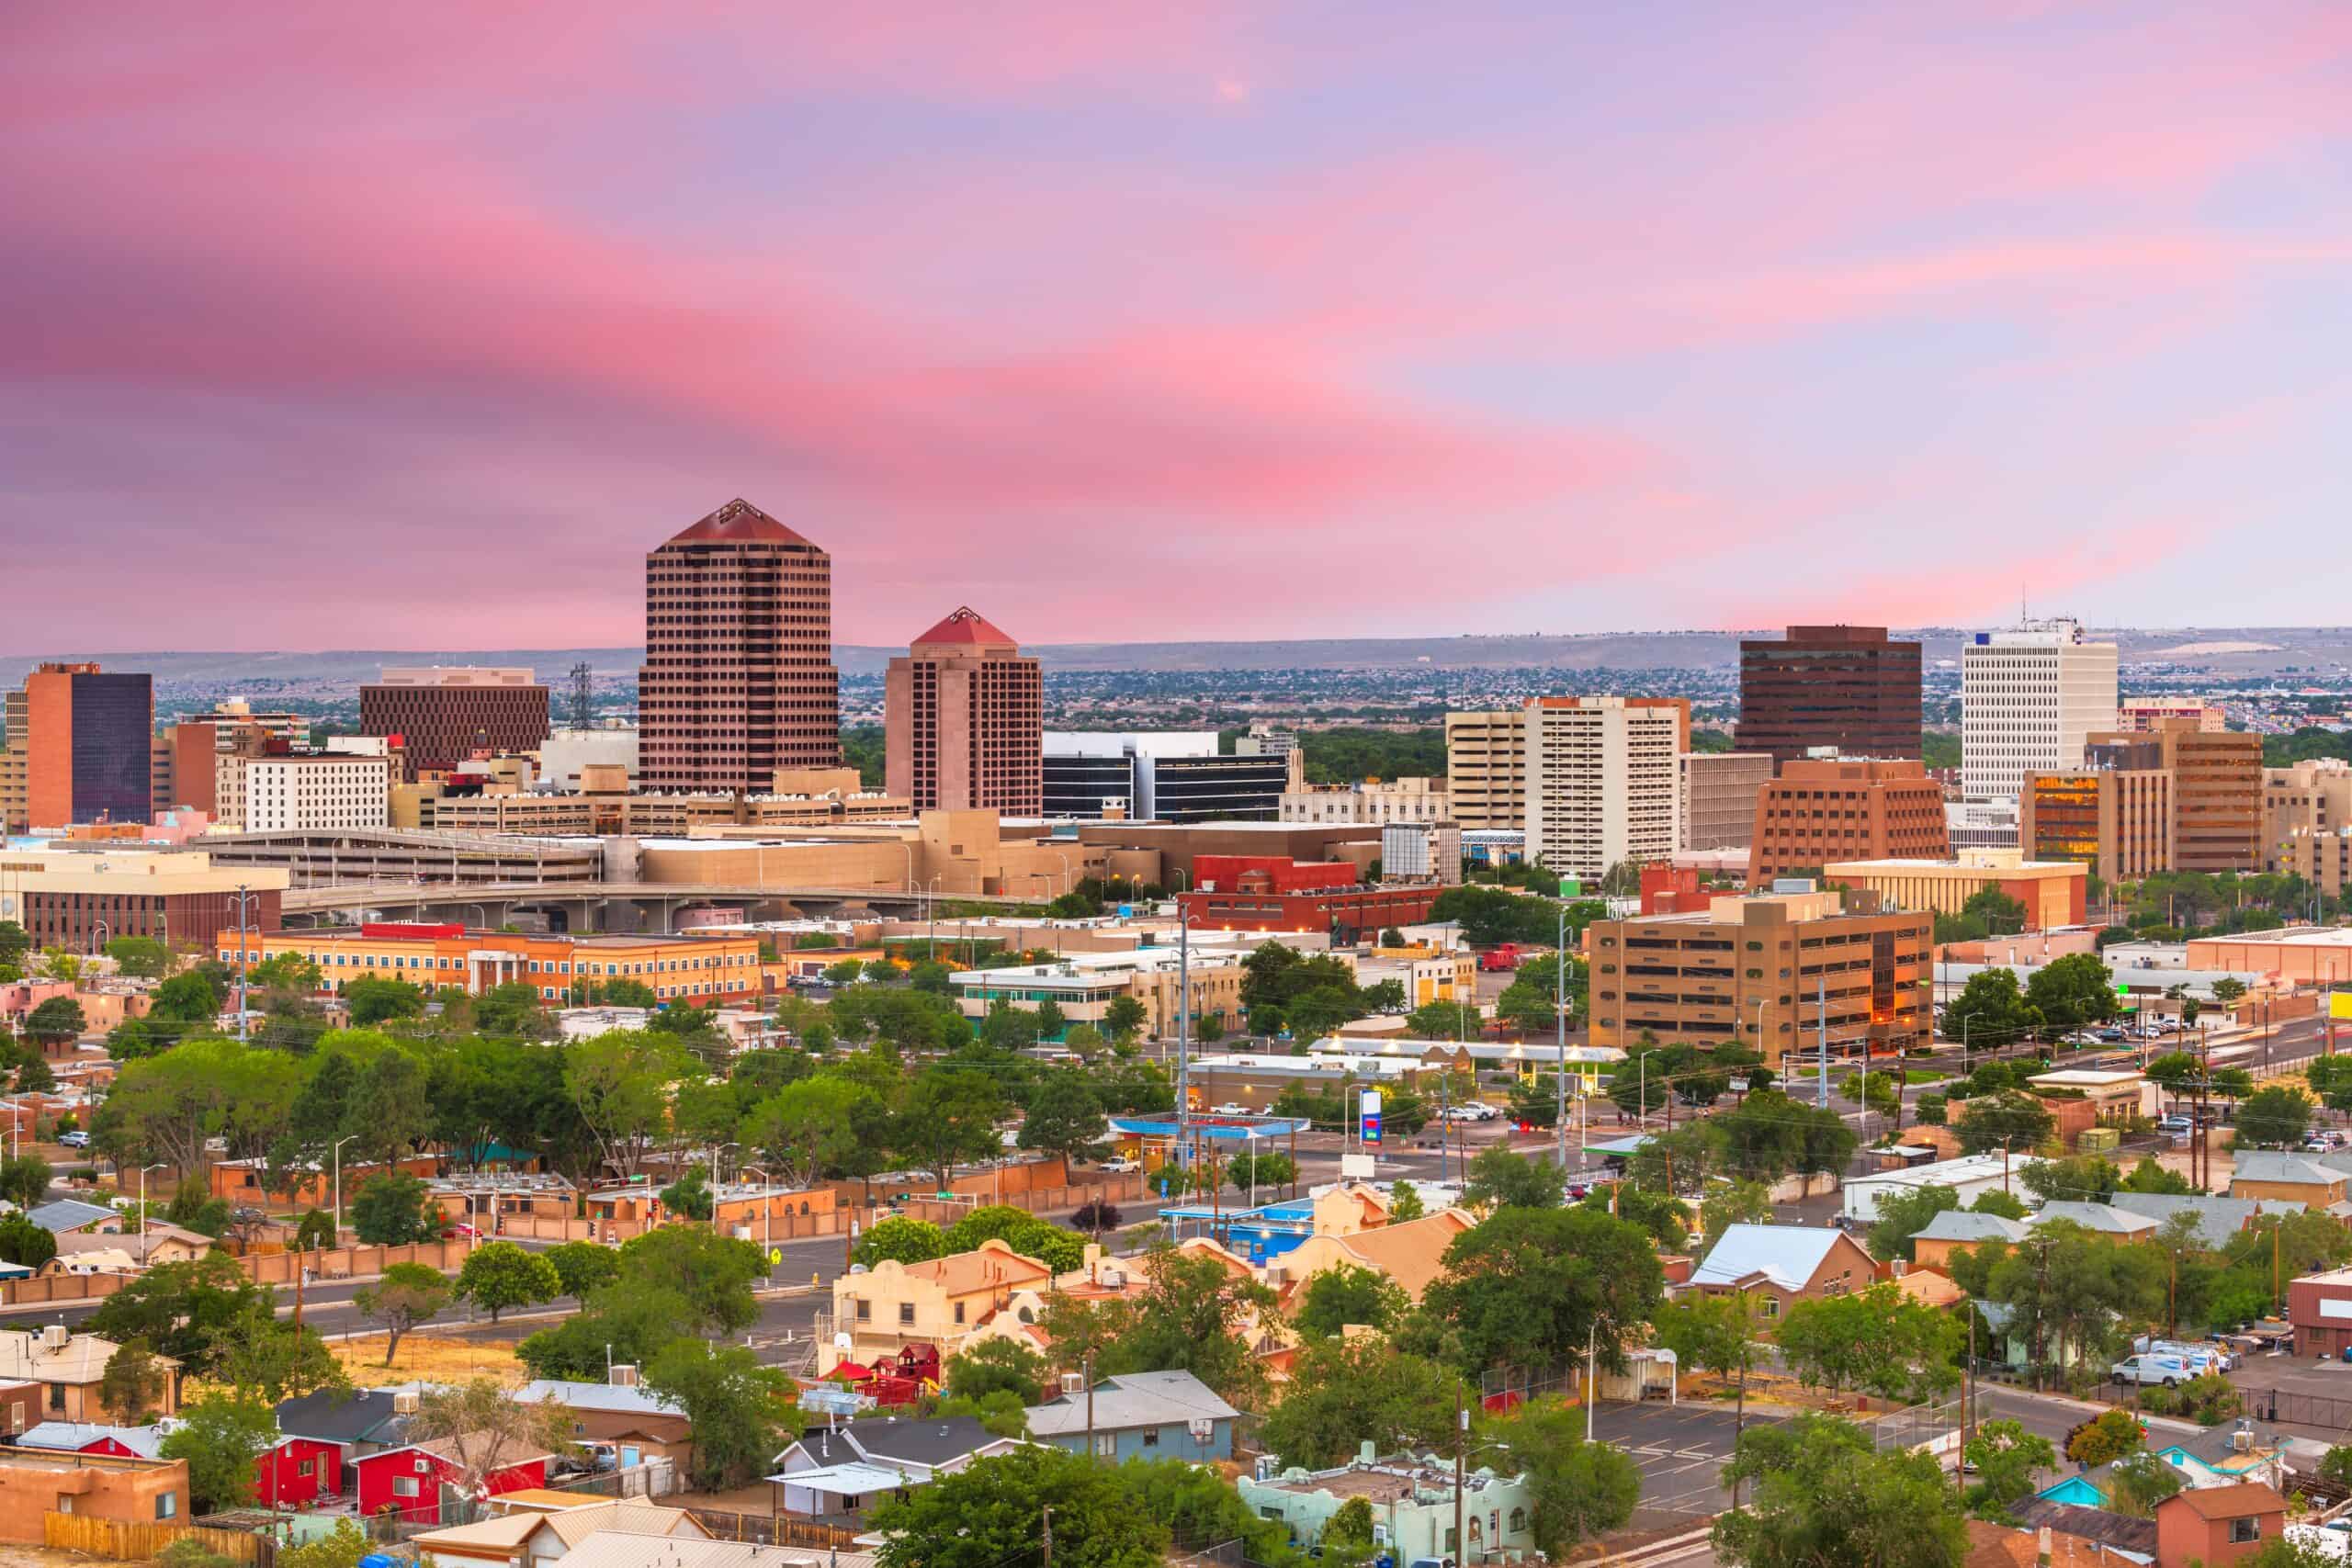
- Personal home goods expenditure, adjusted for population: $1,187 per capita
- Cost of living: -9.6% less than national average
- Total home goods expenditure: $2.5 billion
- Total population: 2.1 million
- Other major spending categories: Gasoline and other energy goods, food services and accommodations, motor vehicles and parts, groceries, housing and utilities, health care
46. Oklahoma

- Personal home goods expenditure, adjusted for population: $1,205 per capita
- Cost of living: -11.7% less than national average
- Total home goods expenditure: $4.9 billion
- Total population: 4.1 million
- Other major spending categories: Motor vehicles and parts, gasoline and other energy goods, clothing and footwear, food services and accommodations, health care, recreational goods and vehicles
45. Iowa

- Personal home goods expenditure, adjusted for population: $1,209 per capita
- Cost of living: -11.2% less than national average
- Total home goods expenditure: $3.9 billion
- Total population: 3.2 million
- Other major spending categories: Gasoline and other energy goods, motor vehicles and parts, groceries, recreational goods and vehicles, transportation services, health care
44. Alabama

- Personal home goods expenditure, adjusted for population: $1,211 per capita
- Cost of living: -10.0% less than national average
- Total home goods expenditure: $6.2 billion
- Total population: 5.1 million
- Other major spending categories: Motor vehicles and parts, gasoline and other energy goods, clothing and footwear, recreational goods and vehicles, groceries
43. Michigan

- Personal home goods expenditure, adjusted for population: $1,234 per capita
- Cost of living: -5.8% less than national average
- Total home goods expenditure: $12.4 billion
- Total population: 10.0 million
- Other major spending categories: Financial services and insurance, gasoline and other energy goods, recreational goods and vehicles, groceries, clothing and footwear, housing and utilities
42. Nebraska
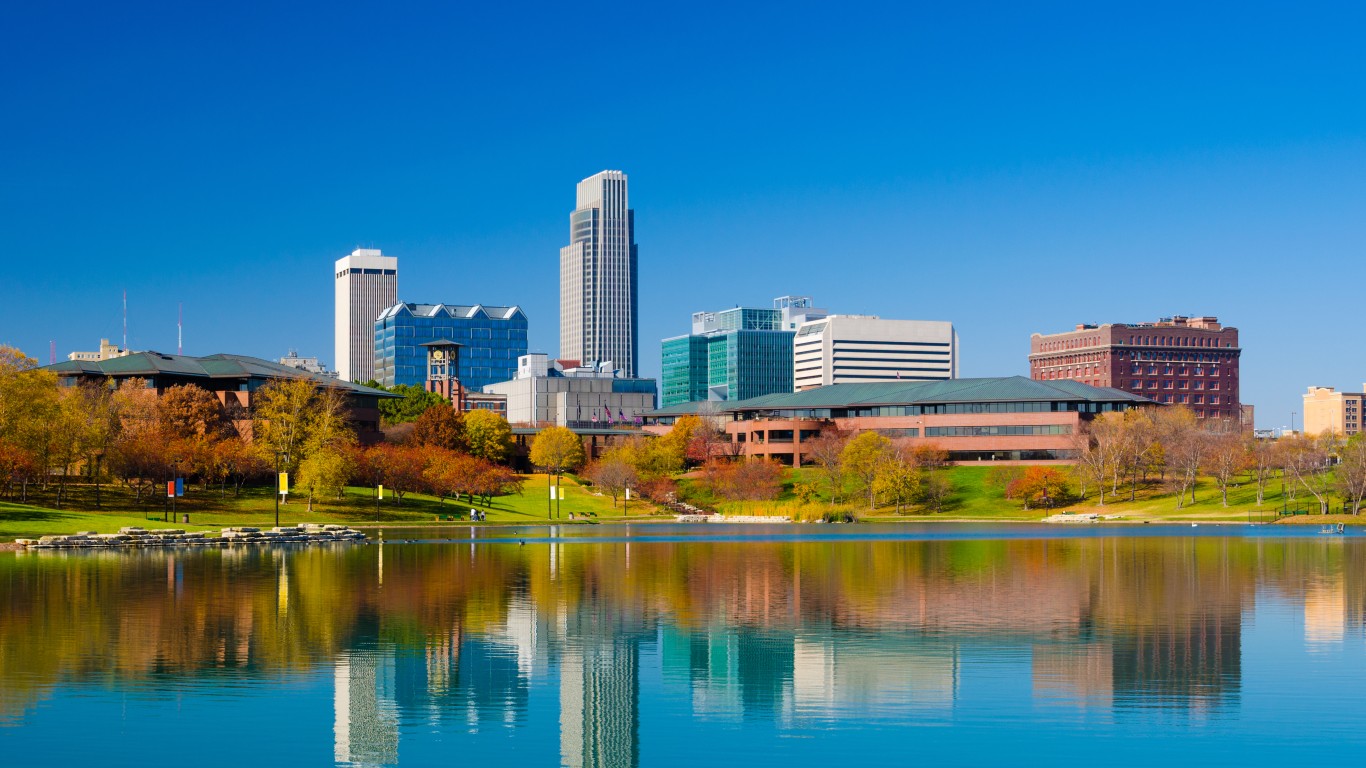
- Personal home goods expenditure, adjusted for population: $1,244 per capita
- Cost of living: -9.6% less than national average
- Total home goods expenditure: $2.5 billion
- Total population: 2.0 million
- Other major spending categories: Motor vehicles and parts, gasoline and other energy goods, financial services and insurance, health care, transportation services, recreational goods and vehicles
41. Missouri

- Personal home goods expenditure, adjusted for population: $1,248 per capita
- Cost of living: -8.2% less than national average
- Total home goods expenditure: $7.7 billion
- Total population: 6.2 million
- Other major spending categories: Gasoline and other energy goods, motor vehicles and parts, financial services and insurance, health care, recreation services, transportation services
40. Georgia

- Personal home goods expenditure, adjusted for population: $1,270 per capita
- Cost of living: -3.3% less than national average
- Total home goods expenditure: $14.0 billion
- Total population: 11.0 million
- Other major spending categories: Transportation services, clothing and footwear, groceries, motor vehicles and parts, gasoline and other energy goods, recreation services
39. Rhode Island

- Personal home goods expenditure, adjusted for population: $1,275 per capita
- Cost of living: +1.4% more than national average
- Total home goods expenditure: $1.4 billion
- Total population: 1.1 million
- Other major spending categories: Transportation services, food services and accommodations, recreation services, groceries, housing and utilities, health care
38. Arkansas

- Personal home goods expenditure, adjusted for population: $1,282 per capita
- Cost of living: -13.5% less than national average
- Total home goods expenditure: $3.9 billion
- Total population: 3.1 million
- Other major spending categories: Gasoline and other energy goods, financial services and insurance, clothing and footwear, recreational goods and vehicles, health care
37. Indiana
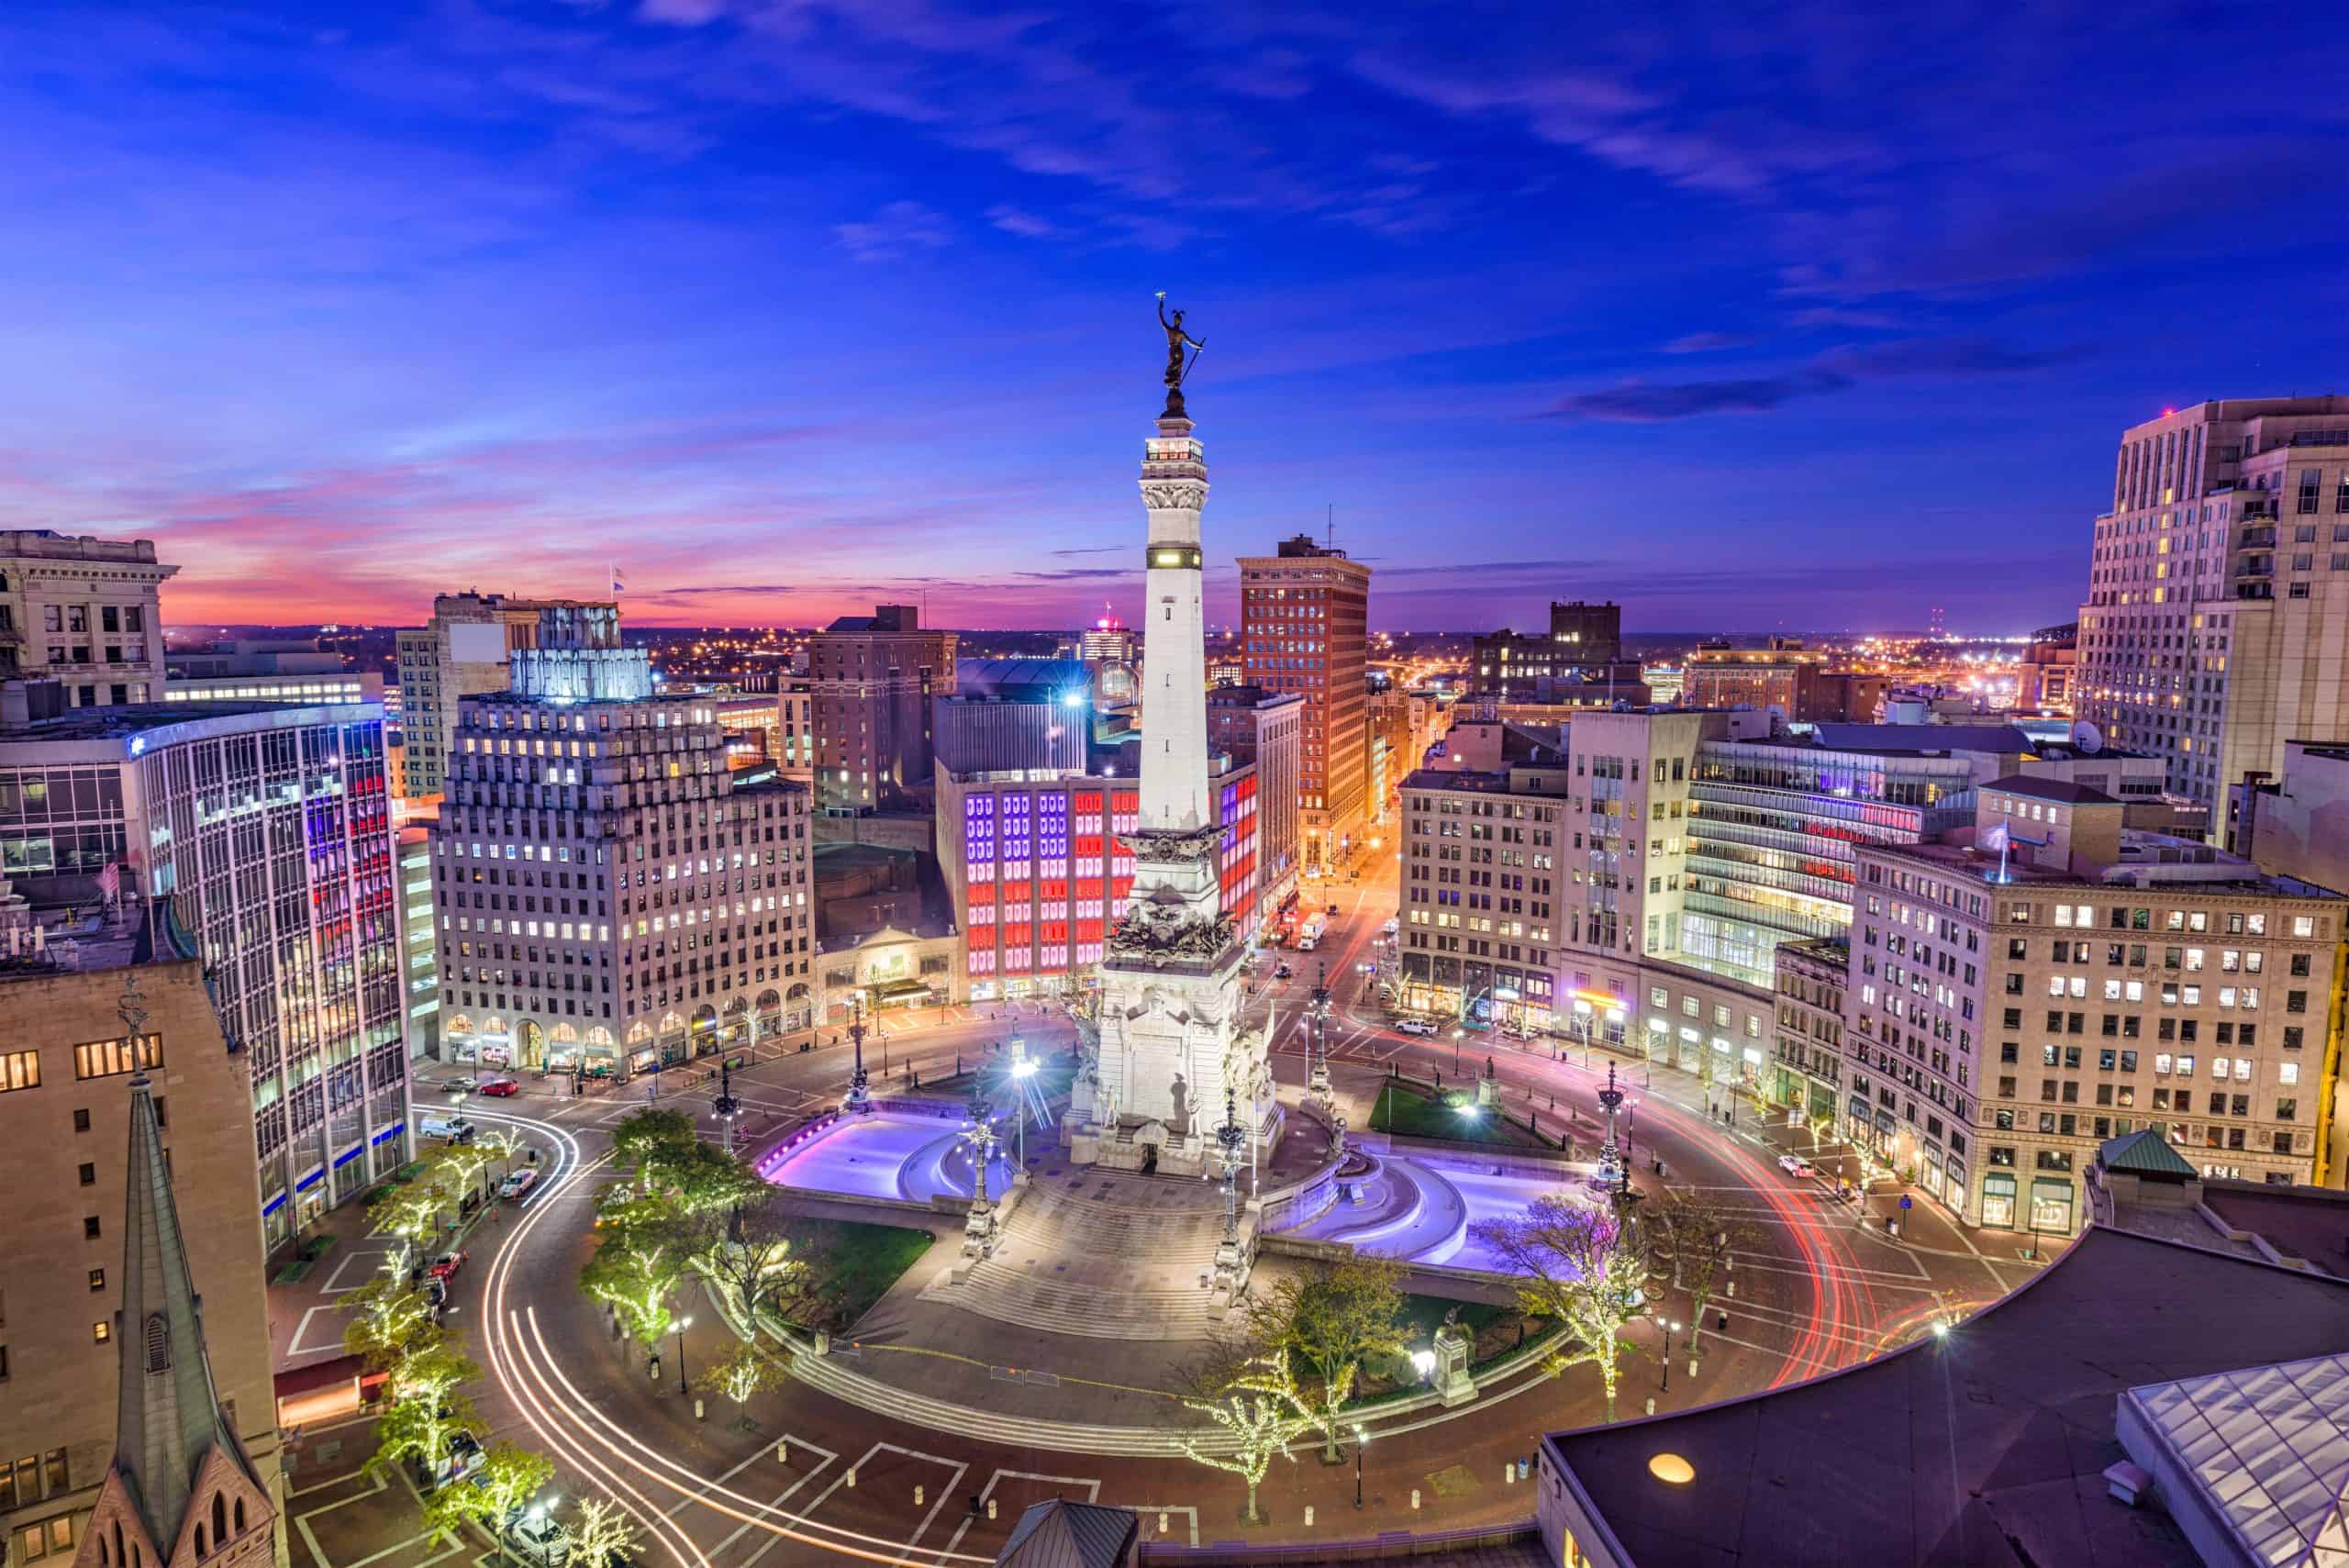
- Personal home goods expenditure, adjusted for population: $1,300 per capita
- Cost of living: -7.8% less than national average
- Total home goods expenditure: $8.9 billion
- Total population: 6.9 million
- Other major spending categories: Health care, gasoline and other energy goods, motor vehicles and parts, recreational goods and vehicles, groceries
36. Maryland

- Personal home goods expenditure, adjusted for population: $1,311 per capita
- Cost of living: +4.0% more than national average
- Total home goods expenditure: $8.1 billion
- Total population: 6.2 million
- Other major spending categories: Clothing and footwear, housing and utilities, recreation services, recreational goods and vehicles, transportation services, food services and accommodations
35. Minnesota
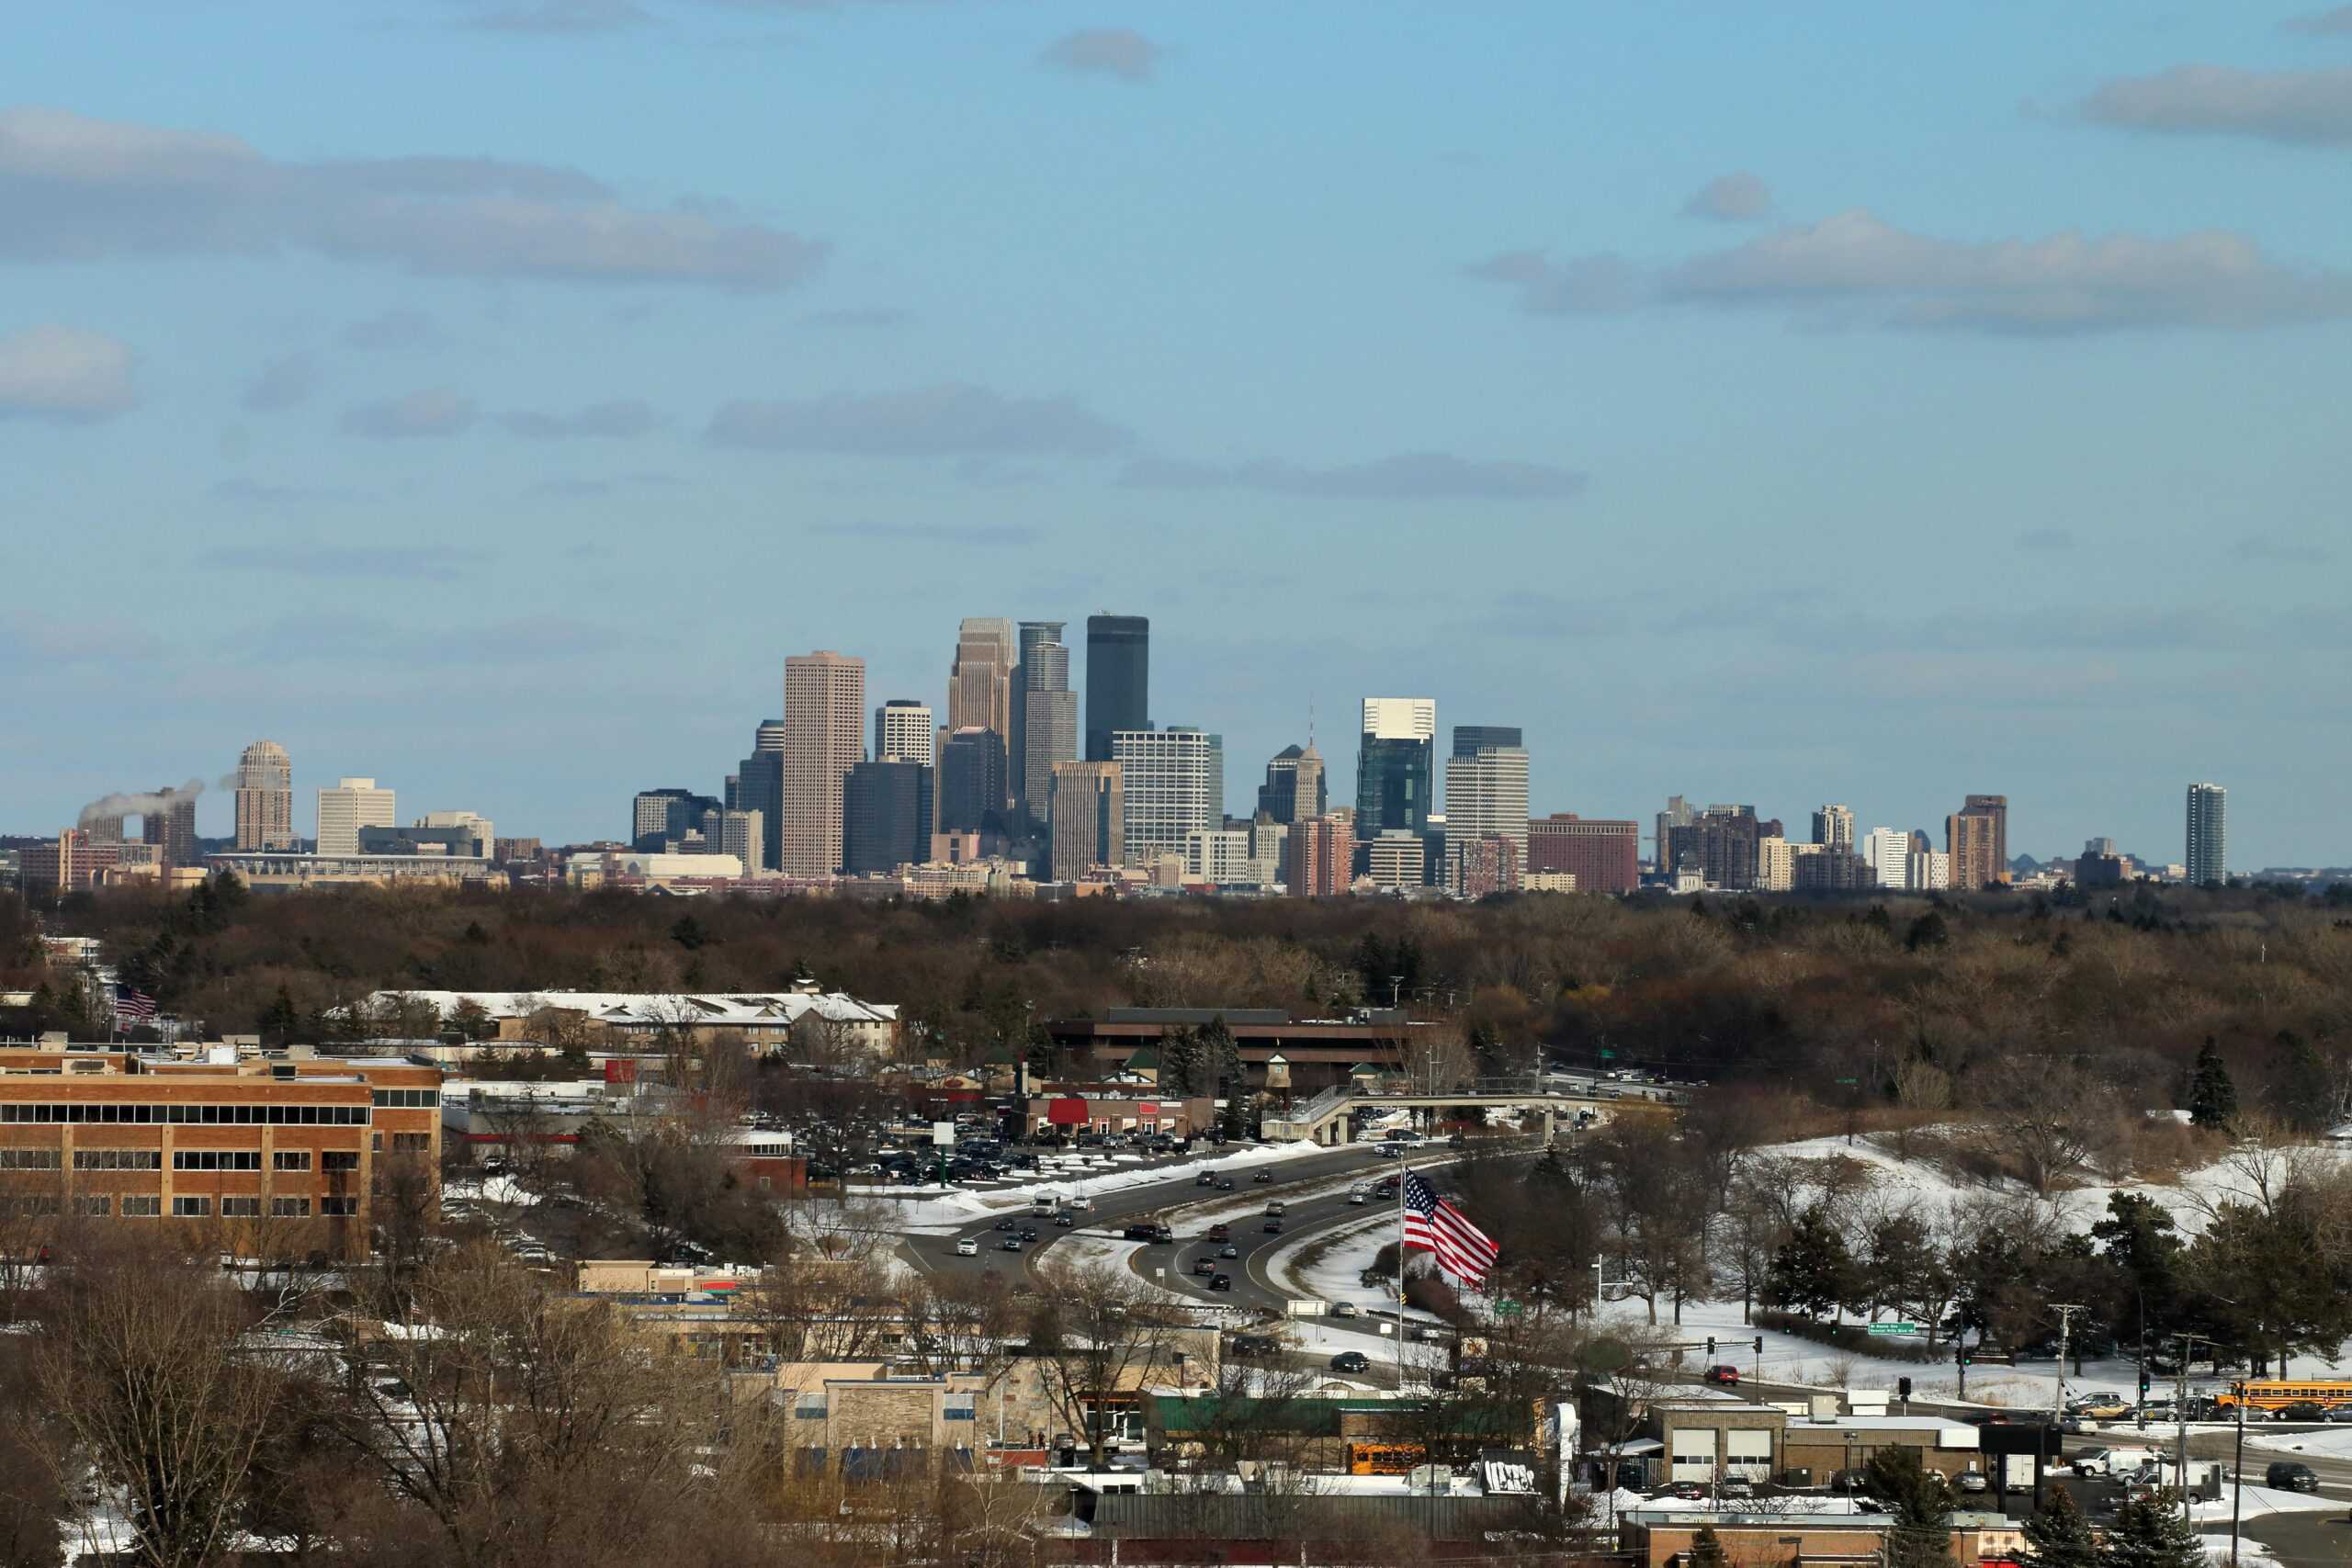
- Personal home goods expenditure, adjusted for population: $1,312 per capita
- Cost of living: -1.6% less than national average
- Total home goods expenditure: $7.5 billion
- Total population: 5.7 million
- Other major spending categories: Recreational goods and vehicles, motor vehicles and parts, financial services and insurance, health care, gasoline and other energy goods, clothing and footwear
34. Ohio

- Personal home goods expenditure, adjusted for population: $1,324 per capita
- Cost of living: -8.2% less than national average
- Total home goods expenditure: $15.6 billion
- Total population: 11.8 million
- Other major spending categories: Health care, recreational goods and vehicles, groceries, gasoline and other energy goods, recreation services
33. Louisiana

- Personal home goods expenditure, adjusted for population: $1,342 per capita
- Cost of living: -11.7% less than national average
- Total home goods expenditure: $6.1 billion
- Total population: 4.6 million
- Other major spending categories: Motor vehicles and parts, health care, gasoline and other energy goods, clothing and footwear, food services and accommodations, financial services and insurance
32. Tennessee

- Personal home goods expenditure, adjusted for population: $1,343 per capita
- Cost of living: -7.5% less than national average
- Total home goods expenditure: $9.6 billion
- Total population: 7.1 million
- Other major spending categories: Clothing and footwear, food services and accommodations, financial services and insurance, gasoline and other energy goods, motor vehicles and parts
31. Idaho
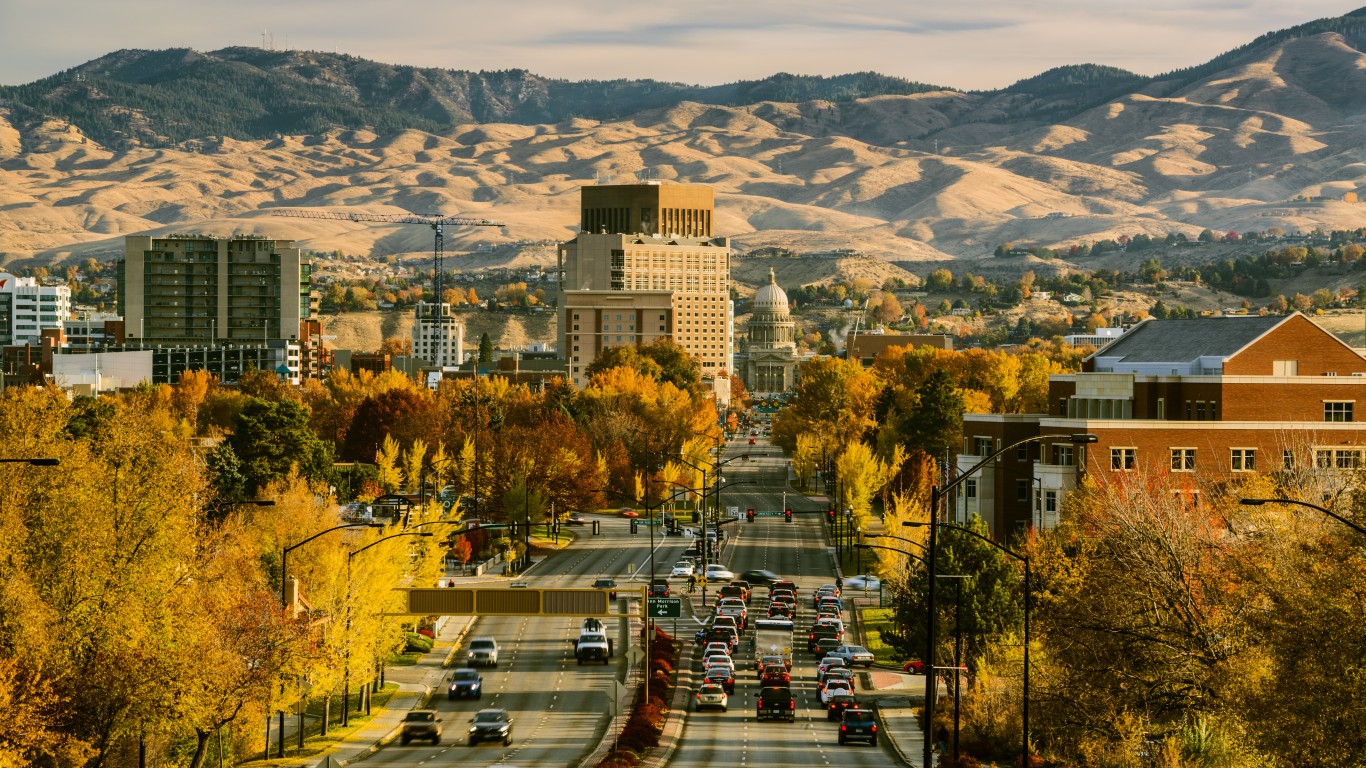
- Personal home goods expenditure, adjusted for population: $1,345 per capita
- Cost of living: -8.6% less than national average
- Total home goods expenditure: $2.6 billion
- Total population: 2.0 million
- Other major spending categories: Recreational goods and vehicles, gasoline and other energy goods, motor vehicles and parts, housing and utilities, transportation services
30. Kansas
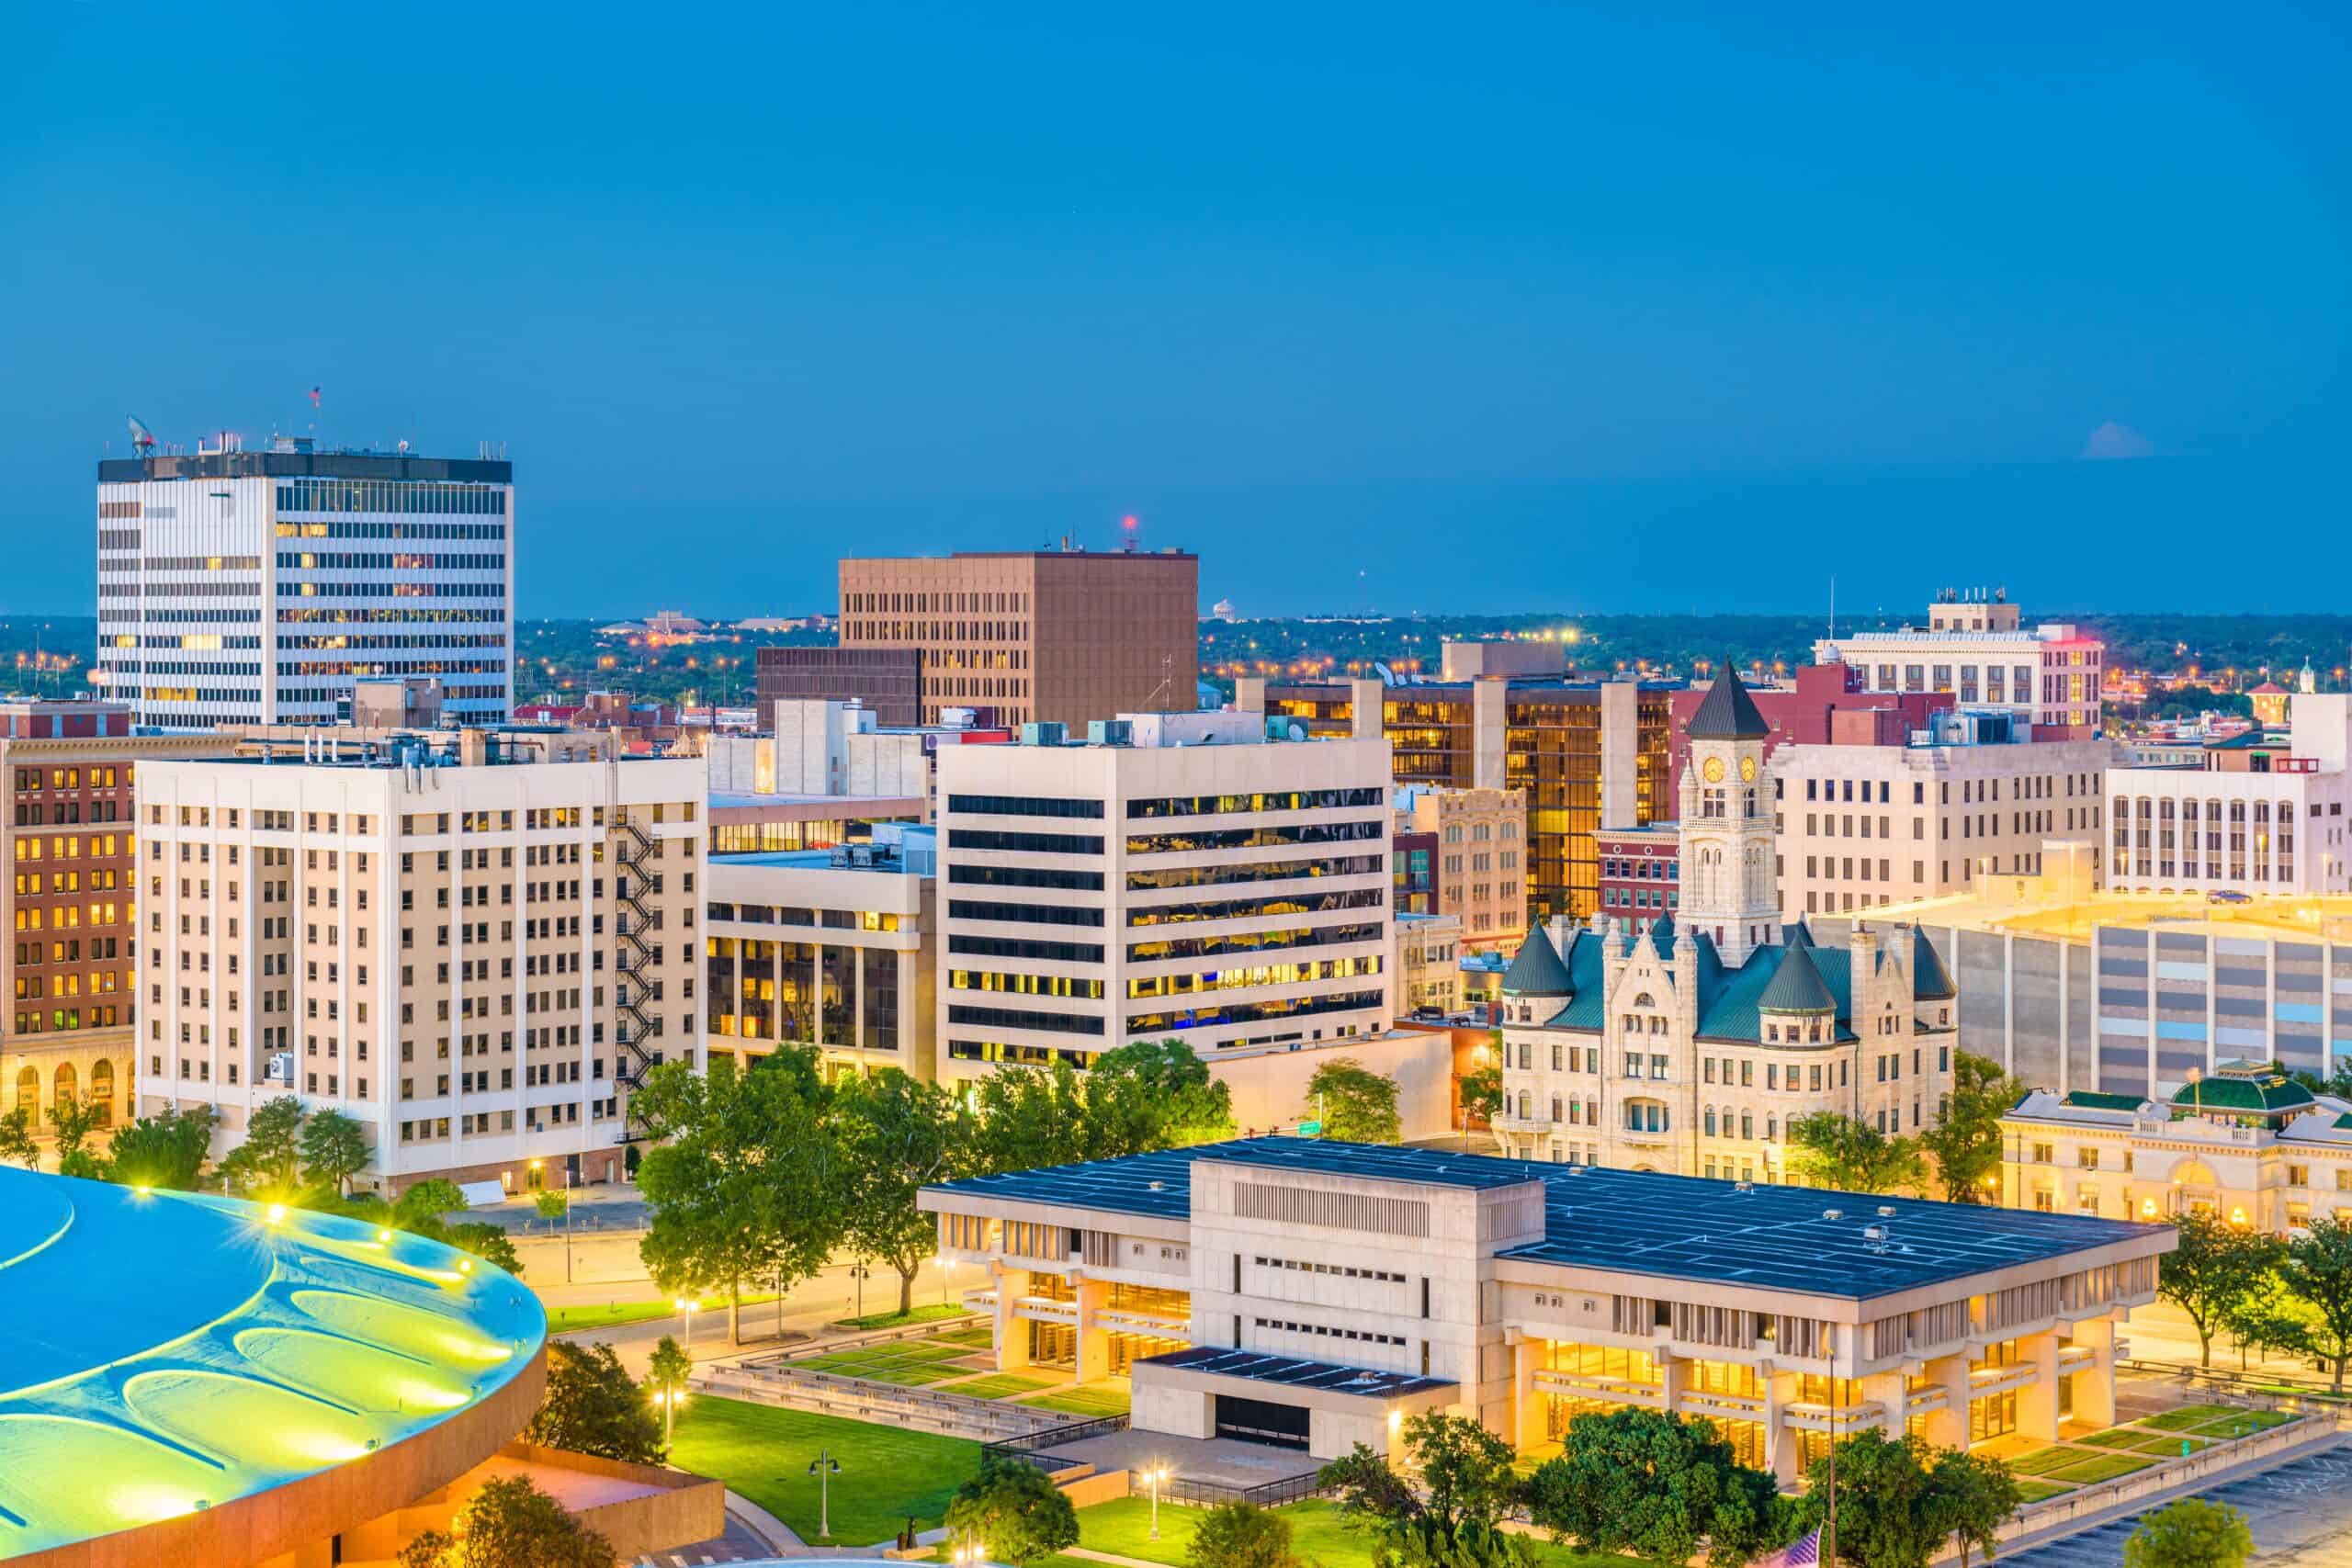
- Personal home goods expenditure, adjusted for population: $1,353 per capita
- Cost of living: -10.0% less than national average
- Total home goods expenditure: $4.0 billion
- Total population: 2.9 million
- Other major spending categories: Groceries, motor vehicles and parts, financial services and insurance, health care, gasoline and other energy goods
29. Wisconsin
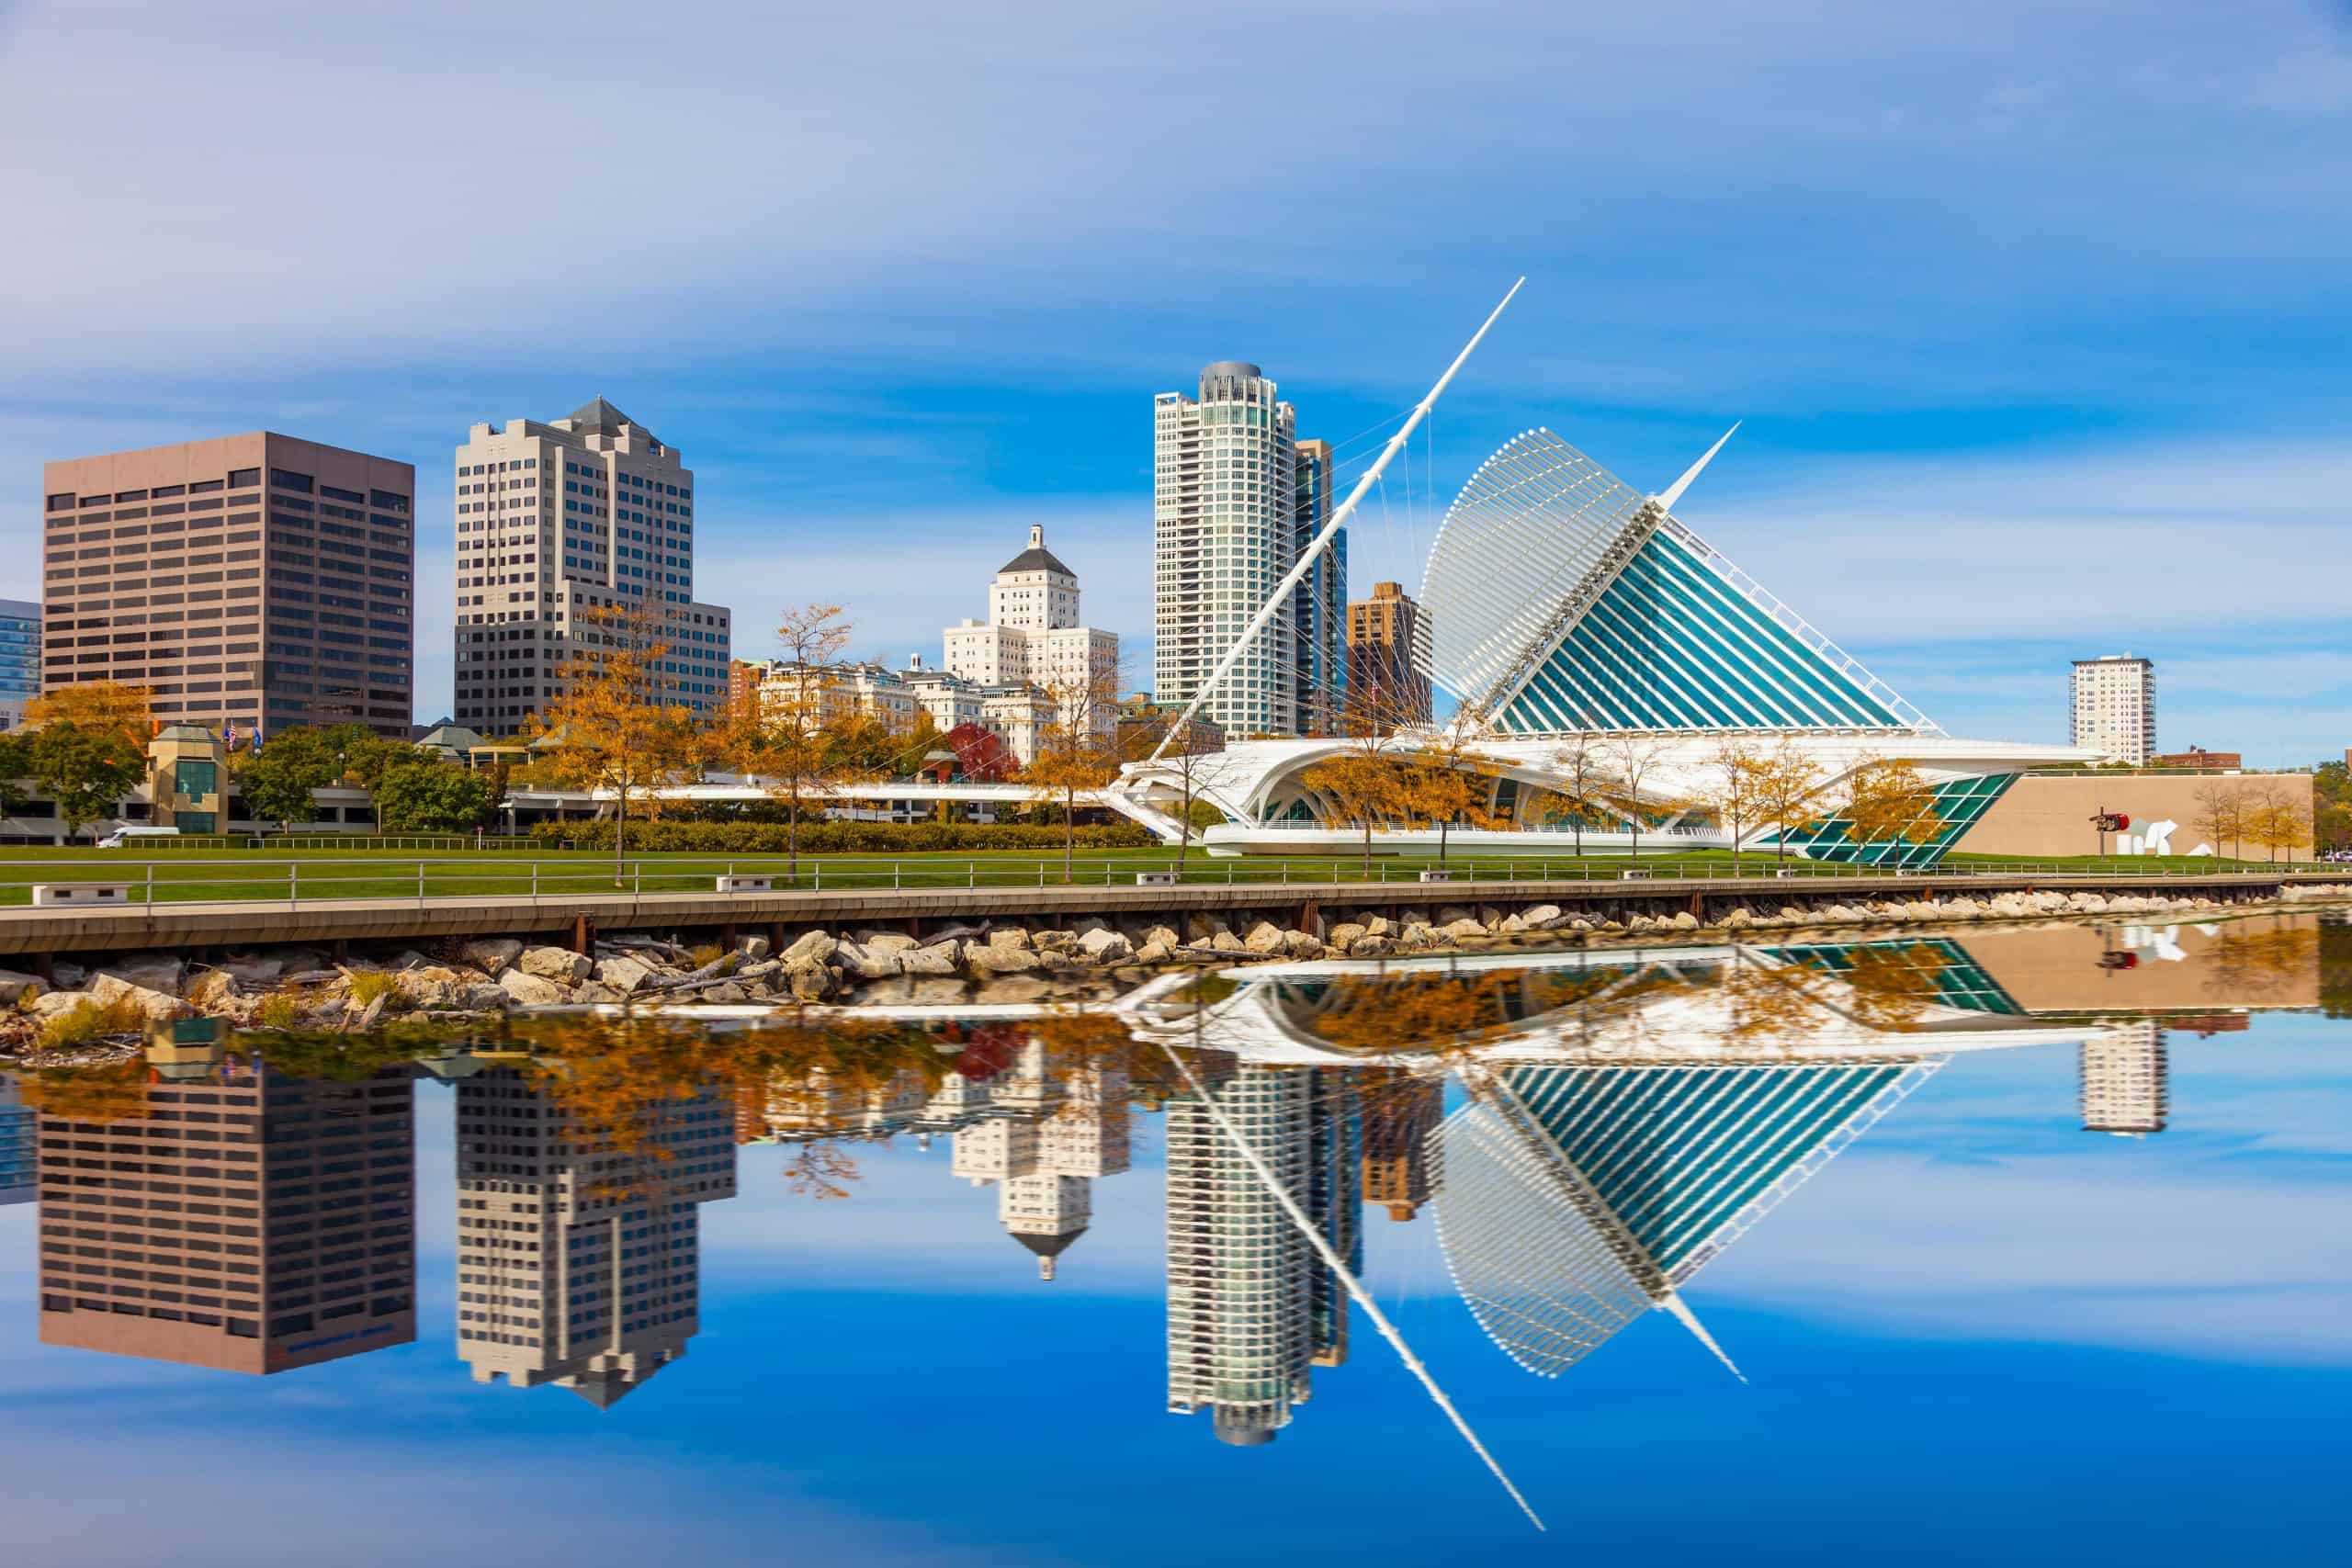
- Personal home goods expenditure, adjusted for population: $1,363 per capita
- Cost of living: -6.9% less than national average
- Total home goods expenditure: $8.1 billion
- Total population: 5.9 million
- Other major spending categories: Gasoline and other energy goods, motor vehicles and parts, recreational goods and vehicles, financial services and insurance, health care
28. Hawaii

- Personal home goods expenditure, adjusted for population: $1,367 per capita
- Cost of living: +8.6% more than national average
- Total home goods expenditure: $2.0 billion
- Total population: 1.4 million
- Other major spending categories: Groceries, food services and accommodations, housing and utilities, transportation services, recreation services, clothing and footwear
27. South Carolina

- Personal home goods expenditure, adjusted for population: $1,383 per capita
- Cost of living: -6.8% less than national average
- Total home goods expenditure: $7.4 billion
- Total population: 5.4 million
- Other major spending categories: Gasoline and other energy goods, motor vehicles and parts, clothing and footwear, groceries, housing and utilities, food services and accommodations
26. New York

- Personal home goods expenditure, adjusted for population: $1,413 per capita
- Cost of living: +7.6% more than national average
- Total home goods expenditure: $27.7 billion
- Total population: 19.6 million
- Other major spending categories: Clothing and footwear, health care, financial services and insurance, food services and accommodations, transportation services, housing and utilities
25. Wyoming

- Personal home goods expenditure, adjusted for population: $1,419 per capita
- Cost of living: -9.2% less than national average
- Total home goods expenditure: $828.6 million
- Total population: 584,057
- Other major spending categories: Financial services and insurance, clothing and footwear, motor vehicles and parts, gasoline and other energy goods, groceries, transportation services
24. Pennsylvania

- Personal home goods expenditure, adjusted for population: $1,419 per capita
- Cost of living: -2.5% less than national average
- Total home goods expenditure: $18.4 billion
- Total population: 13.0 million
- Other major spending categories: Recreational goods and vehicles, financial services and insurance, health care, gasoline and other energy goods, clothing and footwear
23. Texas

- Personal home goods expenditure, adjusted for population: $1,420 per capita
- Cost of living: -2.8% less than national average
- Total home goods expenditure: $43.3 billion
- Total population: 30.5 million
- Other major spending categories: Motor vehicles and parts, clothing and footwear, recreation services, financial services and insurance, food services and accommodations, recreational goods and vehicles
22. Virginia

- Personal home goods expenditure, adjusted for population: $1,420 per capita
- Cost of living: +0.7% more than national average
- Total home goods expenditure: $12.4 billion
- Total population: 8.7 million
- Other major spending categories: Recreation services, clothing and footwear, housing and utilities, recreational goods and vehicles, groceries, food services and accommodations
21. Vermont
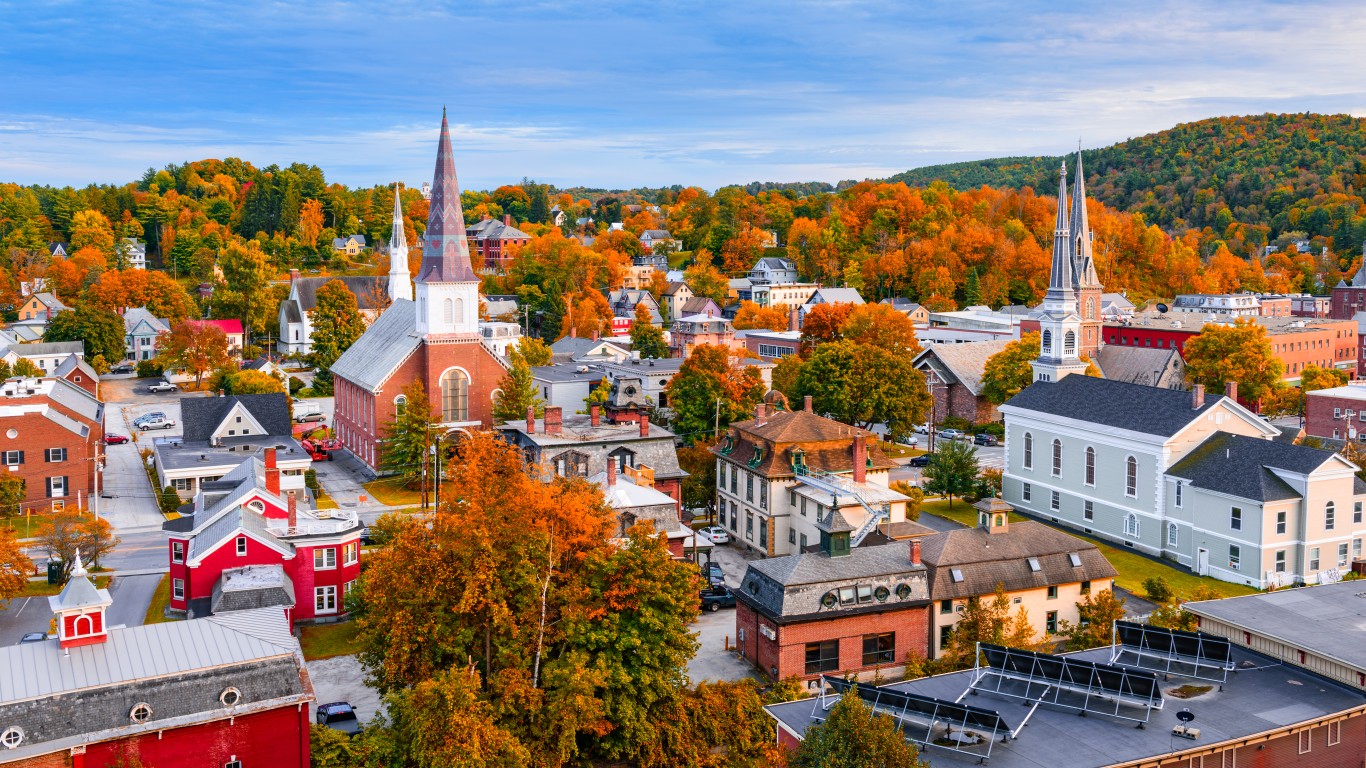
- Personal home goods expenditure, adjusted for population: $1,427 per capita
- Cost of living: -3.4% less than national average
- Total home goods expenditure: $923.7 million
- Total population: 647,464
- Other major spending categories: Groceries, motor vehicles and parts, health care, food services and accommodations, recreation services, gasoline and other energy goods
20. South Dakota
- Personal home goods expenditure, adjusted for population: $1,444 per capita
- Cost of living: -11.9% less than national average
- Total home goods expenditure: $1.3 billion
- Total population: 919,318
- Other major spending categories: Health care, recreation services, transportation services, clothing and footwear, food services and accommodations
19. Illinois

- Personal home goods expenditure, adjusted for population: $1,451 per capita
- Cost of living: -1.1% less than national average
- Total home goods expenditure: $18.2 billion
- Total population: 12.5 million
- Other major spending categories: Clothing and footwear, transportation services, recreational goods and vehicles, financial services and insurance, food services and accommodations
18. North Dakota
- Personal home goods expenditure, adjusted for population: $1,472 per capita
- Cost of living: -11.4% less than national average
- Total home goods expenditure: $1.2 billion
- Total population: 783,926
- Other major spending categories: Recreational goods and vehicles, health care, financial services and insurance, motor vehicles and parts, clothing and footwear
17. Maine
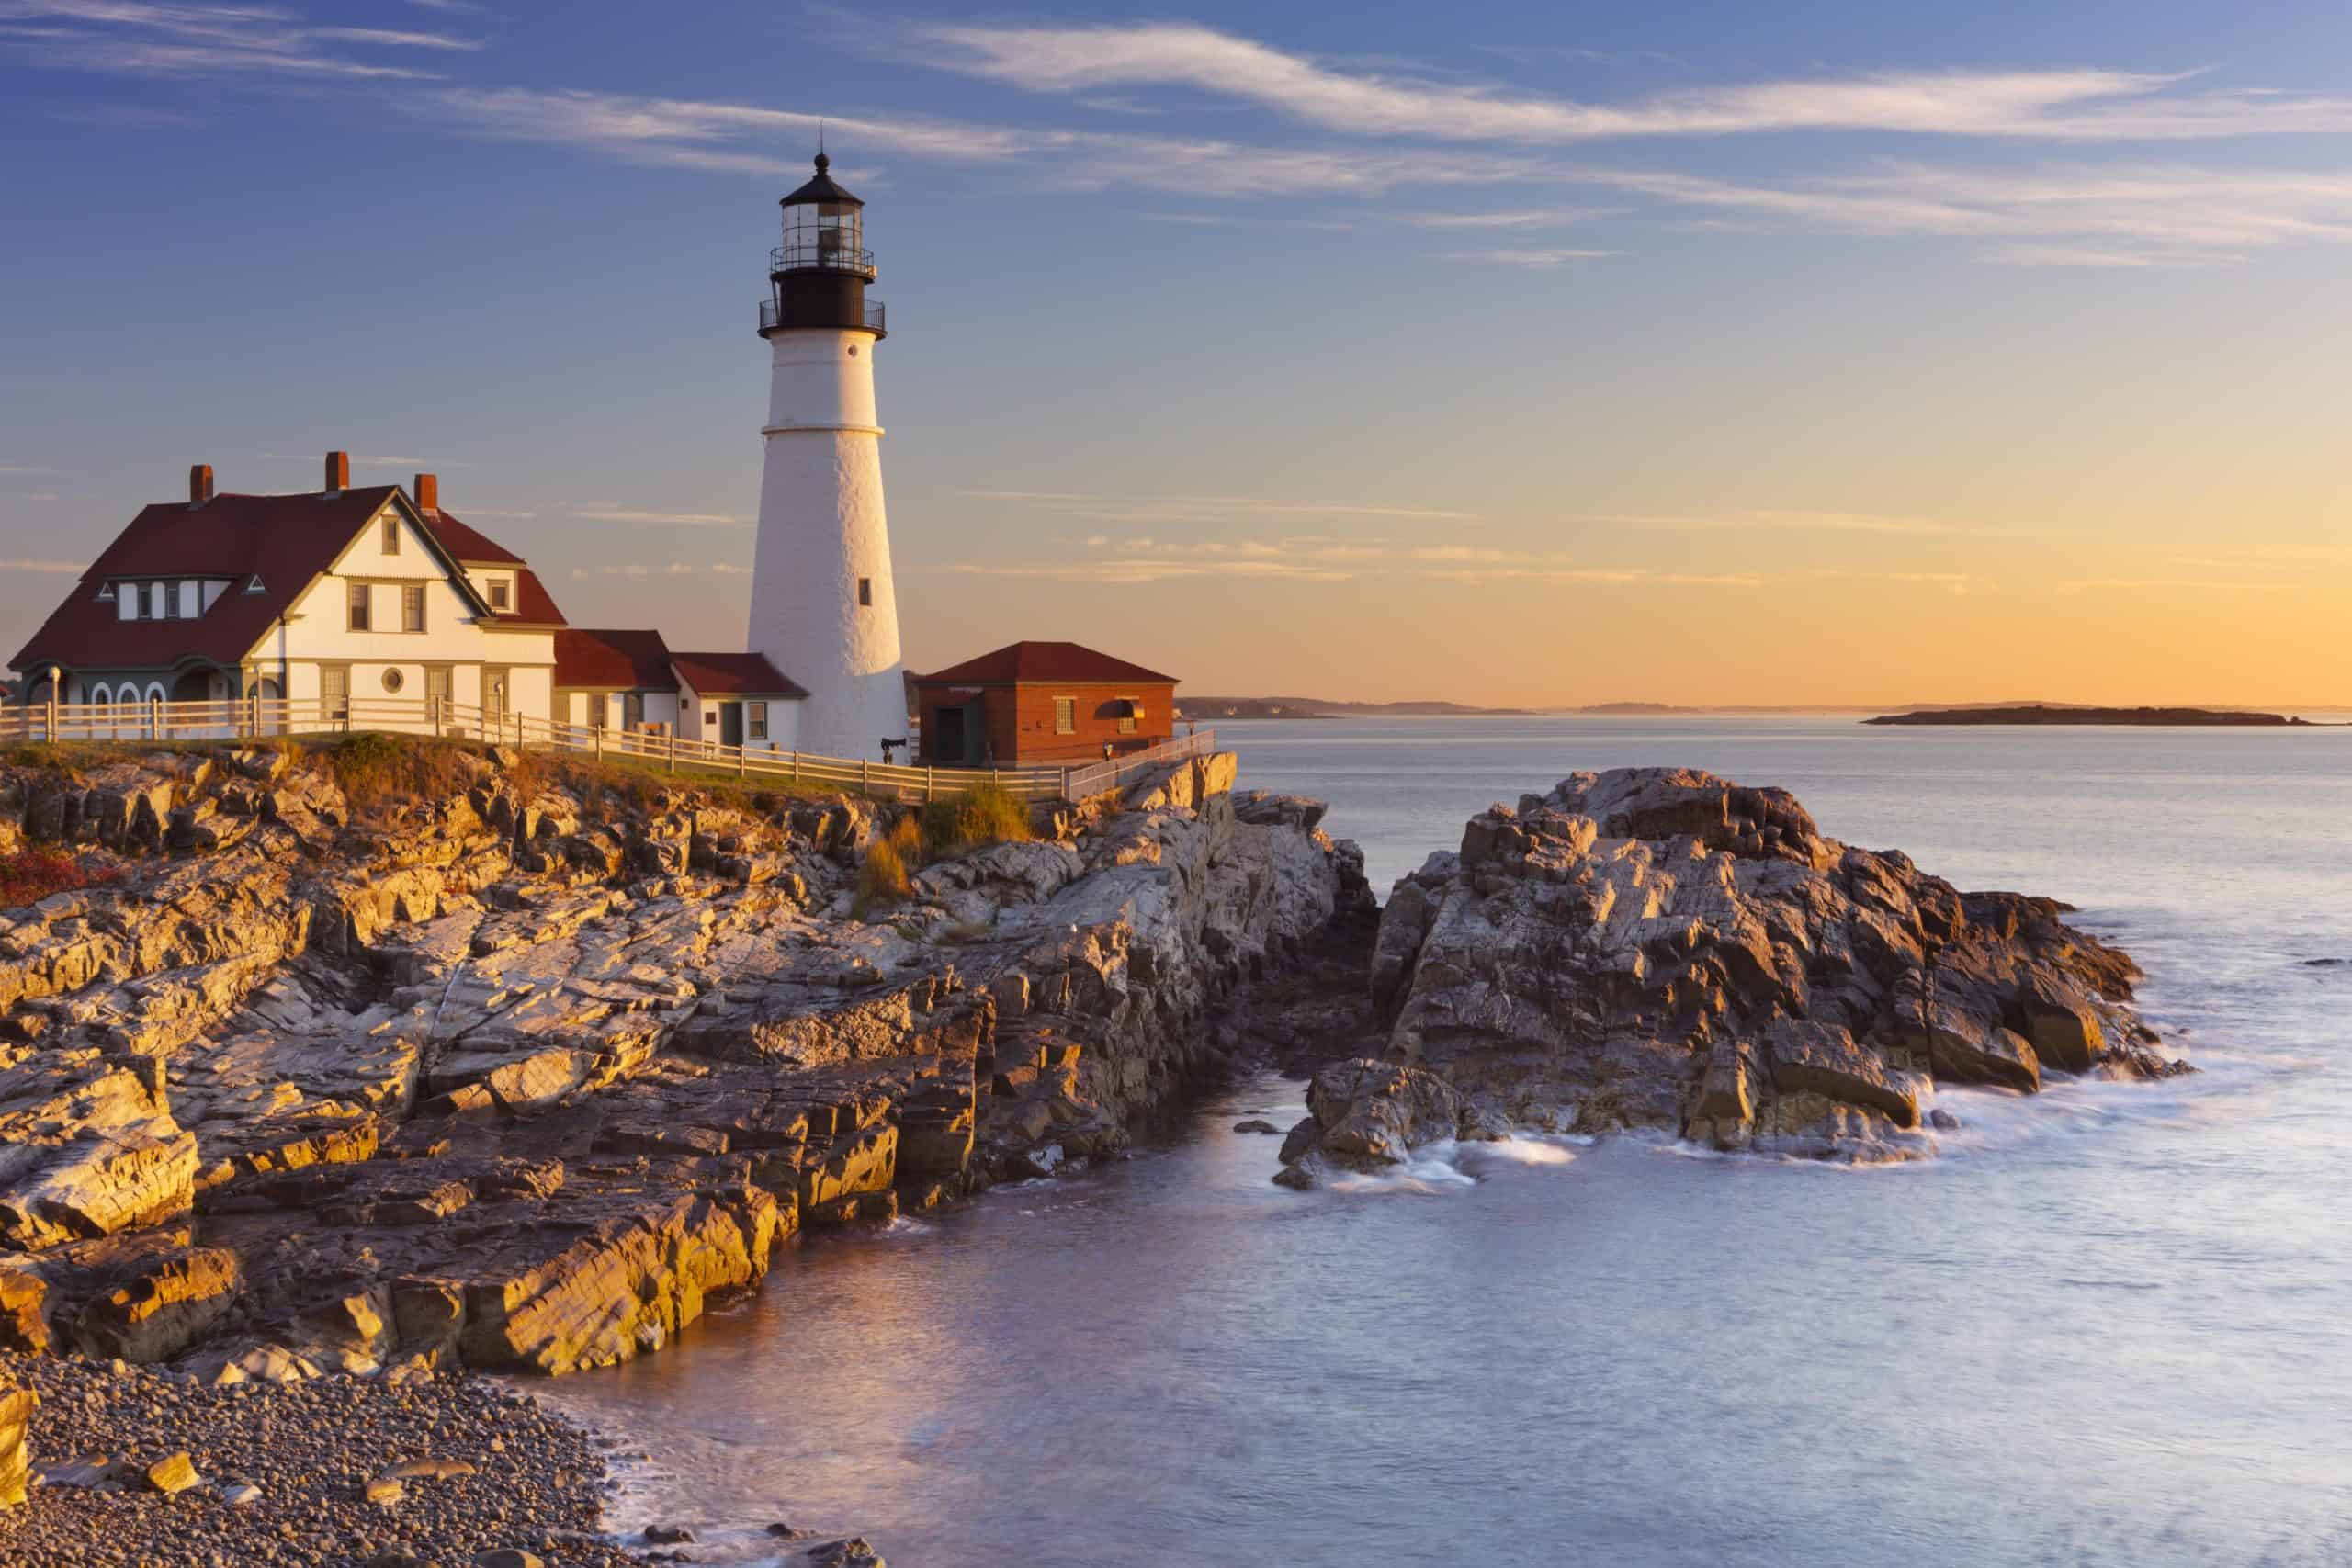
- Personal home goods expenditure, adjusted for population: $1,480 per capita
- Cost of living: -2.9% less than national average
- Total home goods expenditure: $2.1 billion
- Total population: 1.4 million
- Other major spending categories: Groceries, gasoline and other energy goods, recreation services, food services and accommodations, motor vehicles and parts, health care
16. Montana
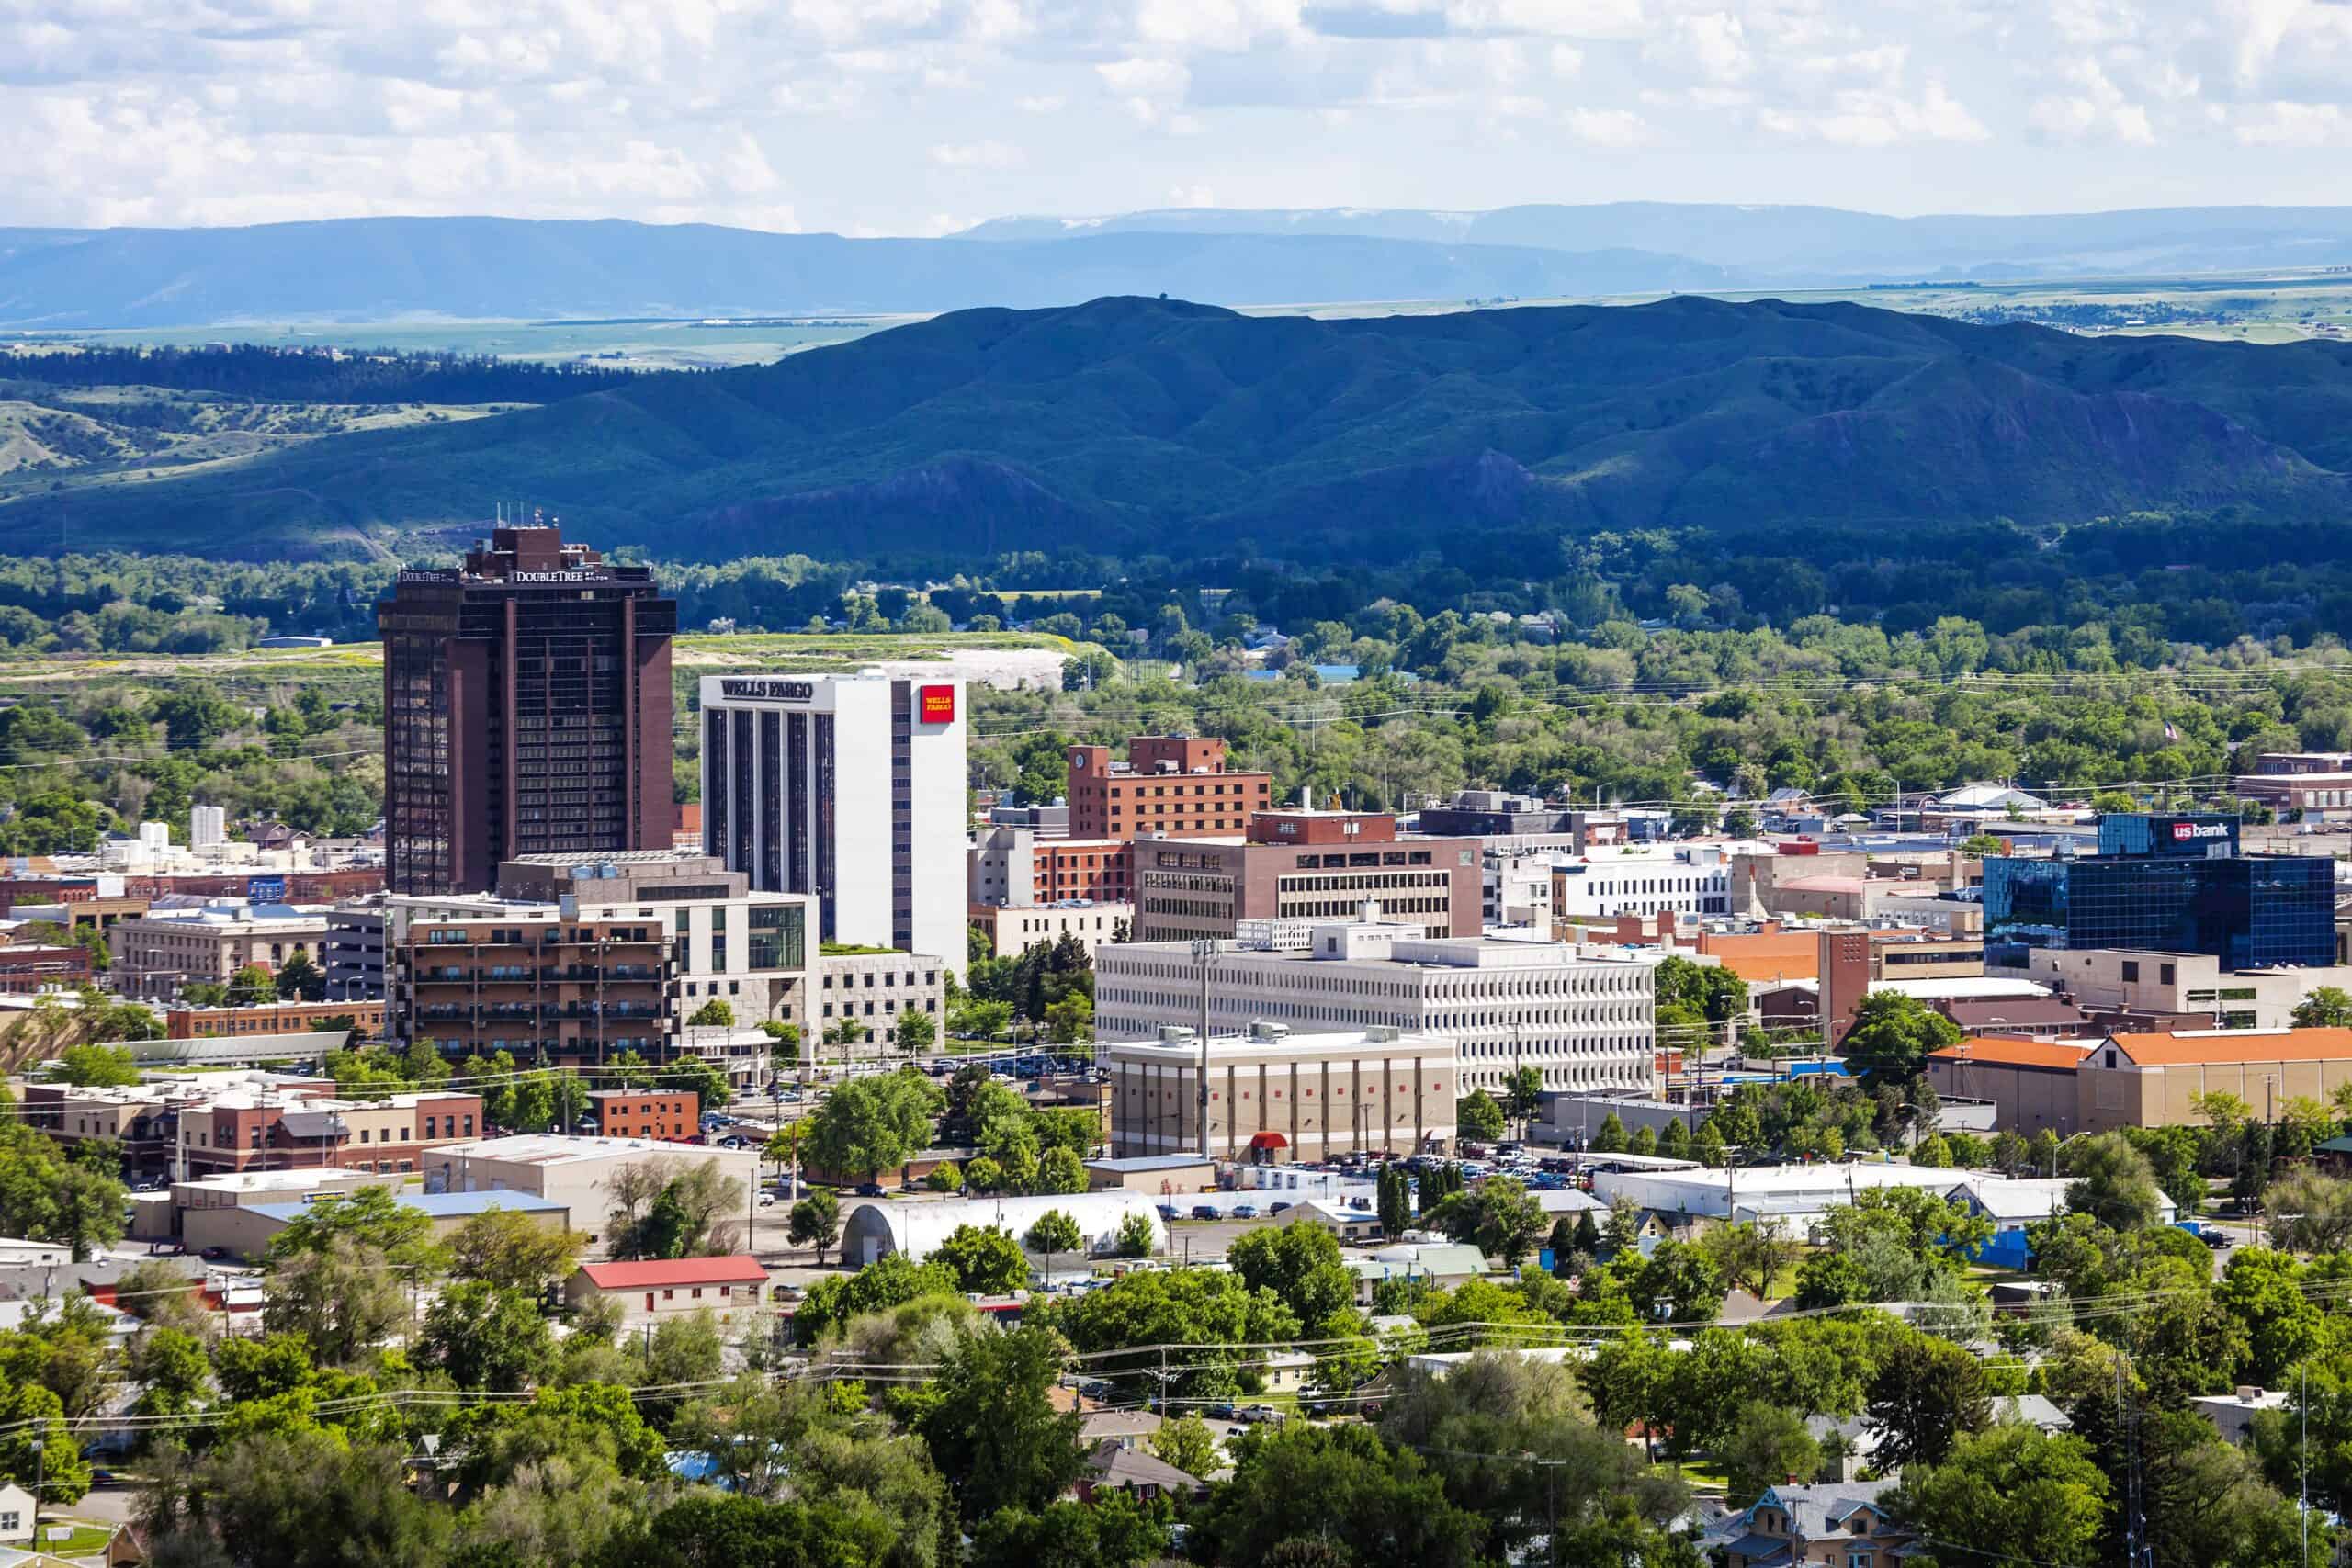
- Personal home goods expenditure, adjusted for population: $1,485 per capita
- Cost of living: -9.8% less than national average
- Total home goods expenditure: $1.7 billion
- Total population: 1.1 million
- Other major spending categories: Motor vehicles and parts, groceries, recreation services, gasoline and other energy goods, transportation services, recreational goods and vehicles
15. Arizona
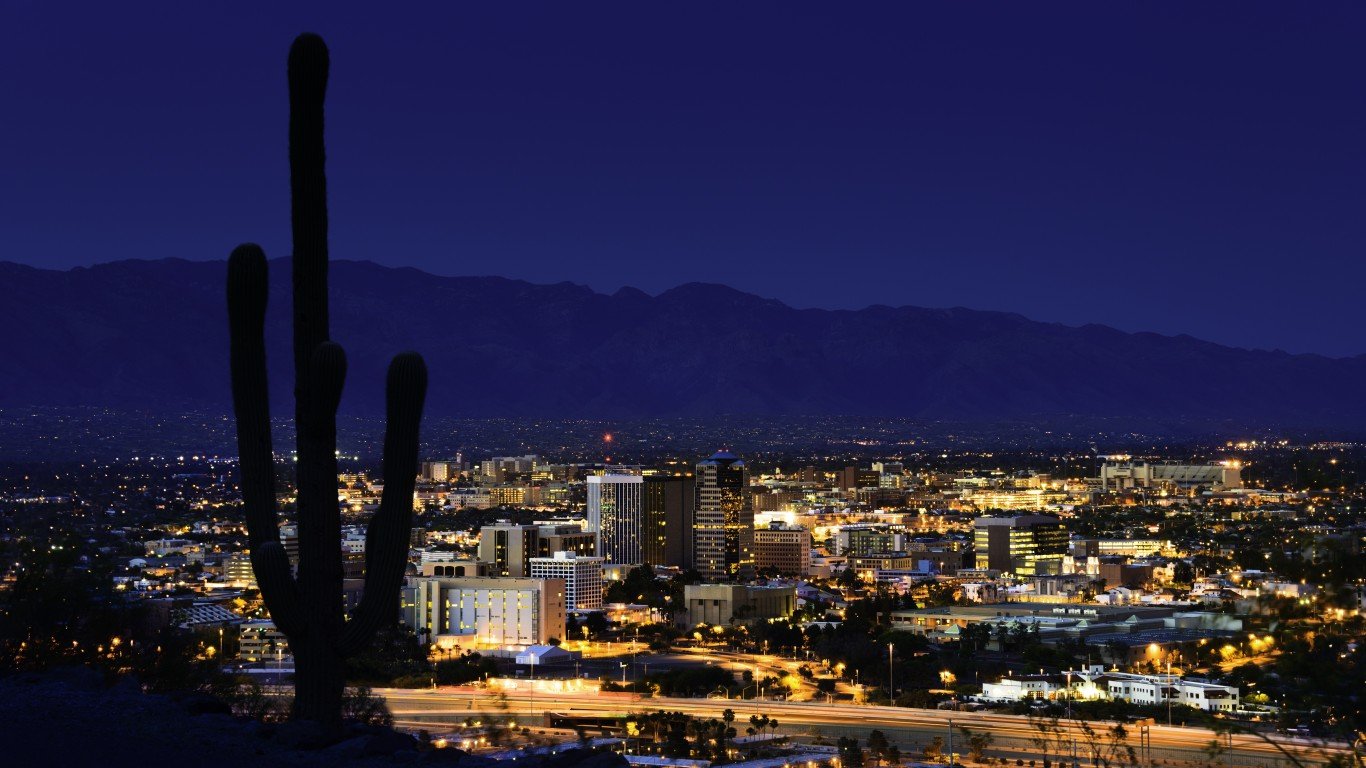
- Personal home goods expenditure, adjusted for population: $1,487 per capita
- Cost of living: +1.1% more than national average
- Total home goods expenditure: $11.0 billion
- Total population: 7.4 million
- Other major spending categories: Housing and utilities, transportation services, food services and accommodations, motor vehicles and parts, recreation services
14. California
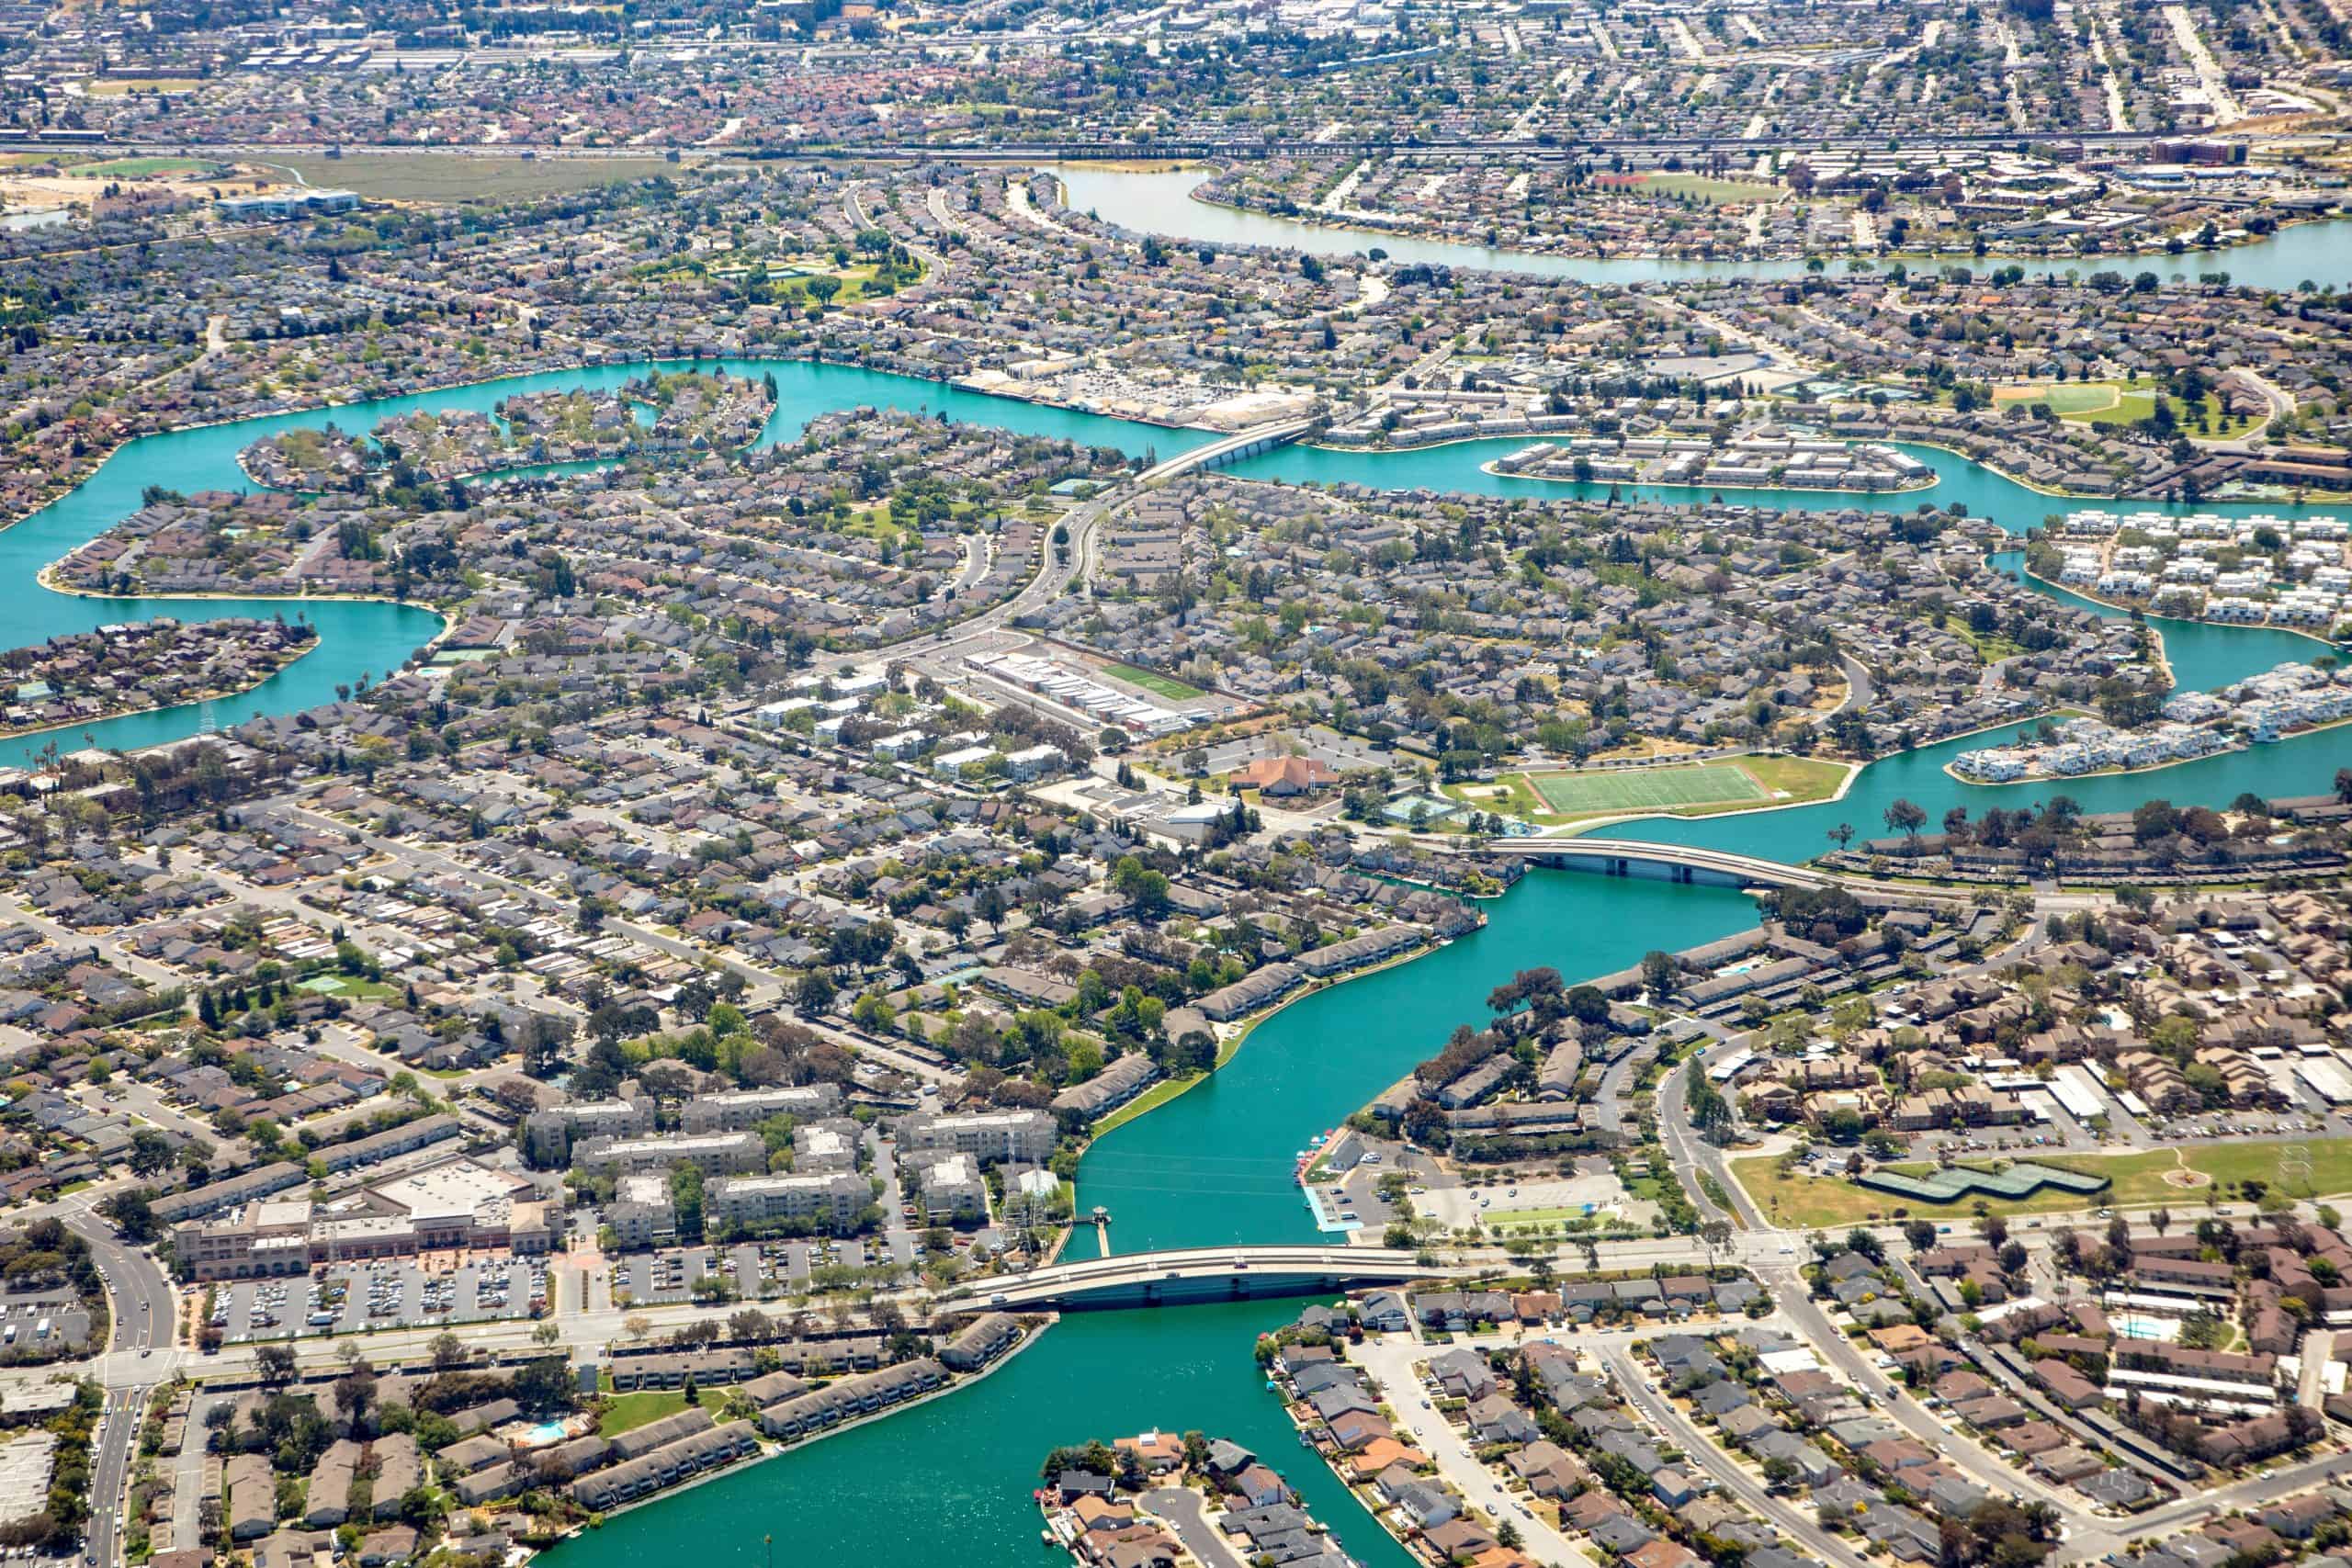
- Personal home goods expenditure, adjusted for population: $1,488 per capita
- Cost of living: +12.6% more than national average
- Total home goods expenditure: $58.0 billion
- Total population: 39.0 million
- Other major spending categories: Clothing and footwear, recreation services, food services and accommodations, housing and utilities, transportation services, health care
13. Washington

- Personal home goods expenditure, adjusted for population: $1,491 per capita
- Cost of living: +8.6% more than national average
- Total home goods expenditure: $11.7 billion
- Total population: 7.8 million
- Other major spending categories: Transportation services, recreational goods and vehicles, recreation services, housing and utilities, groceries
12. North Carolina

- Personal home goods expenditure, adjusted for population: $1,514 per capita
- Cost of living: -5.9% less than national average
- Total home goods expenditure: $16.4 billion
- Total population: 10.8 million
- Other major spending categories: Recreational goods and vehicles, motor vehicles and parts, clothing and footwear, groceries, recreation services
11. Nevada
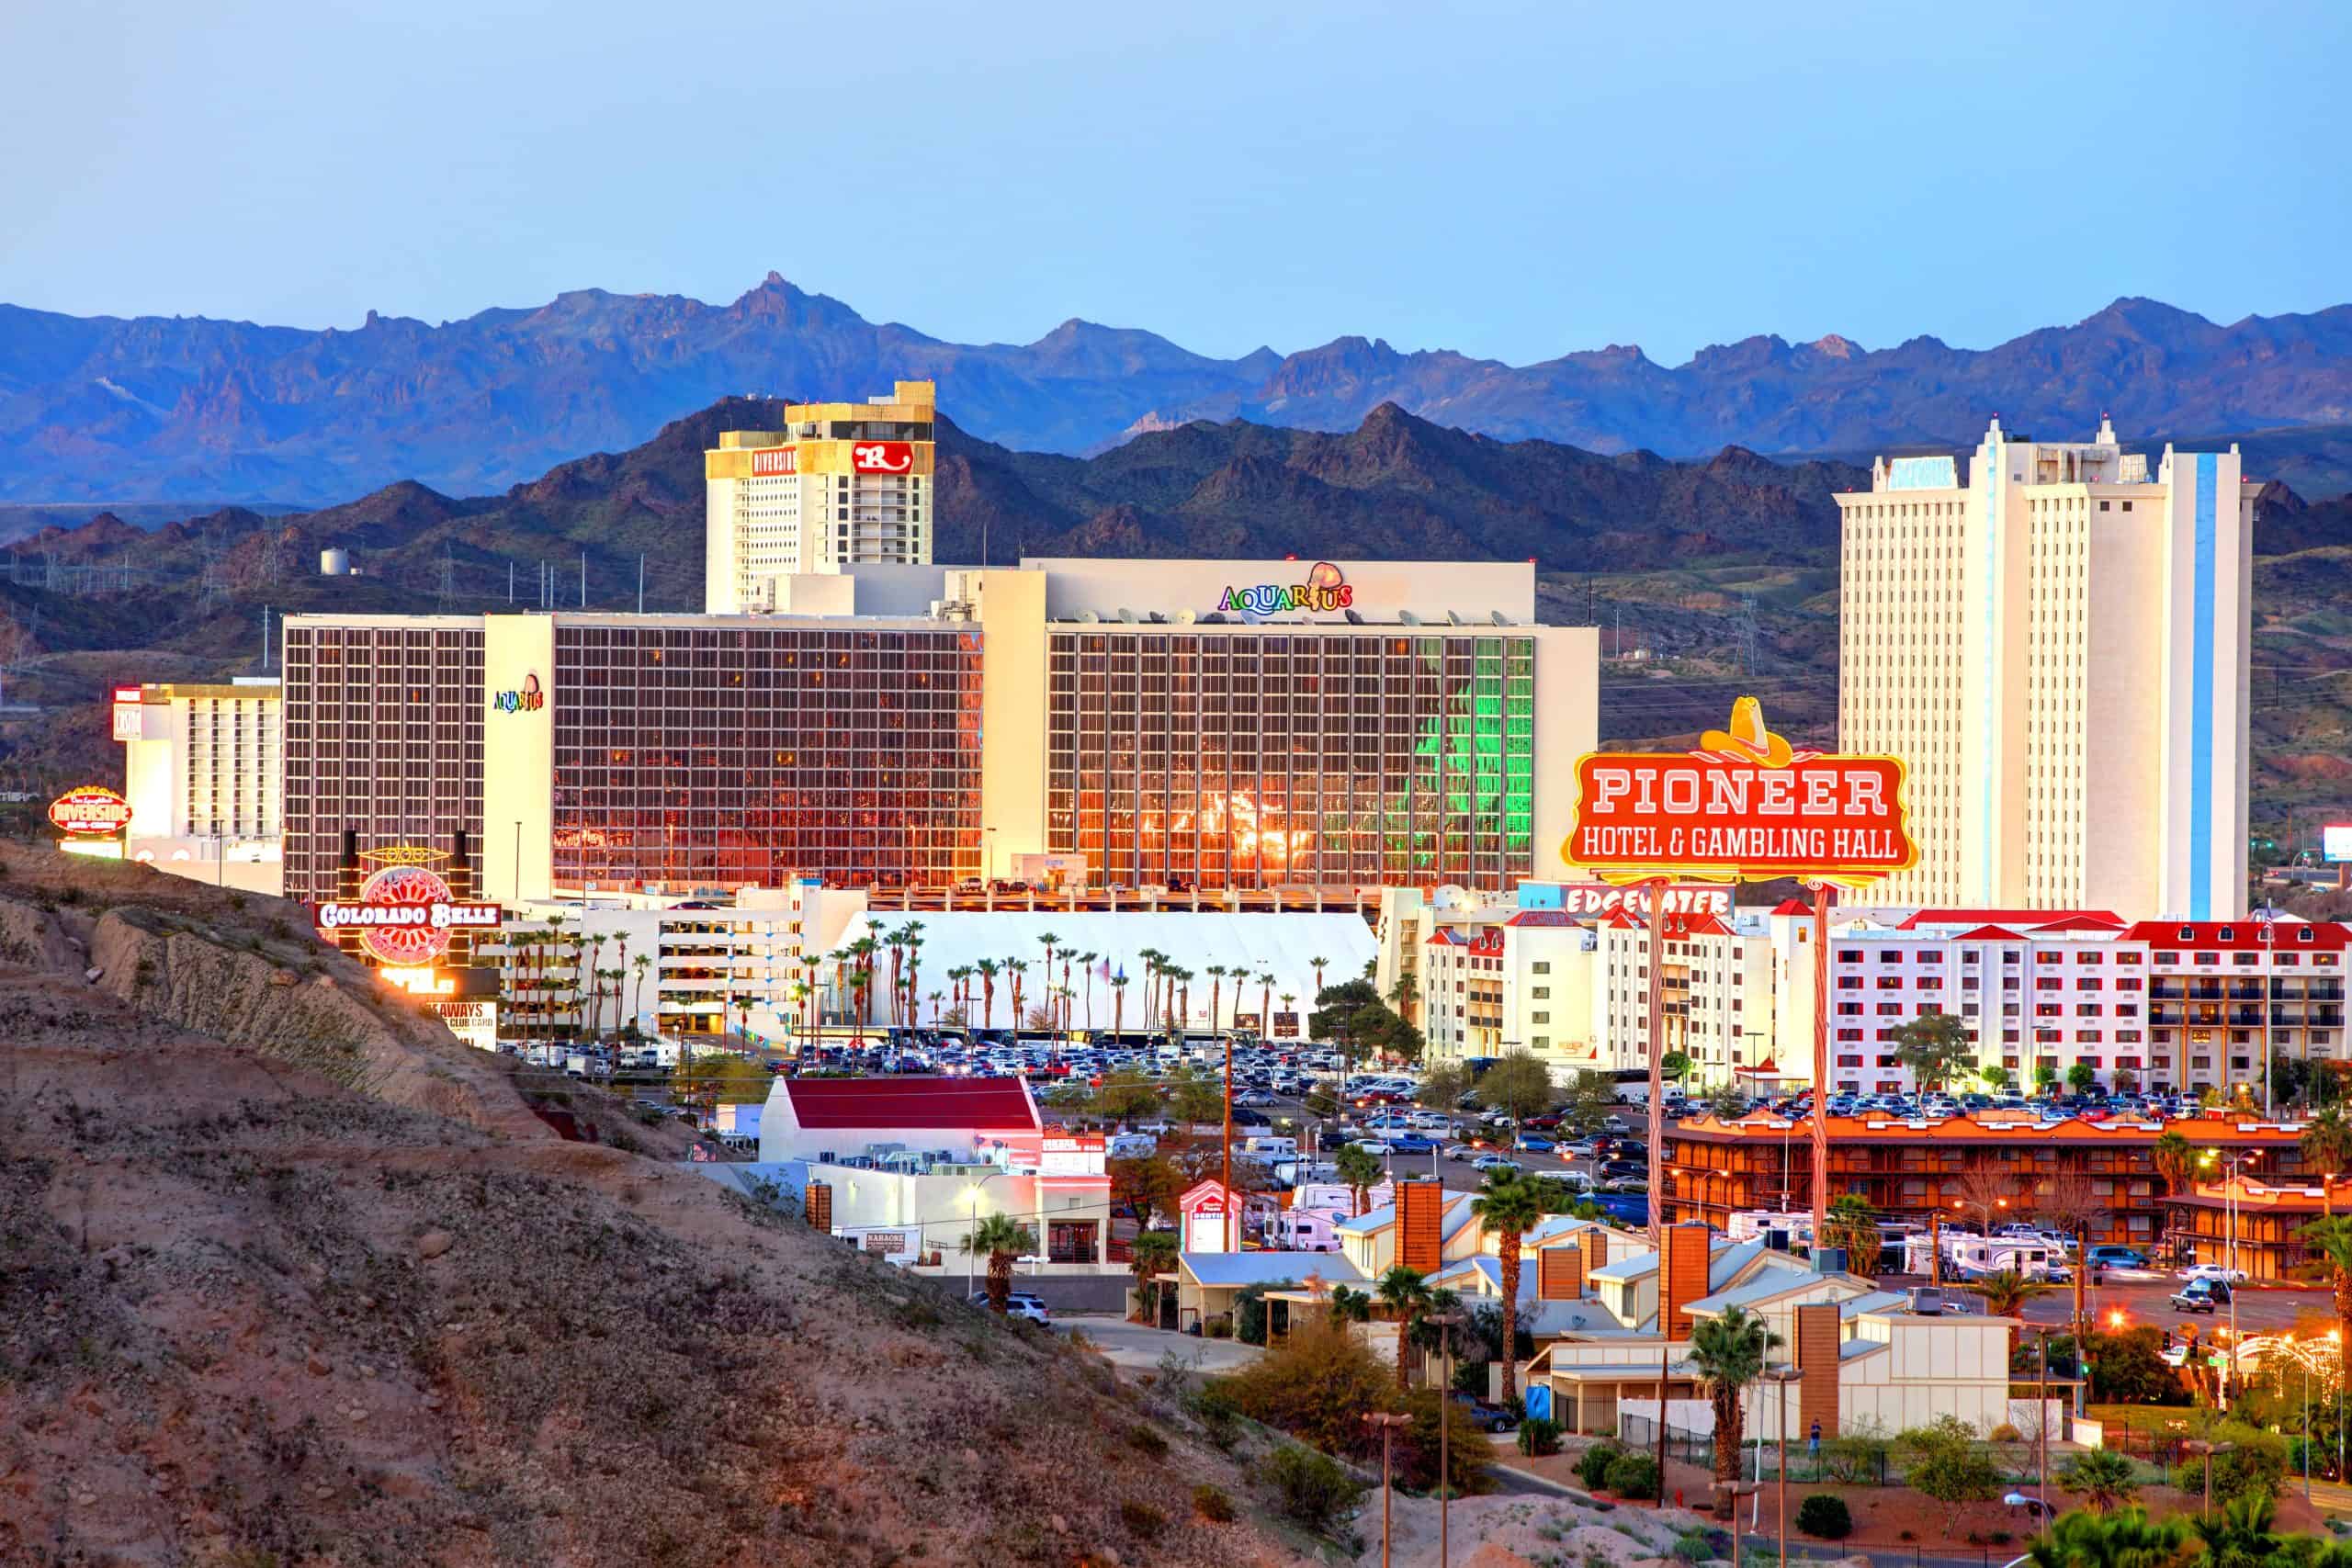
- Personal home goods expenditure, adjusted for population: $1,514 per capita
- Cost of living: -3.0% less than national average
- Total home goods expenditure: $4.8 billion
- Total population: 3.2 million
- Other major spending categories: Groceries, recreation services, housing and utilities, food services and accommodations, financial services and insurance
10. Delaware
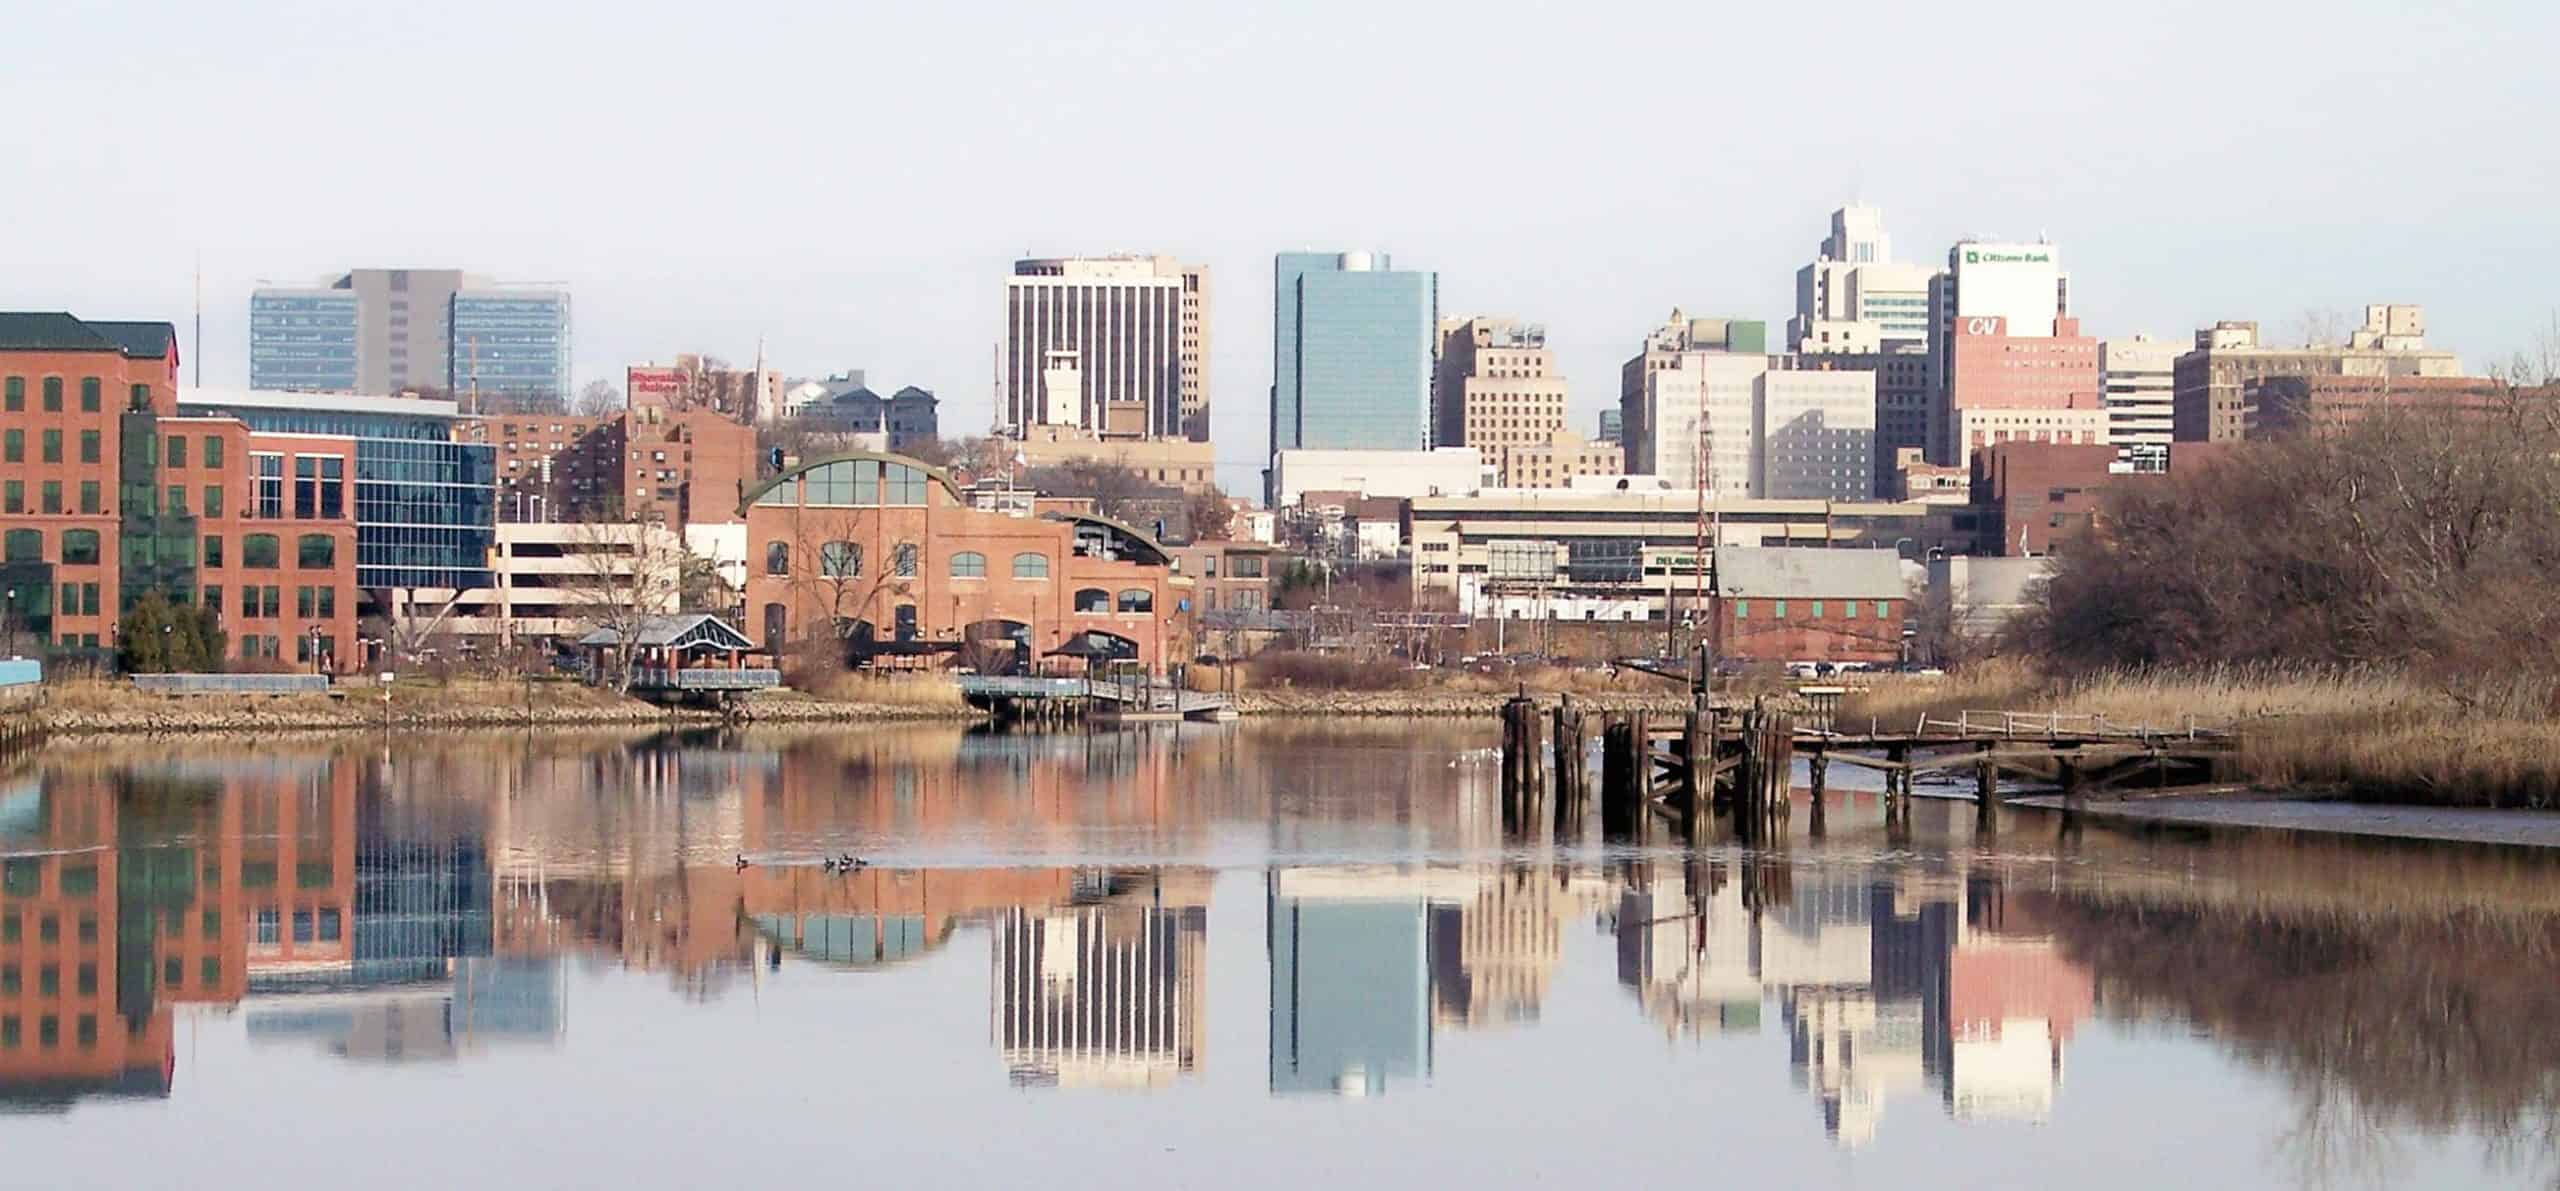
- Personal home goods expenditure, adjusted for population: $1,533 per capita
- Cost of living: -0.7% less than national average
- Total home goods expenditure: $1.6 billion
- Total population: 1.0 million
- Other major spending categories: Health care, food services and accommodations, gasoline and other energy goods, housing and utilities, clothing and footwear
9. Alaska

- Personal home goods expenditure, adjusted for population: $1,555 per capita
- Cost of living: +1.7% more than national average
- Total home goods expenditure: $1.1 billion
- Total population: 733,406
- Other major spending categories: Health care, recreation services, recreational goods and vehicles, transportation services, food services and accommodations
8. Massachusetts
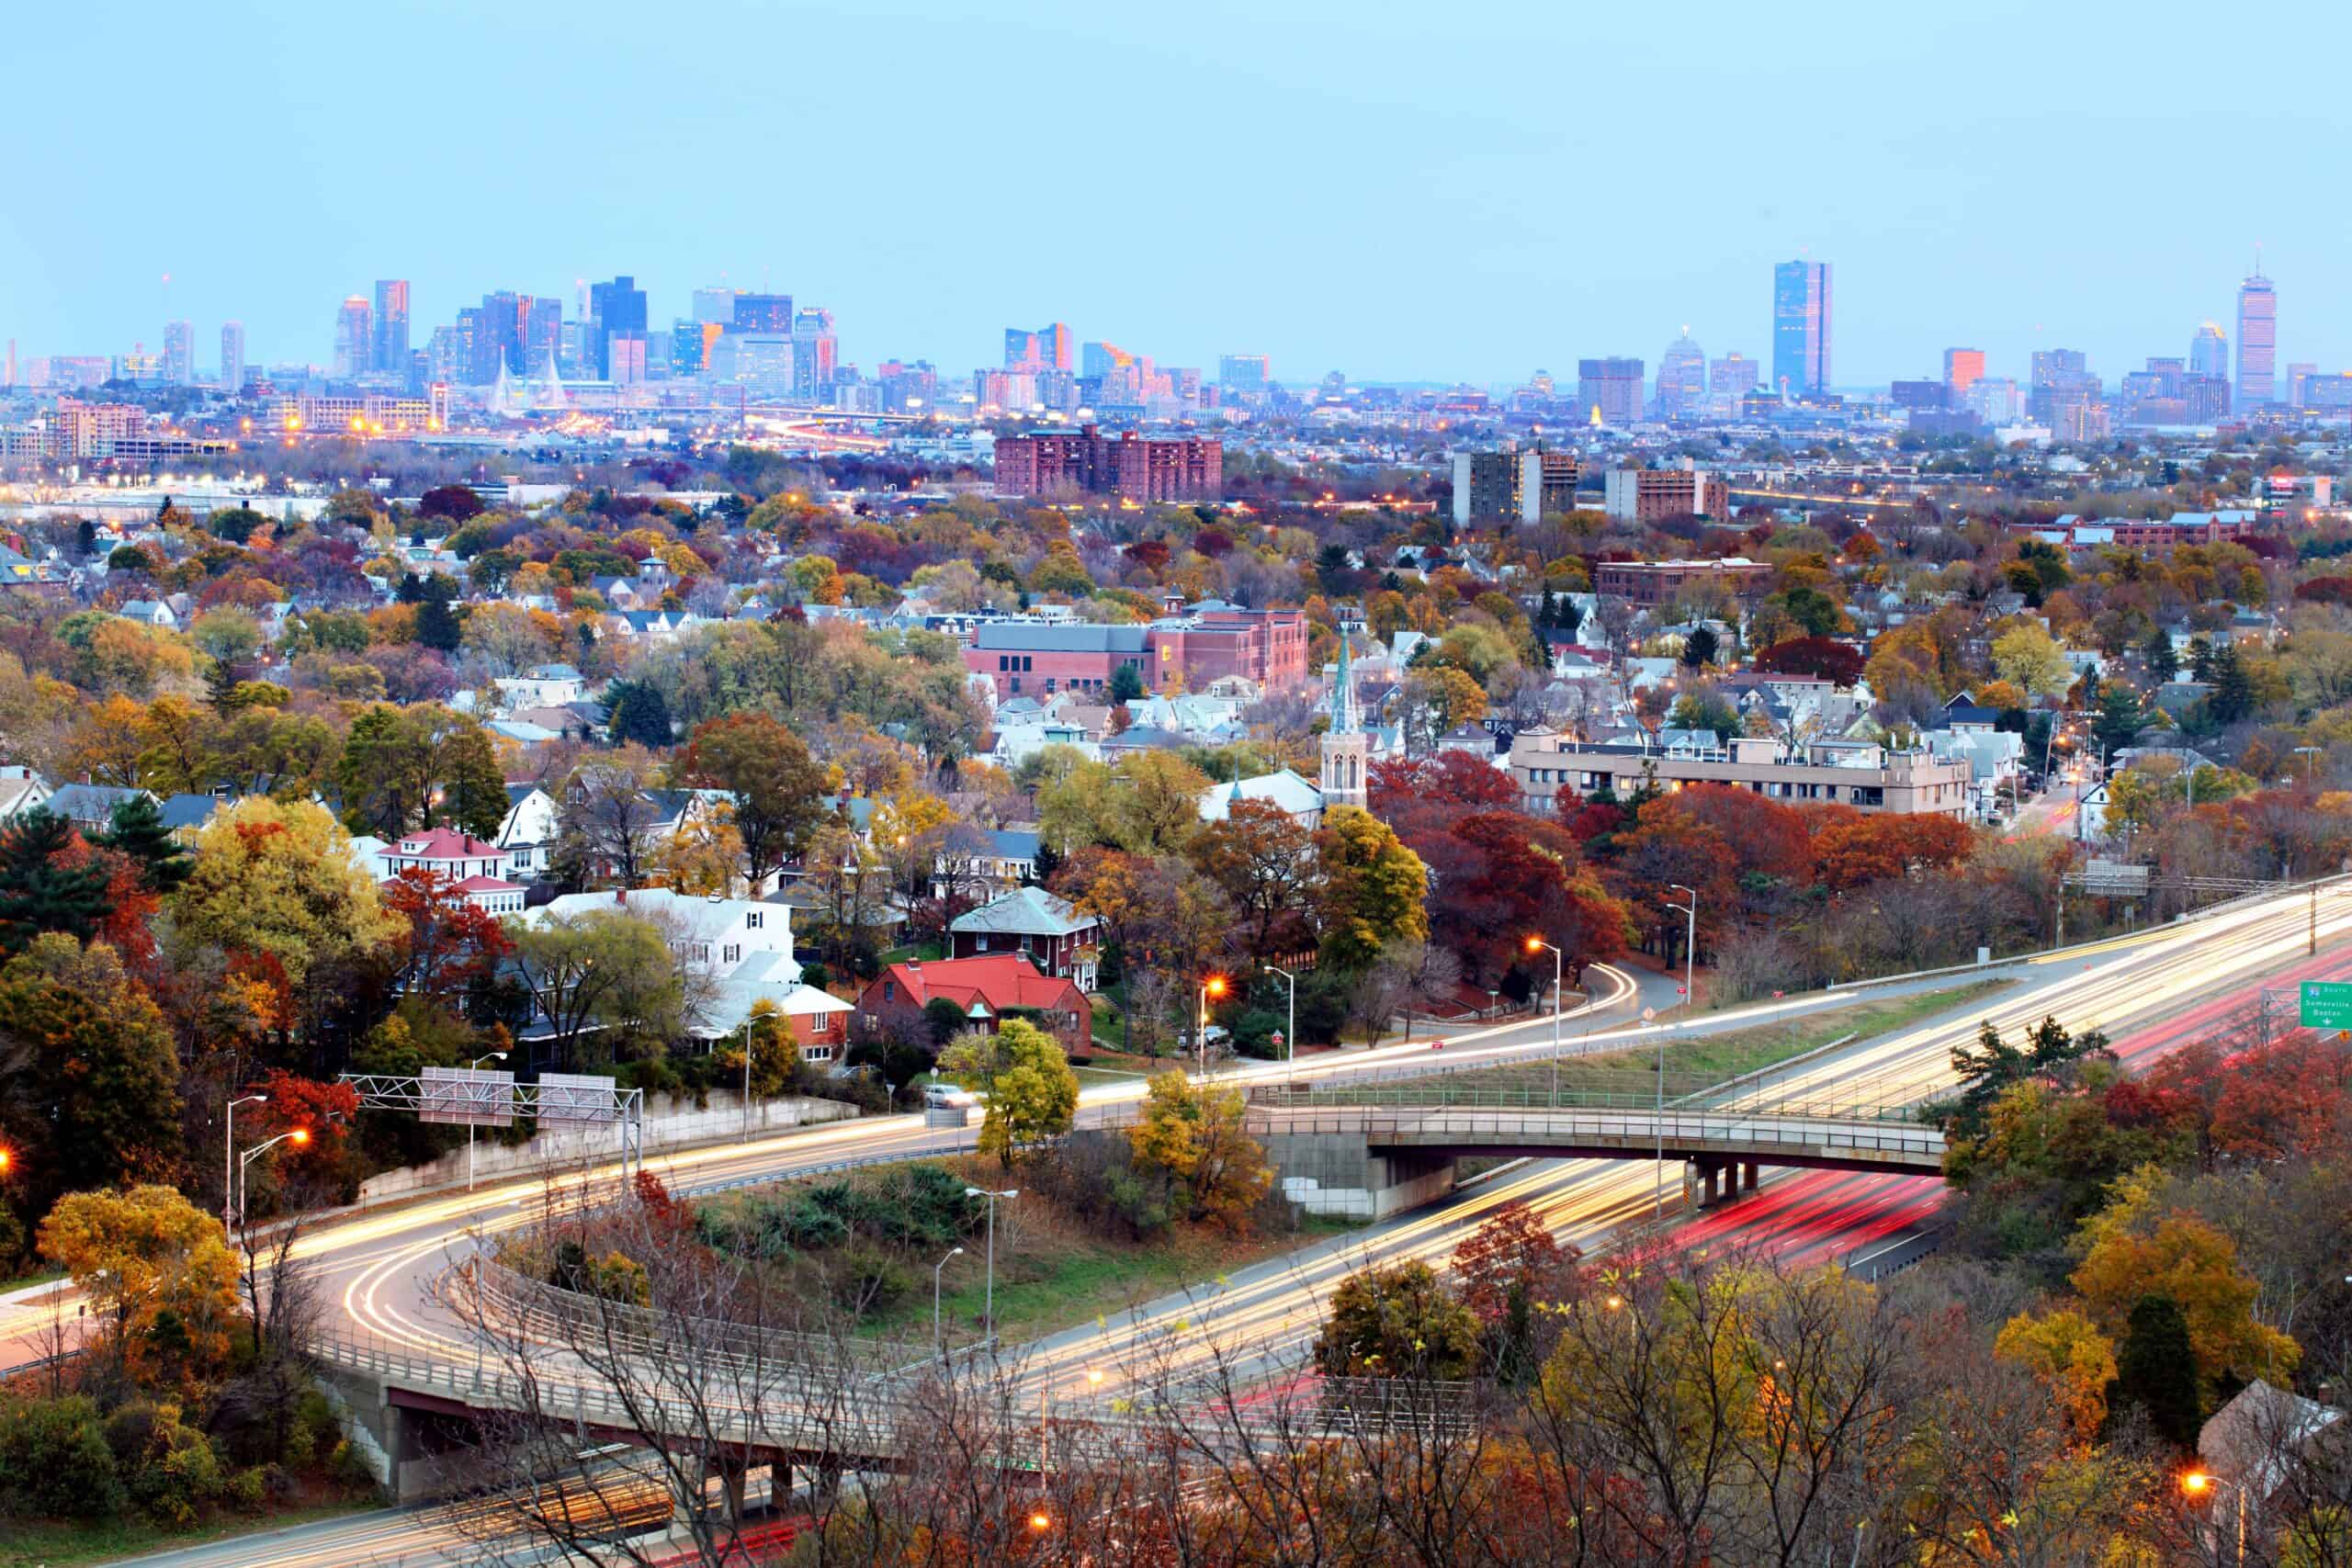
- Personal home goods expenditure, adjusted for population: $1,562 per capita
- Cost of living: +8.2% more than national average
- Total home goods expenditure: $10.9 billion
- Total population: 7.0 million
- Other major spending categories: Transportation services, housing and utilities, financial services and insurance, health care, recreation services, food services and accommodations
7. Utah

- Personal home goods expenditure, adjusted for population: $1,620 per capita
- Cost of living: -5.0% less than national average
- Total home goods expenditure: $5.5 billion
- Total population: 3.4 million
- Other major spending categories: Recreational goods and vehicles, motor vehicles and parts, transportation services, gasoline and other energy goods, housing and utilities
6. Connecticut

- Personal home goods expenditure, adjusted for population: $1,633 per capita
- Cost of living: +3.7% more than national average
- Total home goods expenditure: $5.9 billion
- Total population: 3.6 million
- Other major spending categories: Financial services and insurance, transportation services, recreation services, housing and utilities, clothing and footwear
5. New Jersey
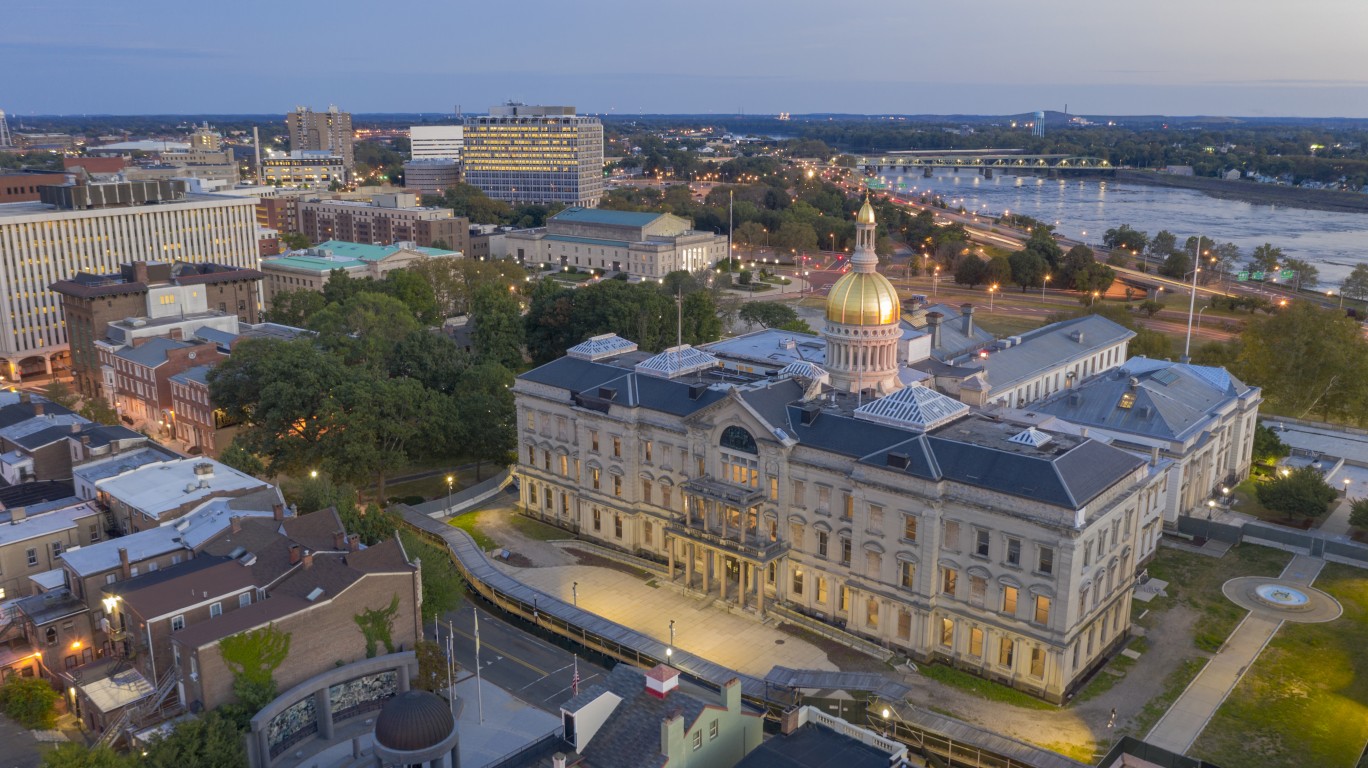
- Personal home goods expenditure, adjusted for population: $1,657 per capita
- Cost of living: +8.9% more than national average
- Total home goods expenditure: $15.4 billion
- Total population: 9.3 million
- Other major spending categories: Clothing and footwear, housing and utilities, financial services and insurance, recreation services, health care
4. New Hampshire

- Personal home goods expenditure, adjusted for population: $1,660 per capita
- Cost of living: +5.3% more than national average
- Total home goods expenditure: $2.3 billion
- Total population: 1.4 million
- Other major spending categories: Motor vehicles and parts, groceries, financial services and insurance, housing and utilities, clothing and footwear
3. Oregon

- Personal home goods expenditure, adjusted for population: $1,662 per capita
- Cost of living: +4.7% more than national average
- Total home goods expenditure: $7.0 billion
- Total population: 4.2 million
- Other major spending categories: Recreational goods and vehicles, groceries, clothing and footwear, food services and accommodations, housing and utilities
2. Florida
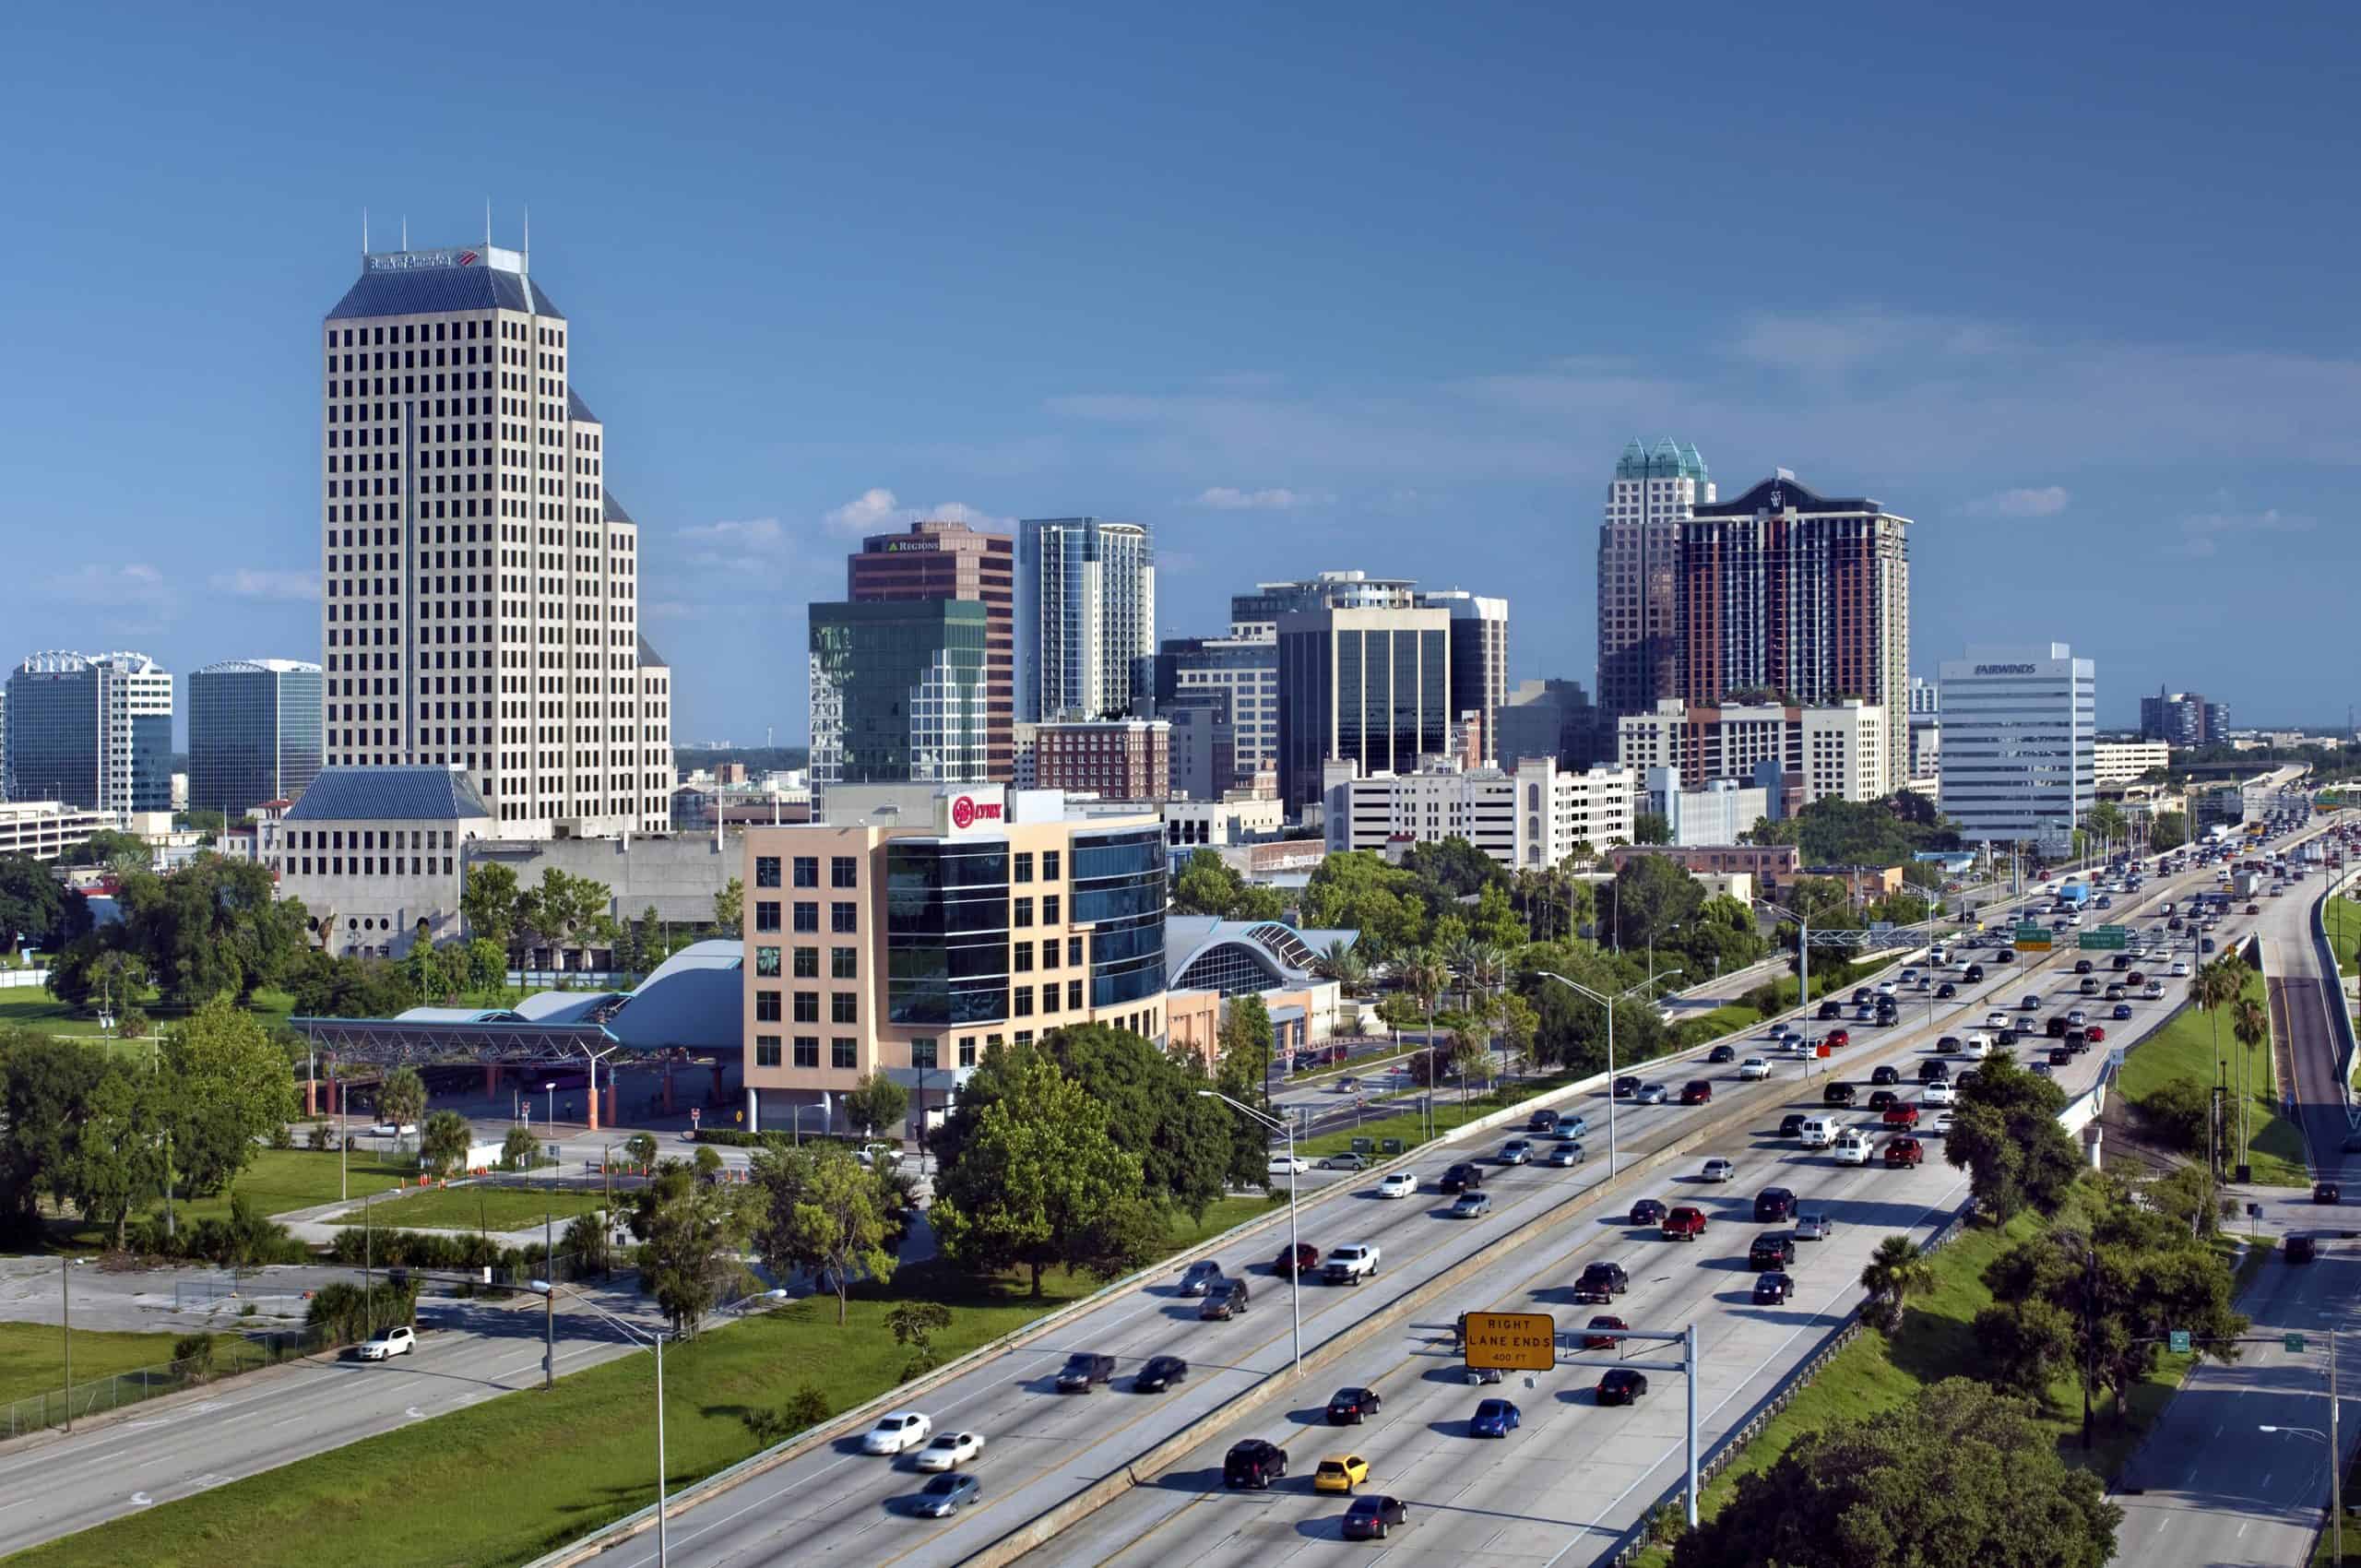
- Personal home goods expenditure, adjusted for population: $1,743 per capita
- Cost of living: +3.5% more than national average
- Total home goods expenditure: $39.4 billion
- Total population: 22.6 million
- Other major spending categories: Housing and utilities, financial services and insurance, food services and accommodations, recreational goods and vehicles, groceries
1. Colorado

- Personal home goods expenditure, adjusted for population: $1,767 per capita
- Cost of living: +1.4% more than national average
- Total home goods expenditure: $10.4 billion
- Total population: 5.9 million
- Other major spending categories: Recreation services, housing and utilities, food services and accommodations, recreational goods and vehicles, clothing and footwear
Contact [email protected] for any questions or corrections.