Key Points
- In certain situations, police officers are authorized to use deadly force, and since the beginning of 2020, more than 6,000 people in the U.S. have been killed by American law enforcement.
- Police use of deadly violence — necessary or otherwise — is far more common in some parts of the country than in others.
- Also: Discover the next Nvidia
Across the United States, fatal encounters with law enforcement vary dramatically from one community to another. These incidents are often based on several factors, like patterns tied to population density, crime rates, local policies, training standards, and historical tensions between police and residents. These tragic events are highly localized. Some counties see only rare police-caused deaths, while others experience them far more often (sometimes at rates that far exceed state or national averages). Looking at these numbers county by county reveals stark differences that can’t be seen from statewide summaries alone.
Identifying the county in each state where the most people are killed by police helps illustrate where these traumatic incidents cluster and provides a better look at the social, economic, and institutional factors that may contribute to them. These patterns don’t just tell us where the numbers are highest; they also uncover communities struggling with systemic challenges or major gaps in accountability. By examining these counties, we can better understand the complexities behind police use of force and why reforms are likely necessary.
Using data from Mapping Police Violence, a research collaborative that collects data on police killings, 24/7 Wall St. identified the county in each state with the most police killings. In each of the 50 states, we ranked counties and county equivalents on the total number of police killings between January 2020 through October 2024. In the case of a tie, the county with a smaller population, according to five-year estimates from the U.S. Census Bureau’s 2022 American Community Survey, is listed.
Among the counties on this list, the number of people killed by police in the last five years ranges from fewer than five to well over 150. These killings accounted for anywhere from about 7% of all killings statewide, to as many as as 80%.
Nationwide, about 20% of those killed by police since January 2020 displayed signs of mental illness, and nearly 17% of Americans killed at the hands of police were unarmed. From a demographic perspective, the vast majority of those killed by police — nearly 94% — were men. Additionally, about 41% of Americans killed by law enforcement were white, 24% were Black, 18% were Hispanic, and fewer than 2% were Asian or Native American. These demographic ratios can vary considerably at the state and local level, however.
It is important to note that, despite ranking on this list, in many of these counties, deadly police violence is relatively uncommon. Since January 1, 2020, there have been about 1.8 police killings per 100,000 people nationwide. In 11 of the 50 counties on this list, the number of police killings, adjusted for population, falls below this threshold. (Here is a look at the states with the most gun-related crime.)
This post was updated on December 9, 2025 to provide an overview of nationwide police-caused killings, as well as detail why it matters.
Why It Matters

Understanding where police killings are most concentrated helps reveal important patterns. This information cannot be gained through statewide or national statistics; in fact, it may be obscured by broader perspectives. Identifying high-impact counties can highlight ongoing issues, guide targeted reforms, and reveal corruption in the places that need it most. By focusing on localized data, people in positions of power like policymakers, as well as the wider public, can make more informed decisions. These knowledgeable decisions are more likely to reduce fatalities and strengthen trust between law enforcement and the communities they serve.
Alabama: Mobile County
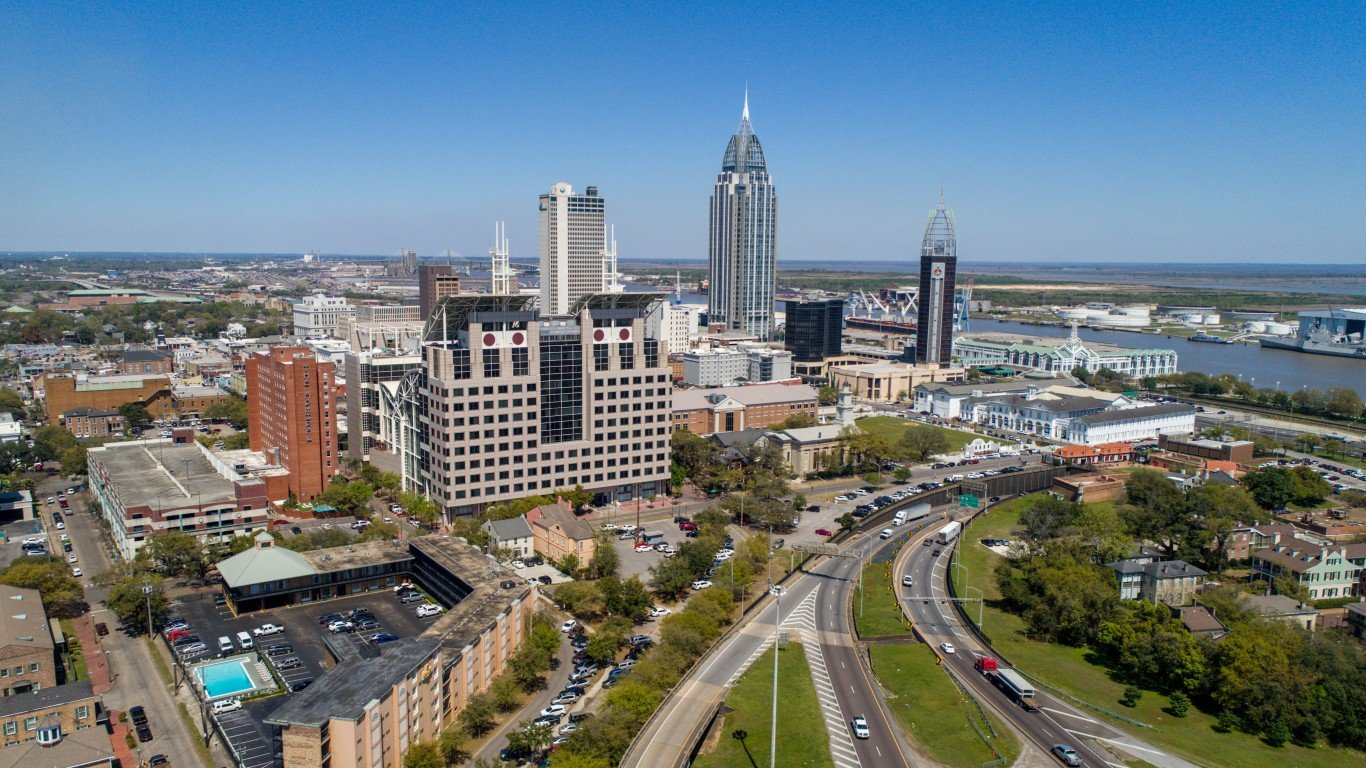
- Documented police killings, Jan. 2020 – Oct. 2024: 16 (3.9 per 100,000 people)
- Share of statewide police killings in county: 12.7%
- Gender of those killed: 87.5% male, 12.5% female
- Race/ethnicity of those killed: 43.8% White, 50.0% Black, 0.0% Hispanic, 0.0% Native American, 0.0% Asian
- Share of those killed with signs of a mental illness: 25.0%
- Share of those killed who were unarmed: 31.3%
- County population: 413,878
Alaska: Matanuska-Susitna Borough

- Documented police killings, Jan. 2020 – Oct. 2024: 7 (6.4 per 100,000 people)
- Share of statewide police killings in county: 20.0%
- Gender of those killed: 100.0% male, 0.0% female
- Race/ethnicity of those killed: 57.1% White, 0.0% Black, 0.0% Hispanic, 14.3% Native American, 0.0% Asian
- Share of those killed with signs of a mental illness: 14.3%
- Share of those killed who were unarmed: 28.6%
- Borough population: 108,661
Arizona: Maricopa County

- Documented police killings, Jan. 2020 – Oct. 2024: 141 (3.2 per 100,000 people)
- Share of statewide police killings in county: 57.1%
- Gender of those killed: 95.0% male, 5.0% female
- Race/ethnicity of those killed: 36.2% White, 17.0% Black, 35.5% Hispanic, 2.1% Native American, 0.0% Asian
- Share of those killed with signs of a mental illness: 18.4%
- Share of those killed who were unarmed: 18.4%
- County population: 4,430,871
Arkansas: Pulaski County

- Documented police killings, Jan. 2020 – Oct. 2024: 17 (4.3 per 100,000 people)
- Share of statewide police killings in county: 20.2%
- Gender of those killed: 100.0% male, 0.0% female
- Race/ethnicity of those killed: 35.3% White, 52.9% Black, 5.9% Hispanic, 0.0% Native American, 0.0% Asian
- Share of those killed with signs of a mental illness: 17.6%
- Share of those killed who were unarmed: 17.6%
- County population: 398,322
California: Los Angeles County

- Documented police killings, Jan. 2020 – Oct. 2024: 184 (1.9 per 100,000 people)
- Share of statewide police killings in county: 25.3%
- Gender of those killed: 92.9% male, 7.1% female
- Race/ethnicity of those killed: 14.7% White, 15.2% Black, 56.5% Hispanic, 0.0% Native American, 2.7% Asian
- Share of those killed with signs of a mental illness: 21.2%
- Share of those killed who were unarmed: 18.5%
- County population: 9,936,690
Colorado: El Paso County
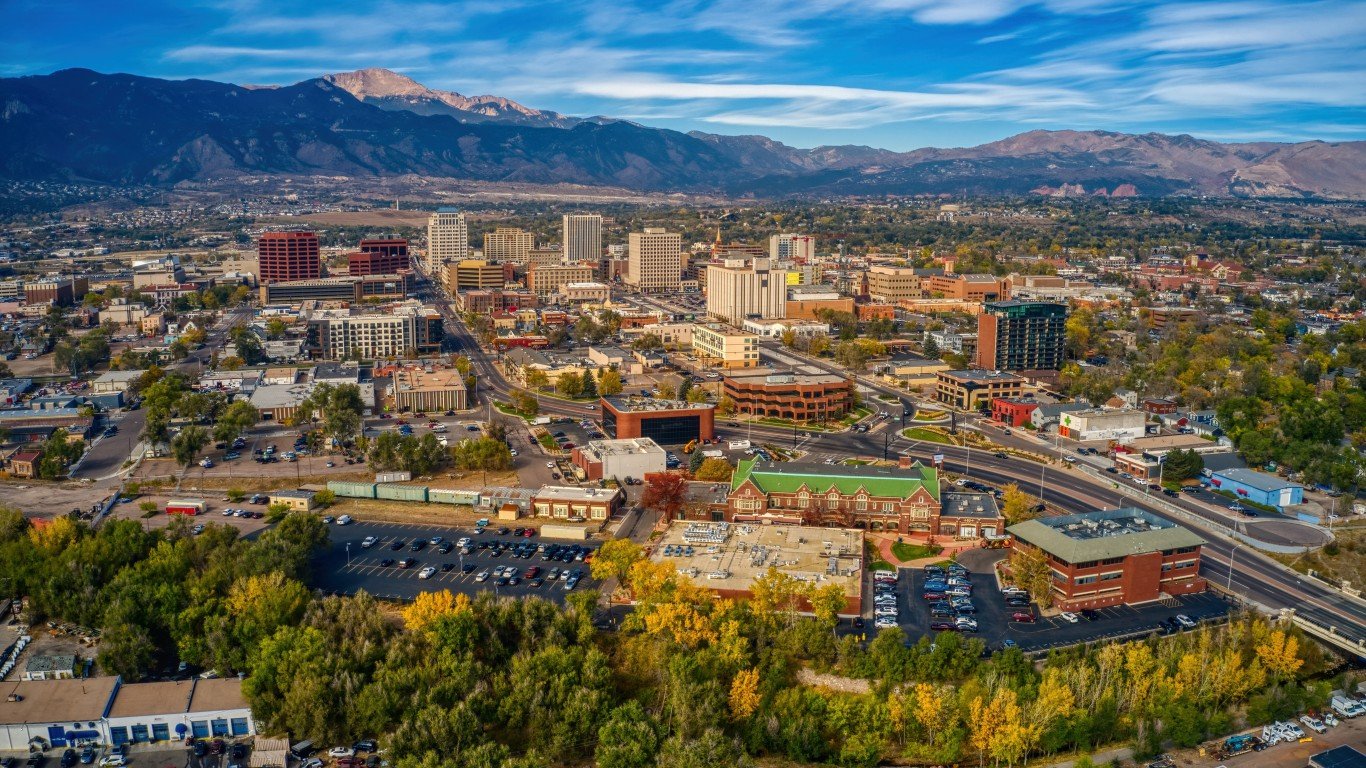
- Documented police killings, Jan. 2020 – Oct. 2024: 27 (3.7 per 100,000 people)
- Share of statewide police killings in county: 12.7%
- Gender of those killed: 100.0% male, 0.0% female
- Race/ethnicity of those killed: 48.1% White, 22.2% Black, 14.8% Hispanic, 0.0% Native American, 0.0% Asian
- Share of those killed with signs of a mental illness: 25.9%
- Share of those killed who were unarmed: 18.5%
- County population: 730,323
Connecticut: New Haven County

- Documented police killings, Jan. 2020 – Oct. 2024: 10 (1.2 per 100,000 people)
- Share of statewide police killings in county: 41.7%
- Gender of those killed: 100.0% male, 0.0% female
- Race/ethnicity of those killed: 50.0% White, 40.0% Black, 10.0% Hispanic, 0.0% Native American, 0.0% Asian
- Share of those killed with signs of a mental illness: 30.0%
- Share of those killed who were unarmed: 20.0%
- County population: 864,751
Delaware: New Castle County
- Documented police killings, Jan. 2020 – Oct. 2024: 5 (0.9 per 100,000 people)
- Share of statewide police killings in county: 38.5%
- Gender of those killed: 100.0% male, 0.0% female
- Race/ethnicity of those killed: 40.0% White, 40.0% Black, 20.0% Hispanic, 0.0% Native American, 0.0% Asian
- Share of those killed with signs of a mental illness: 0.0%
- Share of those killed who were unarmed: 0.0%
- County population: 570,567
Florida: Miami-Dade County
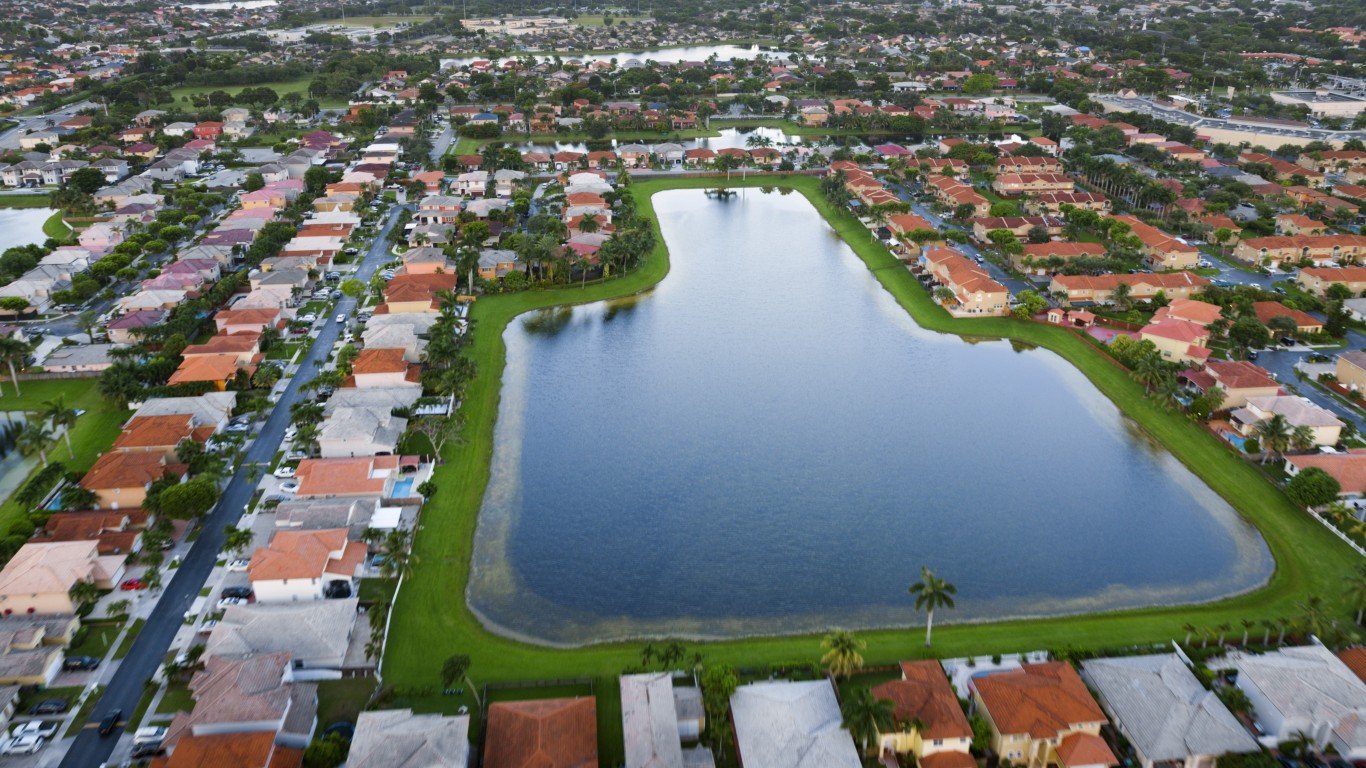
- Documented police killings, Jan. 2020 – Oct. 2024: 56 (2.1 per 100,000 people)
- Share of statewide police killings in county: 13.9%
- Gender of those killed: 94.6% male, 5.4% female
- Race/ethnicity of those killed: 12.5% White, 26.8% Black, 41.1% Hispanic, 0.0% Native American, 0.0% Asian
- Share of those killed with signs of a mental illness: 21.4%
- Share of those killed who were unarmed: 14.3%
- County population: 2,688,237
Georgia: Fulton County

- Documented police killings, Jan. 2020 – Oct. 2024: 32 (3.0 per 100,000 people)
- Share of statewide police killings in county: 11.7%
- Gender of those killed: 96.9% male, 3.1% female
- Race/ethnicity of those killed: 3.1% White, 84.4% Black, 3.1% Hispanic, 0.0% Native American, 0.0% Asian
- Share of those killed with signs of a mental illness: 6.3%
- Share of those killed who were unarmed: 25.0%
- County population: 1,061,944
Hawaii: Honolulu County

- Documented police killings, Jan. 2020 – Oct. 2024: 15 (1.5 per 100,000 people)
- Share of statewide police killings in county: 65.2%
- Gender of those killed: 100.0% male, 0.0% female
- Race/ethnicity of those killed: 13.3% White, 13.3% Black, 0.0% Hispanic, 0.0% Native American, 6.7% Asian
- Share of those killed with signs of a mental illness: 26.7%
- Share of those killed who were unarmed: 33.3%
- County population: 1,010,100
Idaho: Ada County

- Documented police killings, Jan. 2020 – Oct. 2024: 16 (3.2 per 100,000 people)
- Share of statewide police killings in county: 29.1%
- Gender of those killed: 100.0% male, 0.0% female
- Race/ethnicity of those killed: 68.8% White, 0.0% Black, 6.3% Hispanic, 0.0% Native American, 0.0% Asian
- Share of those killed with signs of a mental illness: 31.3%
- Share of those killed who were unarmed: 6.3%
- County population: 497,494
Illinois: Cook County
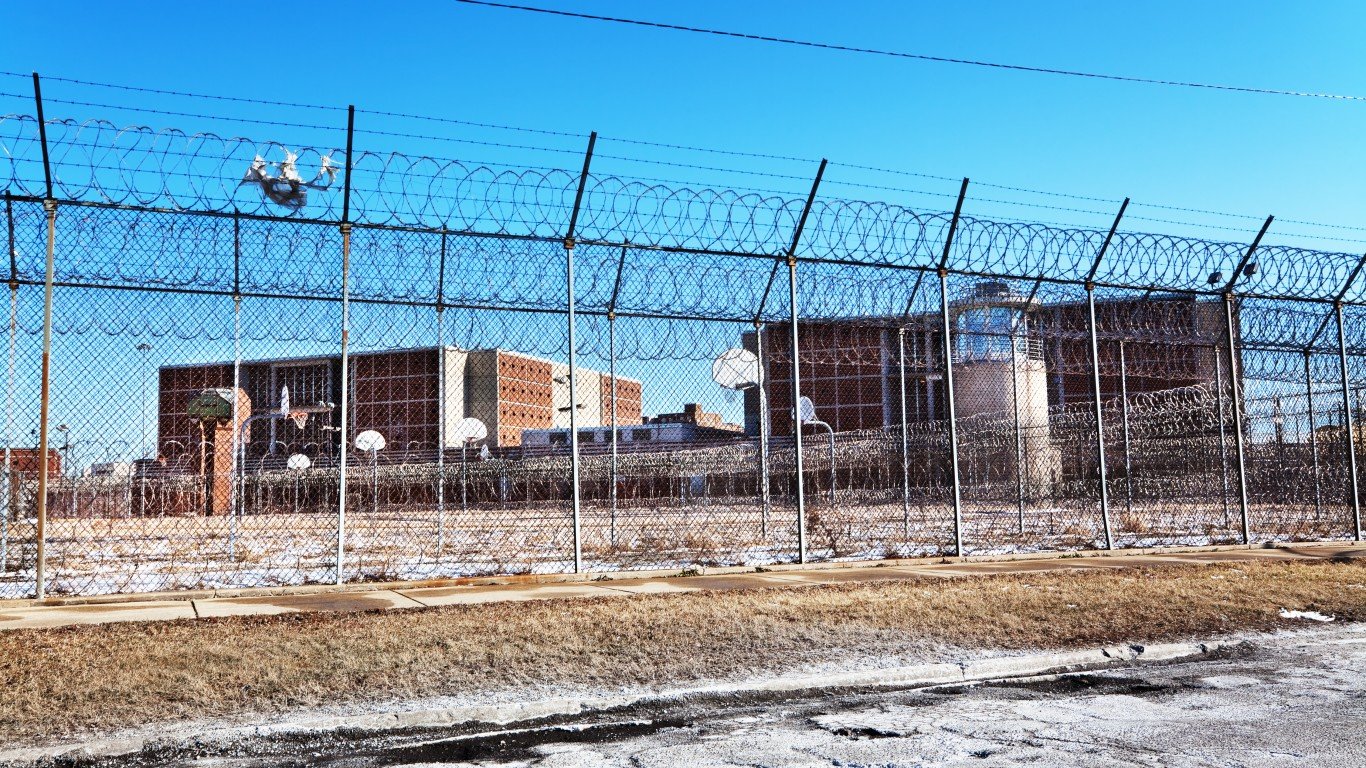
- Documented police killings, Jan. 2020 – Oct. 2024: 44 (0.8 per 100,000 people)
- Share of statewide police killings in county: 32.1%
- Gender of those killed: 84.1% male, 15.9% female
- Race/ethnicity of those killed: 4.5% White, 59.1% Black, 25.0% Hispanic, 0.0% Native American, 0.0% Asian
- Share of those killed with signs of a mental illness: 9.1%
- Share of those killed who were unarmed: 18.2%
- County population: 5,225,367
Indiana: Marion County

- Documented police killings, Jan. 2020 – Oct. 2024: 32 (3.3 per 100,000 people)
- Share of statewide police killings in county: 24.2%
- Gender of those killed: 96.9% male, 3.1% female
- Race/ethnicity of those killed: 12.5% White, 75.0% Black, 3.1% Hispanic, 0.0% Native American, 0.0% Asian
- Share of those killed with signs of a mental illness: 28.1%
- Share of those killed who were unarmed: 12.5%
- County population: 971,737
Iowa: Scott County
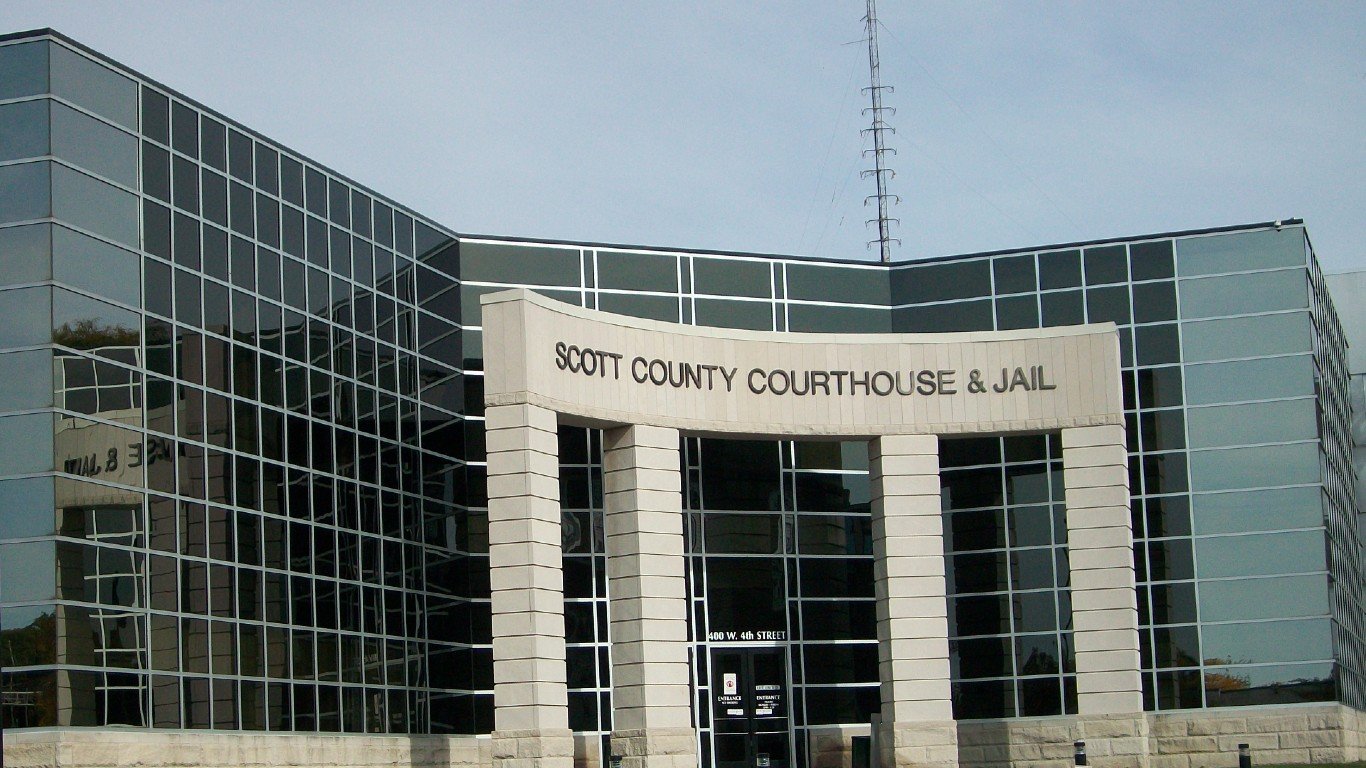
- Documented police killings, Jan. 2020 – Oct. 2024: 5 (2.9 per 100,000 people)
- Share of statewide police killings in county: 14.3%
- Gender of those killed: 100.0% male, 0.0% female
- Race/ethnicity of those killed: 80.0% White, 20.0% Black, 0.0% Hispanic, 0.0% Native American, 0.0% Asian
- Share of those killed with signs of a mental illness: 40.0%
- Share of those killed who were unarmed: 20.0%
- County population: 174,315
Kansas: Sedgwick County
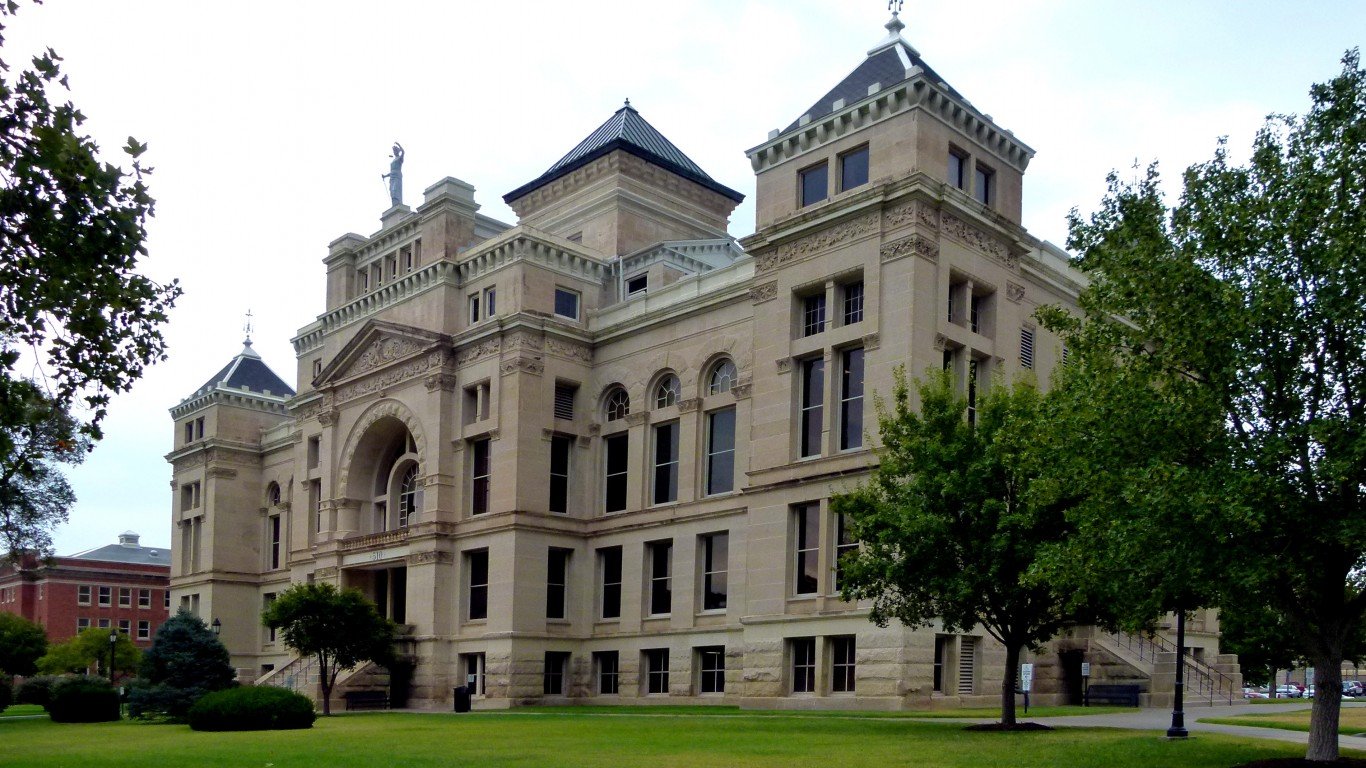
- Documented police killings, Jan. 2020 – Oct. 2024: 14 (2.7 per 100,000 people)
- Share of statewide police killings in county: 23.3%
- Gender of those killed: 100.0% male, 0.0% female
- Race/ethnicity of those killed: 57.1% White, 7.1% Black, 28.6% Hispanic, 0.0% Native American, 0.0% Asian
- Share of those killed with signs of a mental illness: 42.9%
- Share of those killed who were unarmed: 28.6%
- County population: 522,700
Kentucky: Jefferson County

- Documented police killings, Jan. 2020 – Oct. 2024: 18 (2.3 per 100,000 people)
- Share of statewide police killings in county: 18.6%
- Gender of those killed: 88.9% male, 11.1% female
- Race/ethnicity of those killed: 55.6% White, 22.2% Black, 16.7% Hispanic, 0.0% Native American, 5.6% Asian
- Share of those killed with signs of a mental illness: 22.2%
- Share of those killed who were unarmed: 22.2%
- County population: 779,232
Louisiana: Jefferson Parish
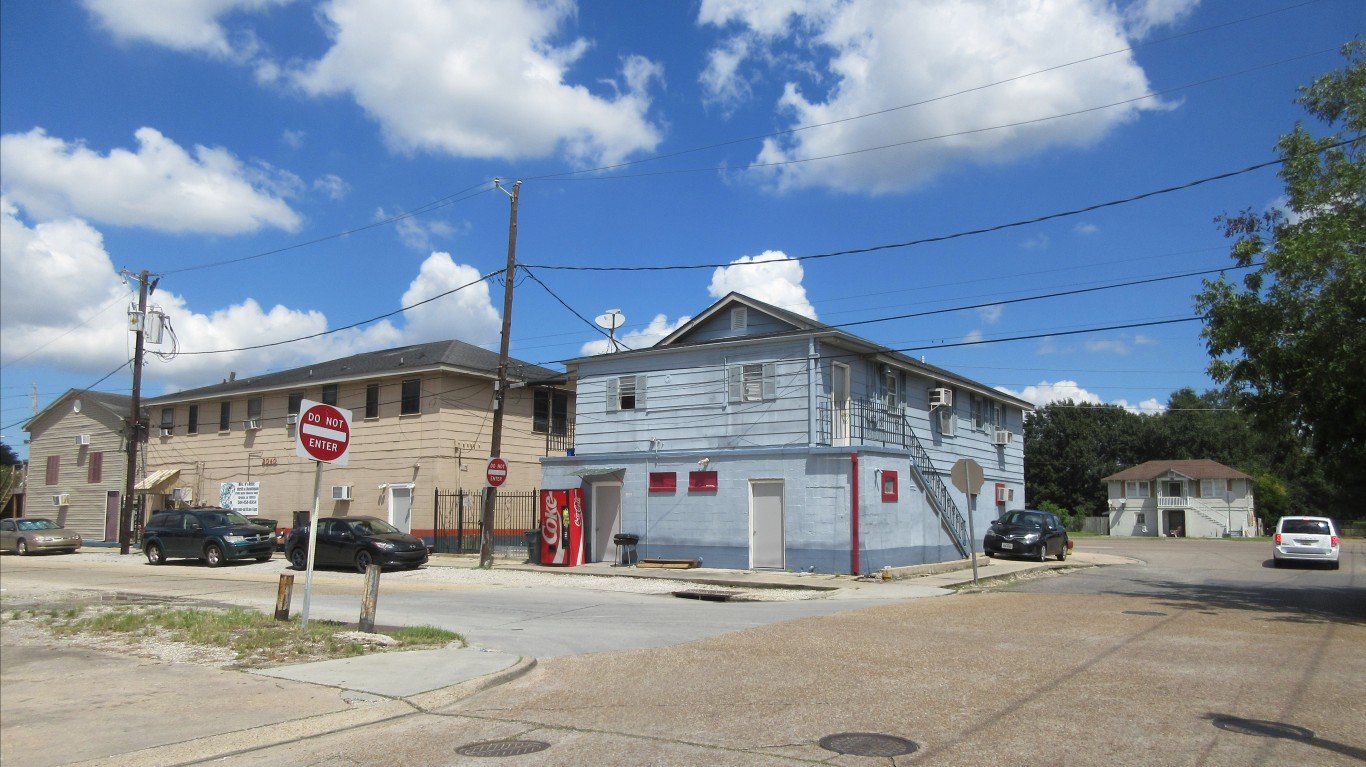
- Documented police killings, Jan. 2020 – Oct. 2024: 11 (2.5 per 100,000 people)
- Share of statewide police killings in parish: 9.6%
- Gender of those killed: 90.9% male, 9.1% female
- Race/ethnicity of those killed: 36.4% White, 45.5% Black, 9.1% Hispanic, 0.0% Native American, 0.0% Asian
- Share of those killed with signs of a mental illness: 18.2%
- Share of those killed who were unarmed: 9.1%
- Parish population: 436,171
Maine: Oxford County

- Documented police killings, Jan. 2020 – Oct. 2024: 5 (8.6 per 100,000 people)
- Share of statewide police killings in county: 15.2%
- Gender of those killed: 100.0% male, 0.0% female
- Race/ethnicity of those killed: 80.0% White, 0.0% Black, 0.0% Hispanic, 0.0% Native American, 0.0% Asian
- Share of those killed with signs of a mental illness: 40.0%
- Share of those killed who were unarmed: 20.0%
- County population: 58,276
Maryland: Baltimore County

- Documented police killings, Jan. 2020 – Oct. 2024: 19 (2.2 per 100,000 people)
- Share of statewide police killings in county: 25.7%
- Gender of those killed: 100.0% male, 0.0% female
- Race/ethnicity of those killed: 10.5% White, 84.2% Black, 0.0% Hispanic, 0.0% Native American, 0.0% Asian
- Share of those killed with signs of a mental illness: 26.3%
- Share of those killed who were unarmed: 21.1%
- County population: 850,737
Massachusetts: Bristol County

- Documented police killings, Jan. 2020 – Oct. 2024: 5 (0.9 per 100,000 people)
- Share of statewide police killings in county: 15.2%
- Gender of those killed: 80.0% male, 20.0% female
- Race/ethnicity of those killed: 80.0% White, 20.0% Black, 0.0% Hispanic, 0.0% Native American, 0.0% Asian
- Share of those killed with signs of a mental illness: 20.0%
- Share of those killed who were unarmed: 20.0%
- County population: 576,699
Michigan: Wayne County

- Documented police killings, Jan. 2020 – Oct. 2024: 38 (2.1 per 100,000 people)
- Share of statewide police killings in county: 30.9%
- Gender of those killed: 92.1% male, 7.9% female
- Race/ethnicity of those killed: 23.7% White, 52.6% Black, 0.0% Hispanic, 0.0% Native American, 0.0% Asian
- Share of those killed with signs of a mental illness: 26.3%
- Share of those killed who were unarmed: 13.2%
- County population: 1,781,641
Minnesota: Hennepin County

- Documented police killings, Jan. 2020 – Oct. 2024: 13 (1.0 per 100,000 people)
- Share of statewide police killings in county: 24.5%
- Gender of those killed: 100.0% male, 0.0% female
- Race/ethnicity of those killed: 23.1% White, 69.2% Black, 0.0% Hispanic, 0.0% Native American, 7.7% Asian
- Share of those killed with signs of a mental illness: 15.4%
- Share of those killed who were unarmed: 23.1%
- County population: 1,270,787
Mississippi: Harrison County
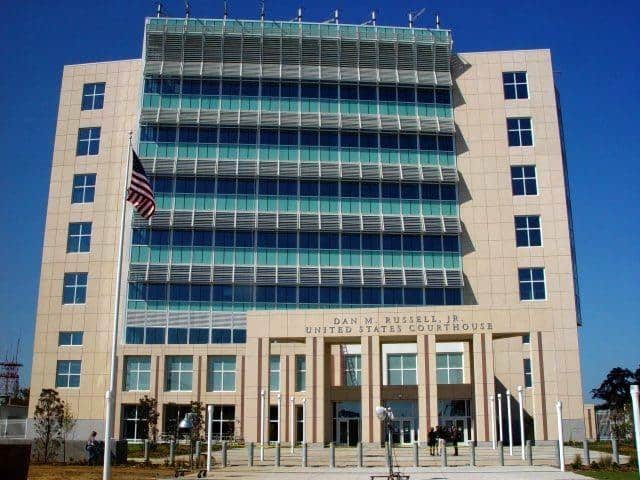
- Documented police killings, Jan. 2020 – Oct. 2024: 16 (7.7 per 100,000 people)
- Share of statewide police killings in county: 18.0%
- Gender of those killed: 93.8% male, 6.3% female
- Race/ethnicity of those killed: 12.5% White, 62.5% Black, 0.0% Hispanic, 0.0% Native American, 0.0% Asian
- Share of those killed with signs of a mental illness: 6.3%
- Share of those killed who were unarmed: 12.5%
- County population: 208,748
Missouri: Jackson County

- Documented police killings, Jan. 2020 – Oct. 2024: 29 (4.1 per 100,000 people)
- Share of statewide police killings in county: 18.5%
- Gender of those killed: 96.6% male, 3.4% female
- Race/ethnicity of those killed: 31.0% White, 51.7% Black, 0.0% Hispanic, 0.0% Native American, 0.0% Asian
- Share of those killed with signs of a mental illness: 13.8%
- Share of those killed who were unarmed: 10.3%
- County population: 715,526
Montana: Yellowstone County
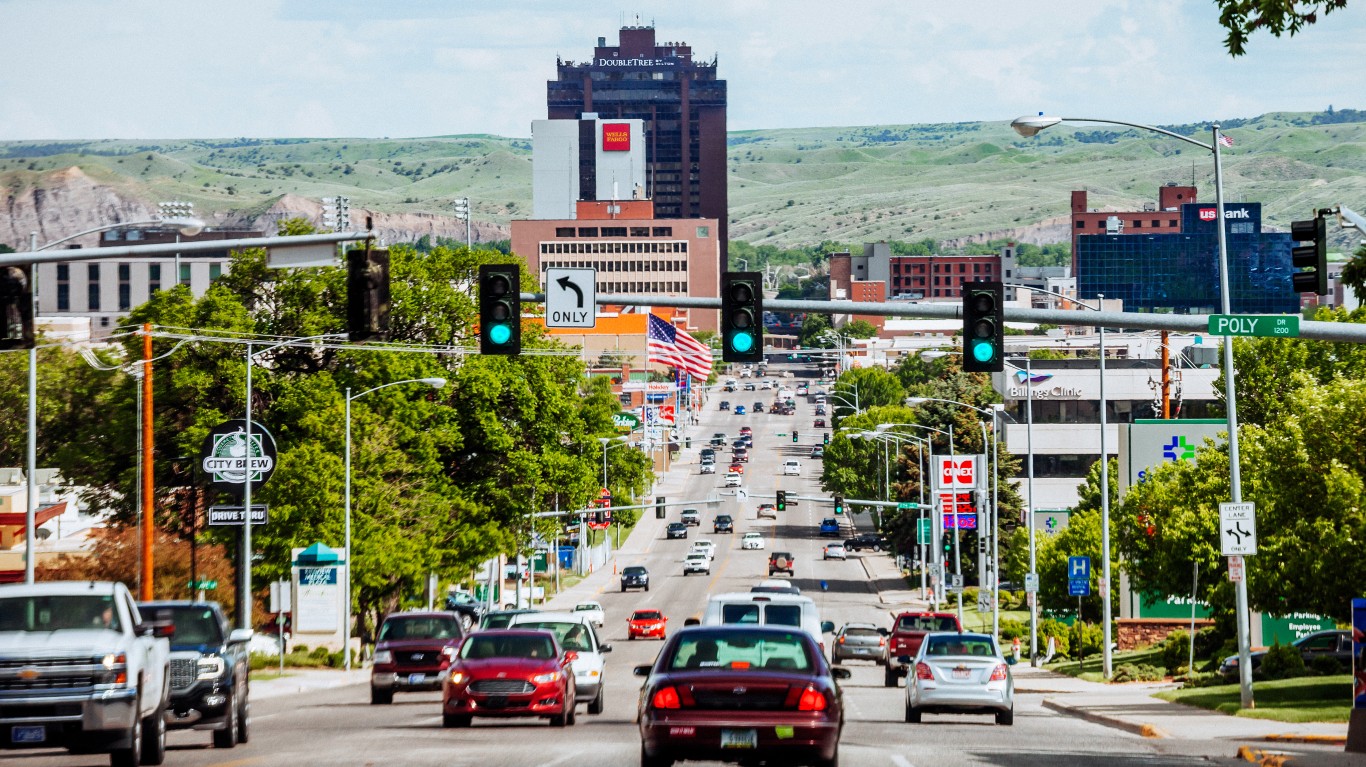
- Documented police killings, Jan. 2020 – Oct. 2024: 10 (6.0 per 100,000 people)
- Share of statewide police killings in county: 22.7%
- Gender of those killed: 90.0% male, 10.0% female
- Race/ethnicity of those killed: 40.0% White, 10.0% Black, 0.0% Hispanic, 40.0% Native American, 0.0% Asian
- Share of those killed with signs of a mental illness: 20.0%
- Share of those killed who were unarmed: 0.0%
- County population: 165,524
Nebraska: Douglas County

- Documented police killings, Jan. 2020 – Oct. 2024: 12 (2.1 per 100,000 people)
- Share of statewide police killings in county: 37.5%
- Gender of those killed: 100.0% male, 0.0% female
- Race/ethnicity of those killed: 33.3% White, 33.3% Black, 25.0% Hispanic, 0.0% Native American, 8.3% Asian
- Share of those killed with signs of a mental illness: 33.3%
- Share of those killed who were unarmed: 16.7%
- County population: 582,638
Nevada: Clark County
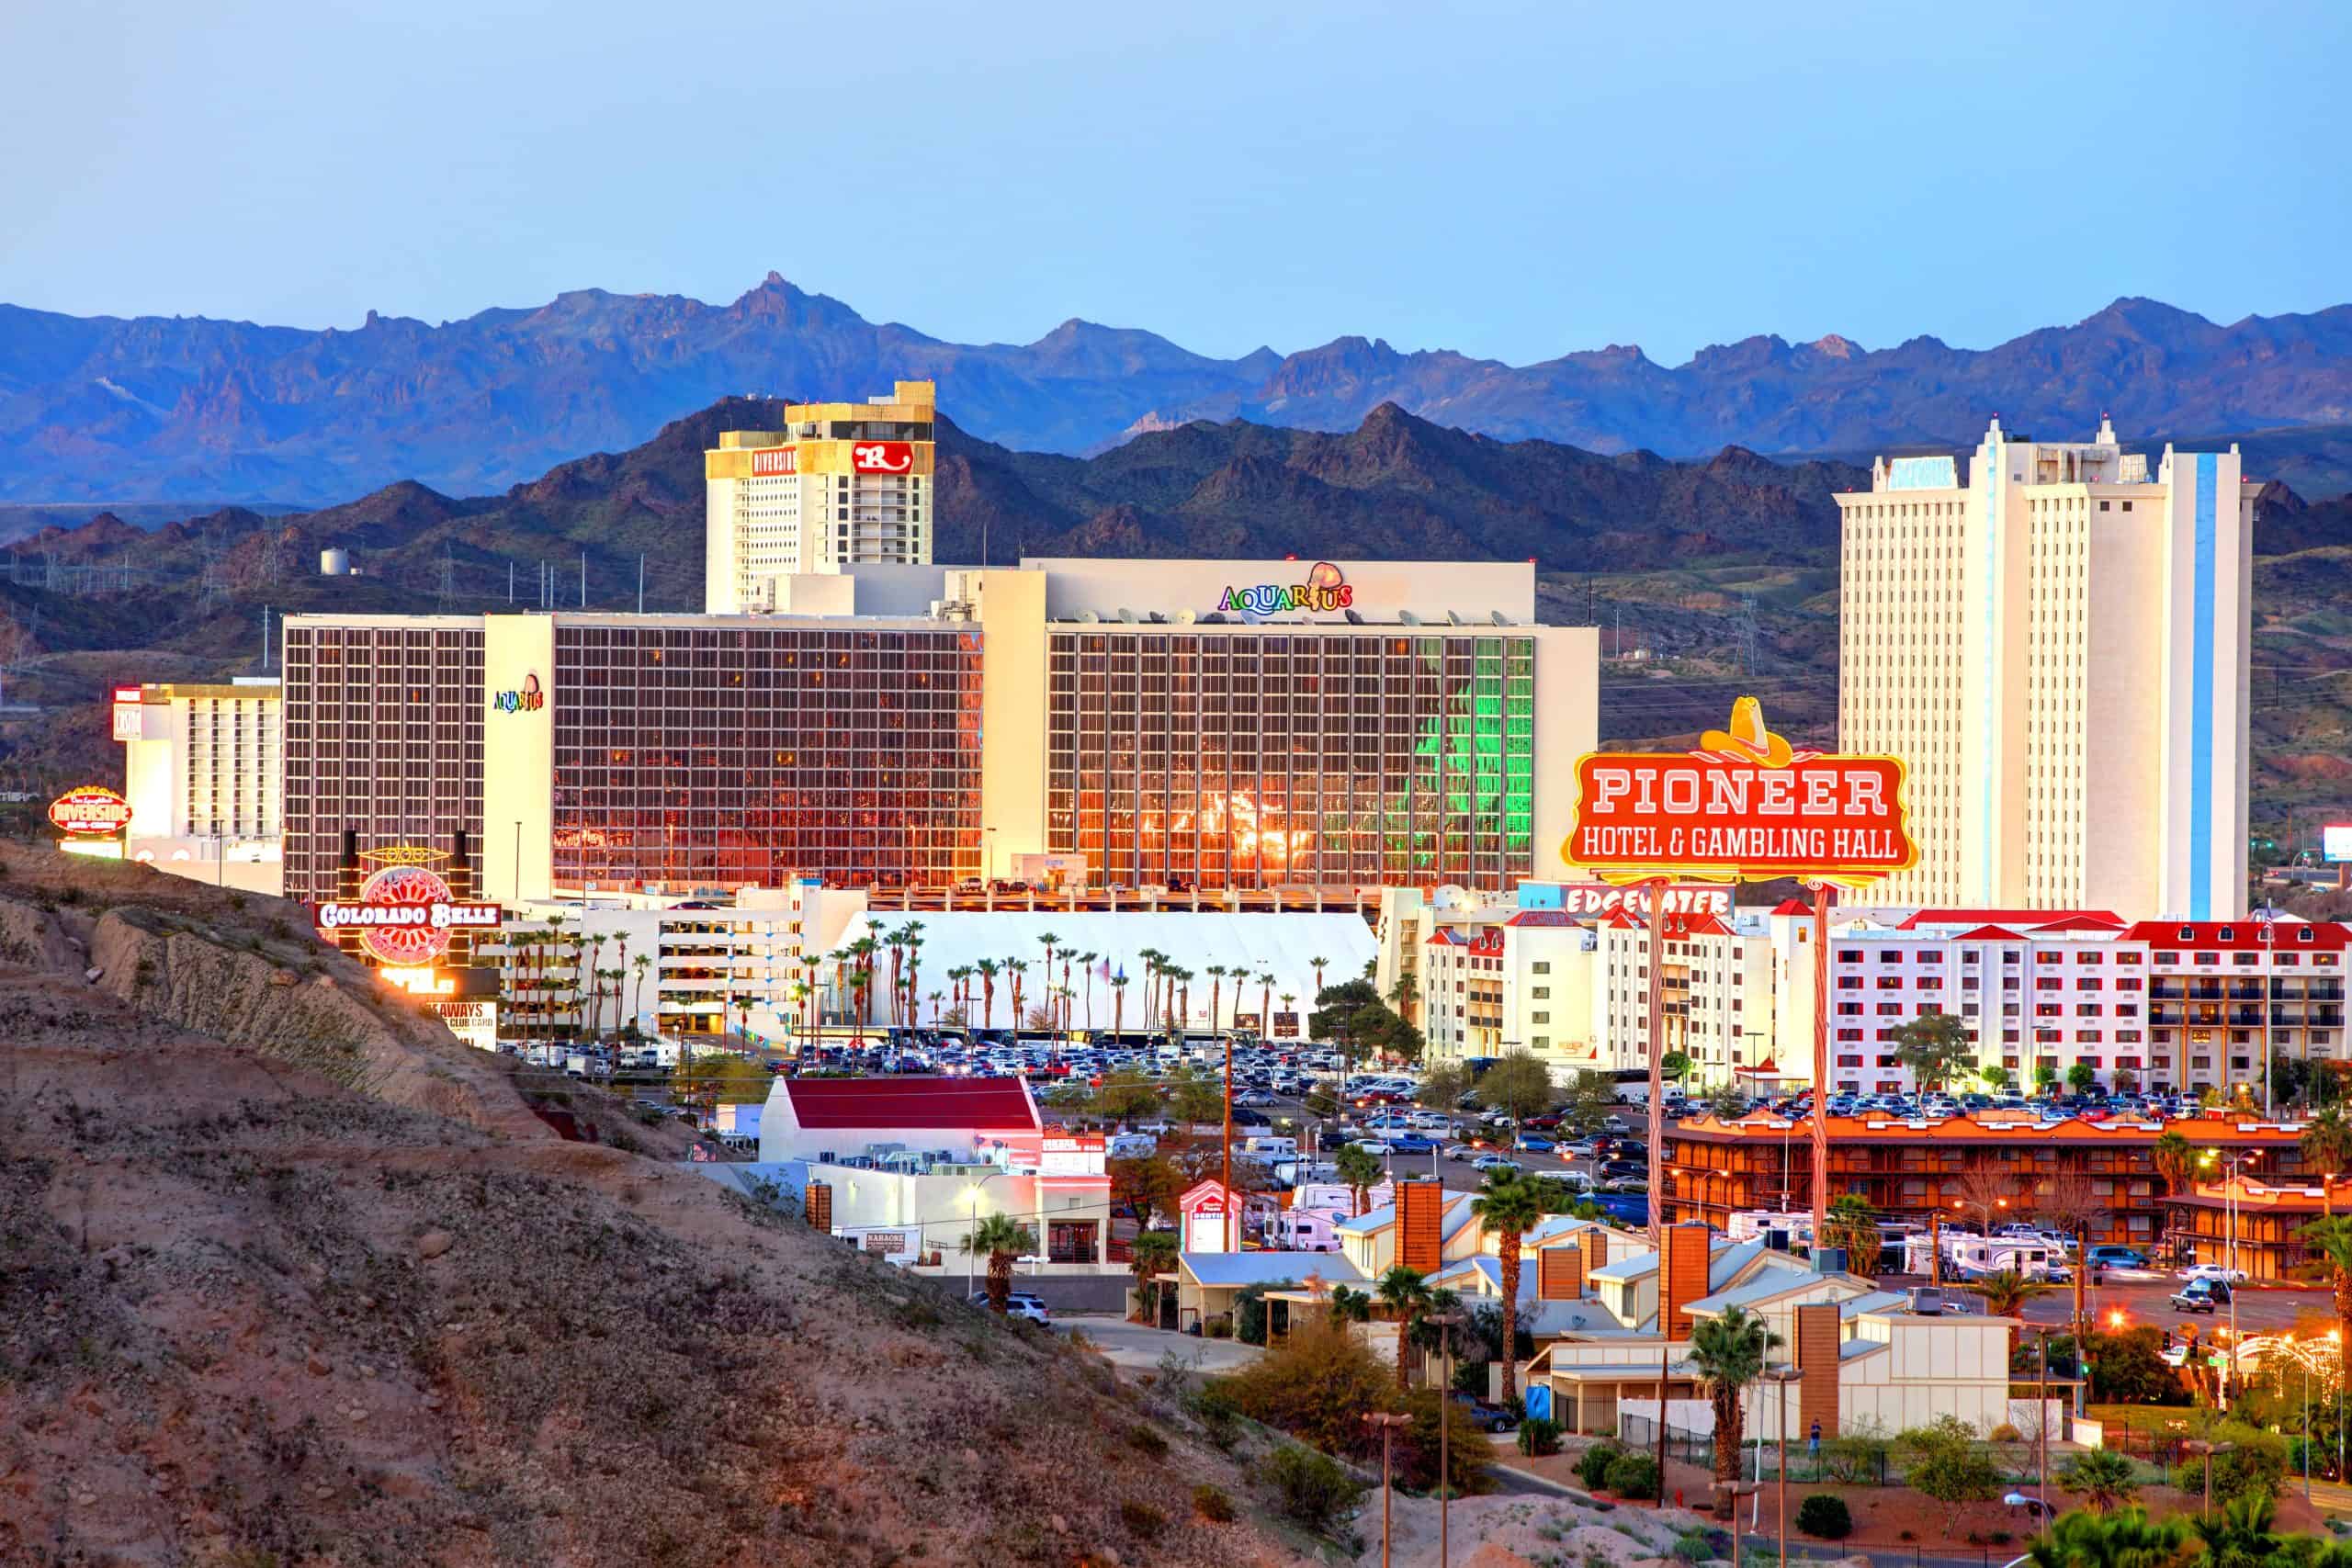
- Documented police killings, Jan. 2020 – Oct. 2024: 68 (3.0 per 100,000 people)
- Share of statewide police killings in county: 71.6%
- Gender of those killed: 95.6% male, 4.4% female
- Race/ethnicity of those killed: 47.1% White, 19.1% Black, 25.0% Hispanic, 0.0% Native American, 0.0% Asian
- Share of those killed with signs of a mental illness: 27.9%
- Share of those killed who were unarmed: 10.3%
- County population: 2,265,926
New Hampshire: Hillsborough County

- Documented police killings, Jan. 2020 – Oct. 2024: 7 (1.7 per 100,000 people)
- Share of statewide police killings in county: 35.0%
- Gender of those killed: 100.0% male, 0.0% female
- Race/ethnicity of those killed: 71.4% White, 0.0% Black, 0.0% Hispanic, 0.0% Native American, 0.0% Asian
- Share of those killed with signs of a mental illness: 14.3%
- Share of those killed who were unarmed: 0.0%
- County population: 422,733
New Jersey: Passaic County

- Documented police killings, Jan. 2020 – Oct. 2024: 10 (1.9 per 100,000 people)
- Share of statewide police killings in county: 14.9%
- Gender of those killed: 90.0% male, 10.0% female
- Race/ethnicity of those killed: 10.0% White, 40.0% Black, 0.0% Hispanic, 0.0% Native American, 20.0% Asian
- Share of those killed with signs of a mental illness: 20.0%
- Share of those killed who were unarmed: 30.0%
- County population: 519,986
New Mexico: Bernalillo County

- Documented police killings, Jan. 2020 – Oct. 2024: 48 (7.1 per 100,000 people)
- Share of statewide police killings in county: 36.1%
- Gender of those killed: 95.8% male, 4.2% female
- Race/ethnicity of those killed: 27.1% White, 10.4% Black, 45.8% Hispanic, 8.3% Native American, 0.0% Asian
- Share of those killed with signs of a mental illness: 33.3%
- Share of those killed who were unarmed: 20.8%
- County population: 674,692
New York: Queens County

- Documented police killings, Jan. 2020 – Oct. 2024: 18 (0.8 per 100,000 people)
- Share of statewide police killings in county: 12.2%
- Gender of those killed: 94.4% male, 5.6% female
- Race/ethnicity of those killed: 11.1% White, 38.9% Black, 16.7% Hispanic, 0.0% Native American, 11.1% Asian
- Share of those killed with signs of a mental illness: 22.2%
- Share of those killed who were unarmed: 27.8%
- County population: 2,360,826
North Carolina: Guilford County

- Documented police killings, Jan. 2020 – Oct. 2024: 15 (2.8 per 100,000 people)
- Share of statewide police killings in county: 7.7%
- Gender of those killed: 100.0% male, 0.0% female
- Race/ethnicity of those killed: 26.7% White, 46.7% Black, 13.3% Hispanic, 0.0% Native American, 0.0% Asian
- Share of those killed with signs of a mental illness: 13.3%
- Share of those killed who were unarmed: 40.0%
- County population: 539,557
North Dakota: Stark County

- Documented police killings, Jan. 2020 – Oct. 2024: 3 (9.1 per 100,000 people)
- Share of statewide police killings in county: 18.8%
- Gender of those killed: 100.0% male, 0.0% female
- Race/ethnicity of those killed: 0.0% White, 0.0% Black, 0.0% Hispanic, 33.3% Native American, 0.0% Asian
- Share of those killed with signs of a mental illness: 0.0%
- Share of those killed who were unarmed: 0.0%
- County population: 32,989
Ohio: Franklin County

- Documented police killings, Jan. 2020 – Oct. 2024: 30 (2.3 per 100,000 people)
- Share of statewide police killings in county: 17.9%
- Gender of those killed: 86.7% male, 13.3% female
- Race/ethnicity of those killed: 16.7% White, 70.0% Black, 10.0% Hispanic, 0.0% Native American, 0.0% Asian
- Share of those killed with signs of a mental illness: 23.3%
- Share of those killed who were unarmed: 16.7%
- County population: 1,318,149
Oklahoma: Tulsa County

- Documented police killings, Jan. 2020 – Oct. 2024: 25 (3.7 per 100,000 people)
- Share of statewide police killings in county: 19.5%
- Gender of those killed: 96.0% male, 4.0% female
- Race/ethnicity of those killed: 48.0% White, 12.0% Black, 24.0% Hispanic, 12.0% Native American, 0.0% Asian
- Share of those killed with signs of a mental illness: 28.0%
- Share of those killed who were unarmed: 8.0%
- County population: 668,923
Oregon: Multnomah County

- Documented police killings, Jan. 2020 – Oct. 2024: 18 (2.2 per 100,000 people)
- Share of statewide police killings in county: 19.8%
- Gender of those killed: 100.0% male, 0.0% female
- Race/ethnicity of those killed: 61.1% White, 16.7% Black, 11.1% Hispanic, 0.0% Native American, 0.0% Asian
- Share of those killed with signs of a mental illness: 22.2%
- Share of those killed who were unarmed: 11.1%
- County population: 808,098
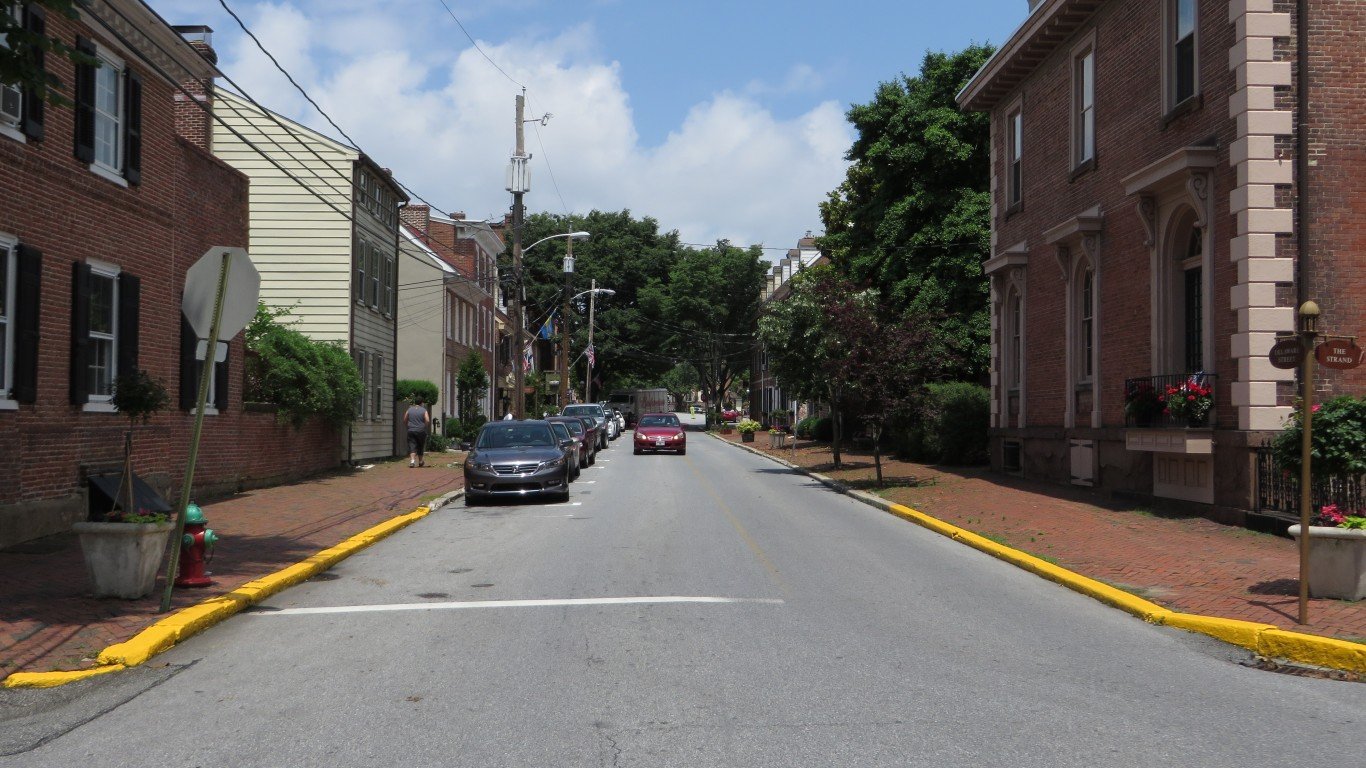
Pennsylvania: Philadelphia County

- Documented police killings, Jan. 2020 – Oct. 2024: 29 (1.8 per 100,000 people)
- Share of statewide police killings in county: 21.3%
- Gender of those killed: 96.6% male, 0.0% female
- Race/ethnicity of those killed: 20.7% White, 51.7% Black, 10.3% Hispanic, 0.0% Native American, 3.4% Asian
- Share of those killed with signs of a mental illness: 10.3%
- Share of those killed who were unarmed: 13.8%
- County population: 1,593,208
Rhode Island: Providence County

- Documented police killings, Jan. 2020 – Oct. 2024: 4 (0.6 per 100,000 people)
- Share of statewide police killings in county: 80.0%
- Gender of those killed: 100.0% male, 0.0% female
- Race/ethnicity of those killed: 100.0% White, 0.0% Black, 0.0% Hispanic, 0.0% Native American, 0.0% Asian
- Share of those killed with signs of a mental illness: 0.0%
- Share of those killed who were unarmed: 25.0%
- County population: 657,984
South Carolina: Charleston County

- Documented police killings, Jan. 2020 – Oct. 2024: 17 (4.1 per 100,000 people)
- Share of statewide police killings in county: 16.2%
- Gender of those killed: 64.7% male, 35.3% female
- Race/ethnicity of those killed: 35.3% White, 52.9% Black, 0.0% Hispanic, 0.0% Native American, 0.0% Asian
- Share of those killed with signs of a mental illness: 5.9%
- Share of those killed who were unarmed: 52.9%
- County population: 409,840
South Dakota: Pennington County

- Documented police killings, Jan. 2020 – Oct. 2024: 8 (7.2 per 100,000 people)
- Share of statewide police killings in county: 47.1%
- Gender of those killed: 100.0% male, 0.0% female
- Race/ethnicity of those killed: 37.5% White, 0.0% Black, 0.0% Hispanic, 50.0% Native American, 0.0% Asian
- Share of those killed with signs of a mental illness: 12.5%
- Share of those killed who were unarmed: 12.5%
- County population: 110,386
Tennessee: Shelby County

- Documented police killings, Jan. 2020 – Oct. 2024: 27 (2.9 per 100,000 people)
- Share of statewide police killings in county: 15.0%
- Gender of those killed: 85.2% male, 14.8% female
- Race/ethnicity of those killed: 7.4% White, 81.5% Black, 0.0% Hispanic, 0.0% Native American, 0.0% Asian
- Share of those killed with signs of a mental illness: 11.1%
- Share of those killed who were unarmed: 33.3%
- County population: 926,440
Texas: Harris County

- Documented police killings, Jan. 2020 – Oct. 2024: 112 (2.4 per 100,000 people)
- Share of statewide police killings in county: 18.0%
- Gender of those killed: 96.4% male, 3.6% female
- Race/ethnicity of those killed: 8.9% White, 44.6% Black, 30.4% Hispanic, 0.0% Native American, 1.8% Asian
- Share of those killed with signs of a mental illness: 17.0%
- Share of those killed who were unarmed: 17.9%
- County population: 4,726,177
Utah: Salt Lake County

- Documented police killings, Jan. 2020 – Oct. 2024: 43 (3.6 per 100,000 people)
- Share of statewide police killings in county: 52.4%
- Gender of those killed: 97.7% male, 2.3% female
- Race/ethnicity of those killed: 62.8% White, 7.0% Black, 14.0% Hispanic, 0.0% Native American, 0.0% Asian
- Share of those killed with signs of a mental illness: 25.6%
- Share of those killed who were unarmed: 9.3%
- County population: 1,180,643
Vermont: Windsor County
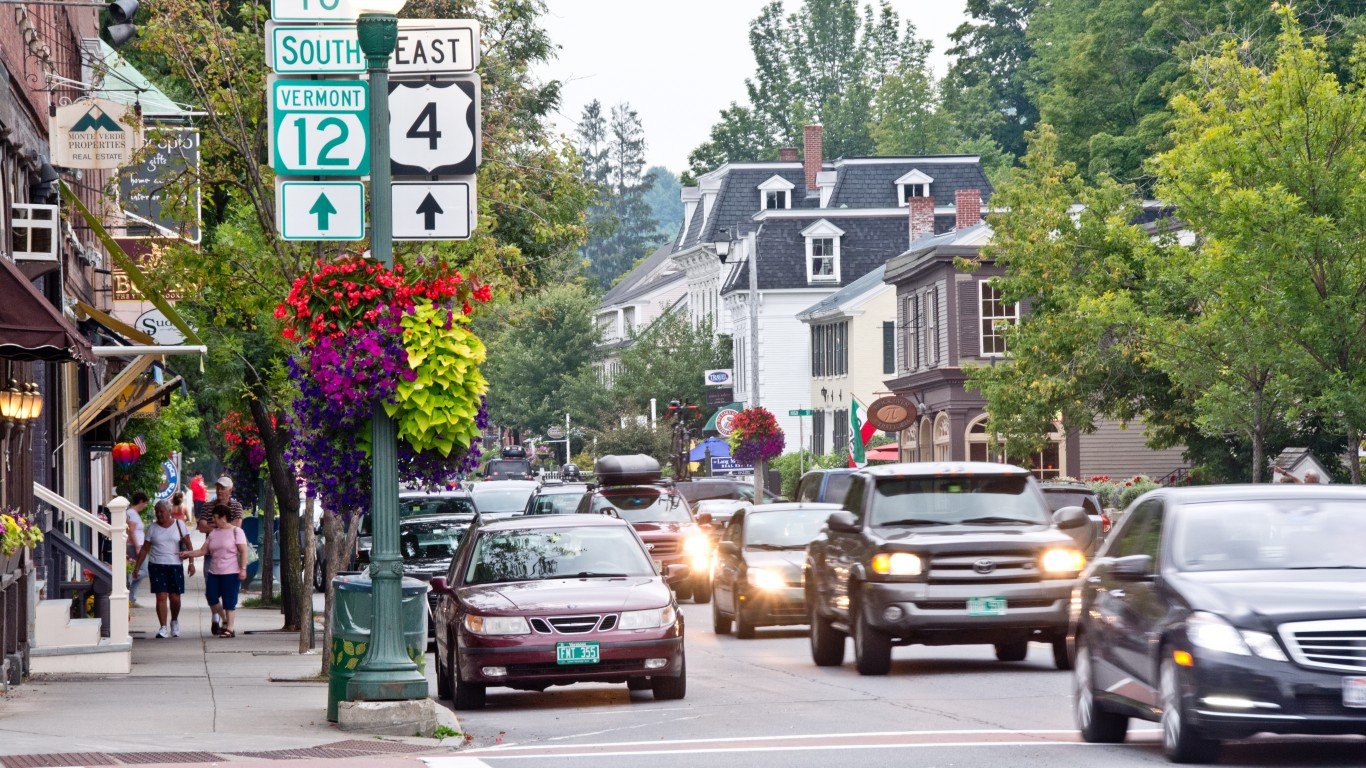
- Documented police killings, Jan. 2020 – Oct. 2024: 2 (3.5 per 100,000 people)
- Share of statewide police killings in county: 28.6%
- Gender of those killed: 100.0% male, 0.0% female
- Race/ethnicity of those killed: 100.0% White, 0.0% Black, 0.0% Hispanic, 0.0% Native American, 0.0% Asian
- Share of those killed with signs of a mental illness: 50.0%
- Share of those killed who were unarmed: 50.0%
- County population: 57,832
Virginia: Virginia Beach (independent city)
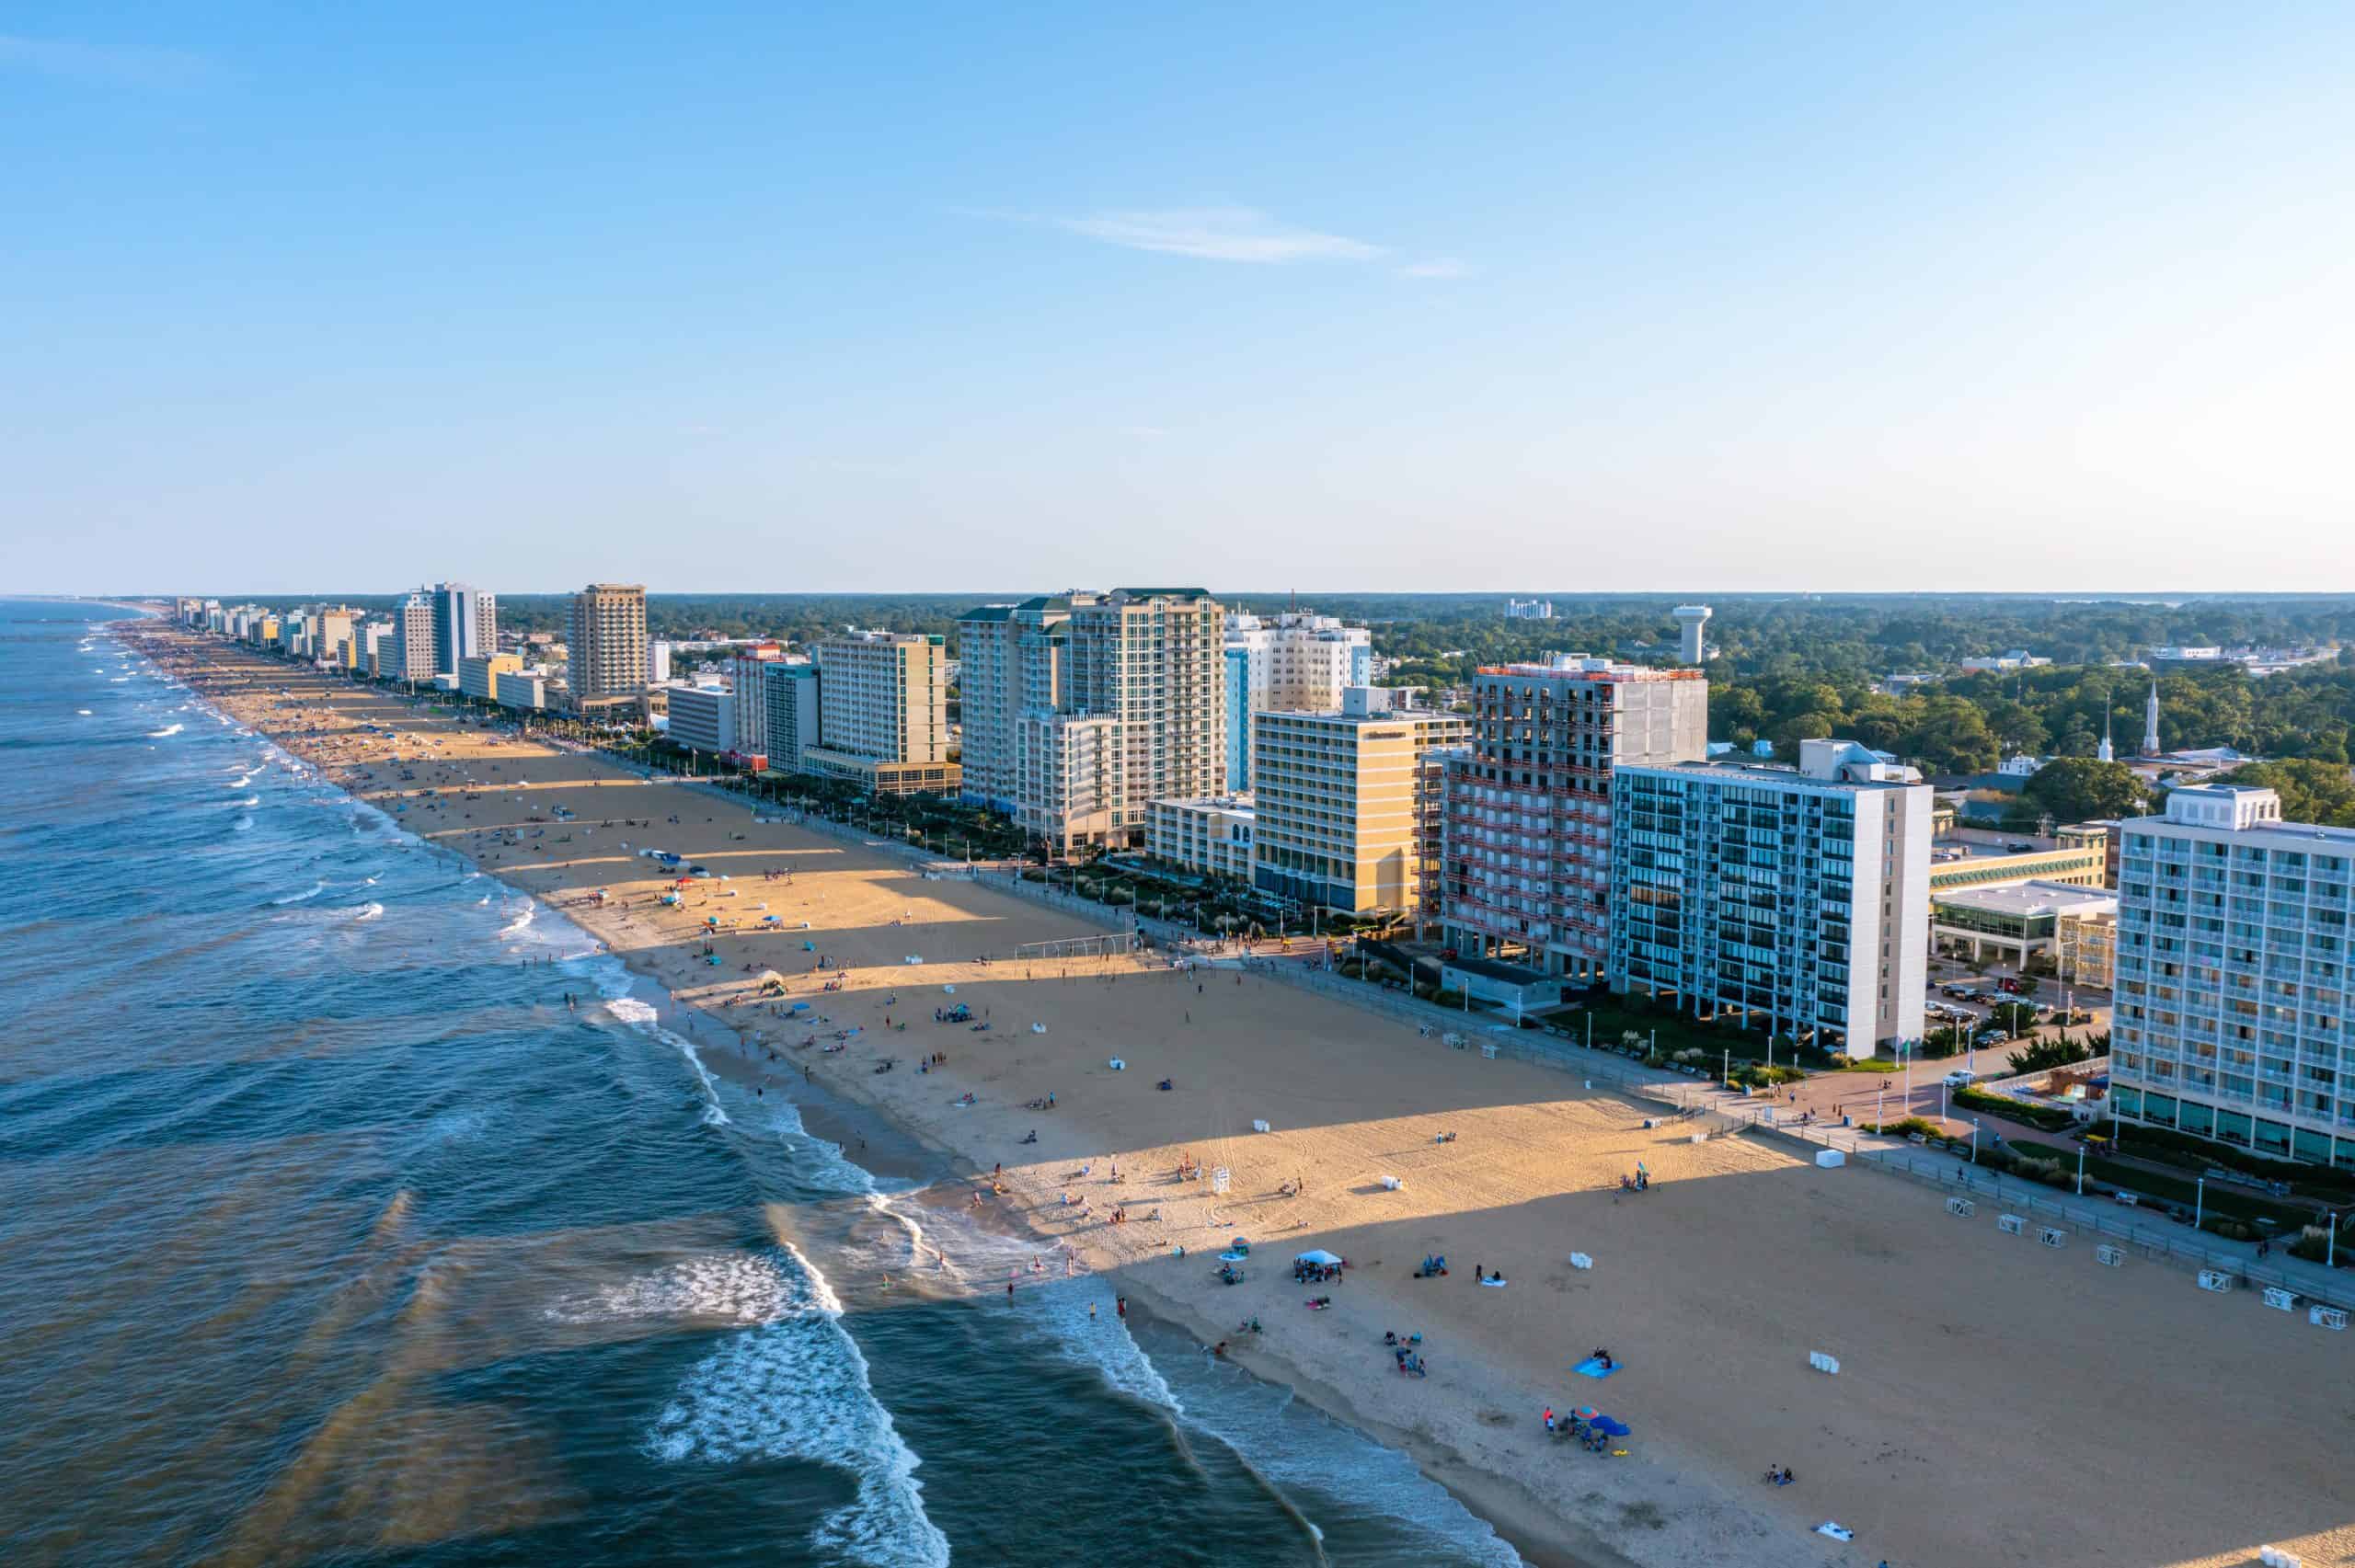
- Documented police killings, Jan. 2020 – Oct. 2024: 8 (1.7 per 100,000 people)
- Share of statewide police killings in city: 6.5%
- Gender of those killed: 100.0% male, 0.0% female
- Race/ethnicity of those killed: 12.5% White, 37.5% Black, 25.0% Hispanic, 12.5% Native American, 0.0% Asian
- Share of those killed with signs of a mental illness: 12.5%
- Share of those killed who were unarmed: 0.0%
- City population: 457,900
Washington: King County

- Documented police killings, Jan. 2020 – Oct. 2024: 31 (1.4 per 100,000 people)
- Share of statewide police killings in county: 21.1%
- Gender of those killed: 93.5% male, 6.5% female
- Race/ethnicity of those killed: 38.7% White, 22.6% Black, 6.5% Hispanic, 0.0% Native American, 6.5% Asian
- Share of those killed with signs of a mental illness: 19.4%
- Share of those killed who were unarmed: 12.9%
- County population: 2,254,371
West Virginia: Kanawha County

- Documented police killings, Jan. 2020 – Oct. 2024: 7 (3.9 per 100,000 people)
- Share of statewide police killings in county: 14.0%
- Gender of those killed: 100.0% male, 0.0% female
- Race/ethnicity of those killed: 71.4% White, 0.0% Black, 0.0% Hispanic, 0.0% Native American, 14.3% Asian
- Share of those killed with signs of a mental illness: 0.0%
- Share of those killed who were unarmed: 14.3%
- County population: 179,895
Wisconsin: Milwaukee County

- Documented police killings, Jan. 2020 – Oct. 2024: 21 (2.3 per 100,000 people)
- Share of statewide police killings in county: 23.9%
- Gender of those killed: 95.2% male, 4.8% female
- Race/ethnicity of those killed: 23.8% White, 57.1% Black, 9.5% Hispanic, 0.0% Native American, 0.0% Asian
- Share of those killed with signs of a mental illness: 23.8%
- Share of those killed who were unarmed: 9.5%
- County population: 933,063
Wyoming: Natrona County
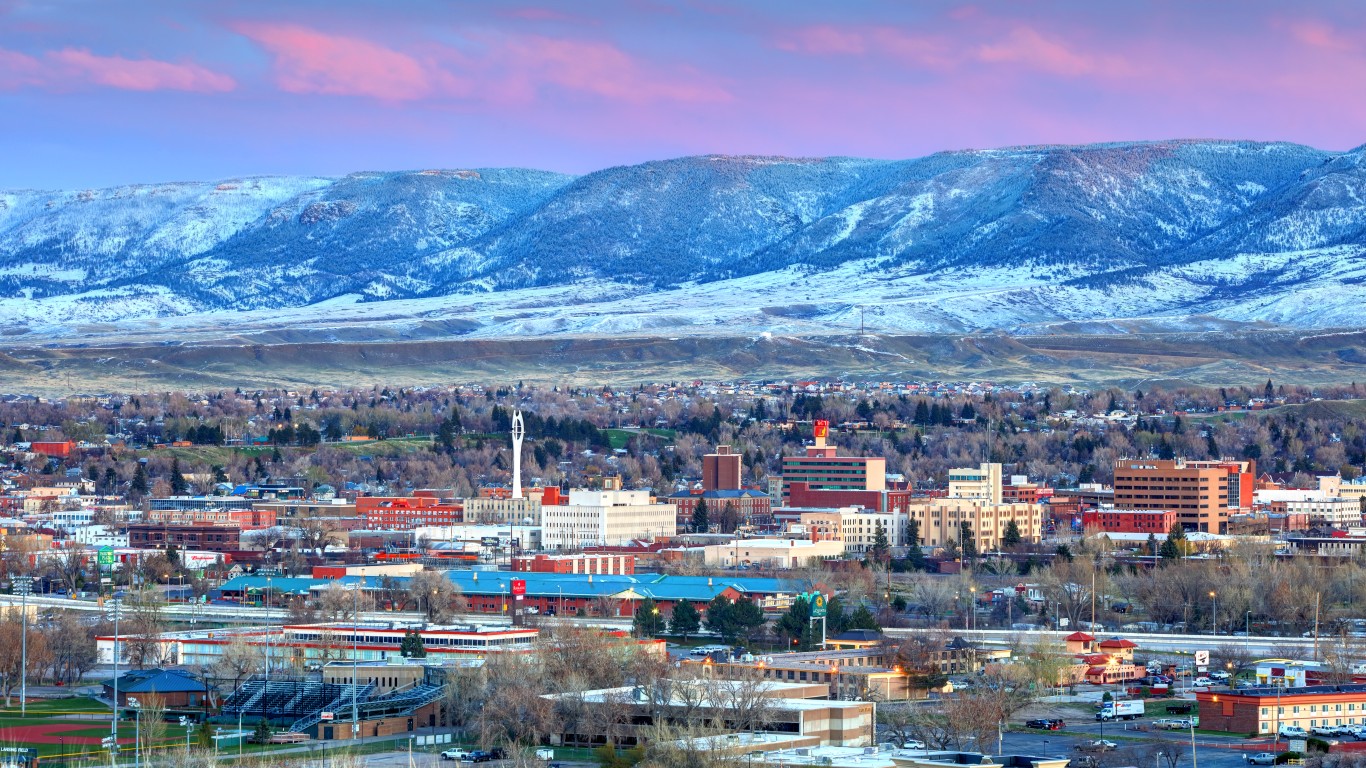
- Documented police killings, Jan. 2020 – Oct. 2024: 6 (7.5 per 100,000 people)
- Share of statewide police killings in county: 23.1%
- Gender of those killed: 100.0% male, 0.0% female
- Race/ethnicity of those killed: 50.0% White, 16.7% Black, 16.7% Hispanic, 0.0% Native American, 0.0% Asian
- Share of those killed with signs of a mental illness: 0.0%
- Share of those killed who were unarmed: 0.0%
- County population: 79,506
Contact [email protected] for any questions or corrections.