
Home prices in the United States surged by 10% in the first half of this year. According to data from Realtor.com, the median list price for a single family home was $439,450 in July 2025, about $39,000 more than in January, and only about $9,550 below the all-time high, reported in June 2022. While home prices fell considerably in the second half of 2024, steady month-over-month increases in 2025 have more than offset last year’s reductions, signaling a continuation of the housing affordability crisis in the United States.
The ongoing housing crisis is being driven largely by a supply and demand imbalance. According to a report from the U.S. Chamber of Commerce, the country would need at least an additional 4.5 million new homes to meet consumer demand — and when demand outpaces supply, prices go up. Currently, an estimated 76.4 million households — 57% of all American households — cannot afford a $300,000 home, according to the National Association of Home Builders. Notably, most houses in the U.S. are selling for far more than $300,000.
While there is no end in sight for the national housing affordability crisis, real estate markets are highly localized — and despite what the national data may suggest, there are several cities across the country where home prices have come down considerably in 2025.
Using data from Realtor.com, 24/7 Wall St. identified the cities where home prices have come down the most this year. We reviewed historical, monthly data for over 720 metropolitan areas and ranked them on the relative change in median list prices from January 2025 to July 2025. Only metro areas where list prices were not flagged for potential data quality issues were considered.
Of the 724 U.S. metro areas with available data, there are 38 where median list prices have come down by at least 5% so far in 2025. In over a dozen of these places, home prices have fallen by 10% or more since January. While these cities span the country, from the Western U.S. to the Northeast, the largest share of cities on this list are in the Southern states.
The factors pushing prices down in these places vary, but a common factor shared by the vast majority of cities on this list is growing housing inventory. In all but two cities on this list, more homes were listed on the market in July than in January. (Here is a look at the most affordable cities for renters in every state.)
It is important to note that while prices have fallen in each of these places over the last six months, some still have relatively expensive real estate markets. In cities like Breckenridge, Colorado and Jackson, Wyoming, most homes are still listed for over $1 million. (Here is a look at how Baby Boomers impacted the housing market for younger buyers.)
These are the U.S. cities where home prices have fallen the most so far this year.
Why It Matters

Demand for housing in the United States has outpaced supply for years. Currently, the nationwide inventory shortage is estimated to be above 4.5 million housing units. As a result, home prices have surged in recent years, and according to Realtor.com, median list prices climbed nearly 10% in the first half of 2025 alone. Not all corners of the country have been impacted by the same supply and demand dynamics, however, and in over three dozen U.S. cities, list prices have come down meaningfully this year.
38. Hinesville, GA

- Year-to-date change in median list price, 2025: -5.0% (-$15,225)
- Median home list price: $302,344 in January 2025, $287,119 in July 2025
- Median size of a listed home: 1,944 sq. ft. in January 2025, 1,787 sq. ft. in July 2025
- Median time on market for a listed home: 72 days in January 2025, 58 days in July 2025
- Total number of homes for sale: 505 in January 2025, 816 in July 2025
37. Natchitoches, LA

- Year-to-date change in median list price, 2025: -5.1% (-$15,000)
- Median home list price: $295,000 in January 2025, $280,000 in July 2025
- Median size of a listed home: 2,000 sq. ft. in January 2025, 1,912 sq. ft. in July 2025
- Median time on market for a listed home: 102 days in January 2025, 101 days in July 2025
- Total number of homes for sale: 107 in January 2025, 123 in July 2025
36. McMinnville, TN

- Year-to-date change in median list price, 2025: -5.1% (-$17,750)
- Median home list price: $347,650 in January 2025, $329,900 in July 2025
- Median size of a listed home: 1,784 sq. ft. in January 2025, 1,756 sq. ft. in July 2025
- Median time on market for a listed home: 93 days in January 2025, 65 days in July 2025
- Total number of homes for sale: 251 in January 2025, 287 in July 2025
35. Danville, KY

- Year-to-date change in median list price, 2025: -5.2% (-$14,975)
- Median home list price: $289,925 in January 2025, $274,950 in July 2025
- Median size of a listed home: 1,760 sq. ft. in January 2025, 1,717 sq. ft. in July 2025
- Median time on market for a listed home: 84 days in January 2025, 58 days in July 2025
- Total number of homes for sale: 201 in January 2025, 269 in July 2025
34. Cape Coral-Fort Myers, FL

- Year-to-date change in median list price, 2025: -5.5% (-$24,189)
- Median home list price: $439,900 in January 2025, $415,711 in July 2025
- Median size of a listed home: 1,700 sq. ft. in January 2025, 1,694 sq. ft. in July 2025
- Median time on market for a listed home: 71 days in January 2025, 101 days in July 2025
- Total number of homes for sale: 14,462 in January 2025, 14,577 in July 2025
33. Red Bluff, CA

- Year-to-date change in median list price, 2025: -6.1% (-$25,500)
- Median home list price: $417,500 in January 2025, $392,000 in July 2025
- Median size of a listed home: 1,744 sq. ft. in January 2025, 1,666 sq. ft. in July 2025
- Median time on market for a listed home: 106 days in January 2025, 75 days in July 2025
- Total number of homes for sale: 243 in January 2025, 311 in July 2025
32. Emporia, KS

- Year-to-date change in median list price, 2025: -6.4% (-$12,425)
- Median home list price: $193,500 in January 2025, $181,075 in July 2025
- Median size of a listed home: 1,396 sq. ft. in January 2025, 1,679 sq. ft. in July 2025
- Median time on market for a listed home: 74 days in January 2025, 50 days in July 2025
- Total number of homes for sale: 56 in January 2025, 124 in July 2025
31. Corinth, MS

- Year-to-date change in median list price, 2025: -6.6% (-$16,450)
- Median home list price: $249,950 in January 2025, $233,500 in July 2025
- Median size of a listed home: 1,986 sq. ft. in January 2025, 1,984 sq. ft. in July 2025
- Median time on market for a listed home: 96 days in January 2025, 68 days in July 2025
- Total number of homes for sale: 87 in January 2025, 105 in July 2025
30. Petoskey, MI

- Year-to-date change in median list price, 2025: -6.8% (-$56,500)
- Median home list price: $831,000 in January 2025, $774,500 in July 2025
- Median size of a listed home: 2,348 sq. ft. in January 2025, 2,392 sq. ft. in July 2025
- Median time on market for a listed home: 106 days in January 2025, 39 days in July 2025
- Total number of homes for sale: 169 in January 2025, 307 in July 2025
29. Lewistown, PA

- Year-to-date change in median list price, 2025: -7.0% (-$15,075)
- Median home list price: $215,000 in January 2025, $199,925 in July 2025
- Median size of a listed home: 1,440 sq. ft. in January 2025, 1,414 sq. ft. in July 2025
- Median time on market for a listed home: 80 days in January 2025, 43 days in July 2025
- Total number of homes for sale: 88 in January 2025, 102 in July 2025
28. Bogalusa, LA

- Year-to-date change in median list price, 2025: -7.1% (-$15,000)
- Median home list price: $210,000 in January 2025, $195,000 in July 2025
- Median size of a listed home: 1,791 sq. ft. in January 2025, 1,871 sq. ft. in July 2025
- Median time on market for a listed home: 96 days in January 2025, 86 days in July 2025
- Total number of homes for sale: 139 in January 2025, 140 in July 2025
27. McPherson, KS

- Year-to-date change in median list price, 2025: -7.3% (-$20,368)
- Median home list price: $280,368 in January 2025, $260,000 in July 2025
- Median size of a listed home: 1,894 sq. ft. in January 2025, 1,982 sq. ft. in July 2025
- Median time on market for a listed home: 82 days in January 2025, 44 days in July 2025
- Total number of homes for sale: 89 in January 2025, 104 in July 2025
26. Breckenridge, CO

- Year-to-date change in median list price, 2025: -7.9% (-$90,000)
- Median home list price: $1,140,000 in January 2025, $1,050,000 in July 2025
- Median size of a listed home: 1,351 sq. ft. in January 2025, 1,395 sq. ft. in July 2025
- Median time on market for a listed home: 104 days in January 2025, 58 days in July 2025
- Total number of homes for sale: 803 in January 2025, 1,269 in July 2025
25. Arcadia, FL

- Year-to-date change in median list price, 2025: -8.1% (-$32,000)
- Median home list price: $396,000 in January 2025, $364,000 in July 2025
- Median size of a listed home: 1,476 sq. ft. in January 2025, 1,752 sq. ft. in July 2025
- Median time on market for a listed home: 100 days in January 2025, 88 days in July 2025
- Total number of homes for sale: 160 in January 2025, 145 in July 2025
24. Cordele, GA

- Year-to-date change in median list price, 2025: -8.2% (-$26,450)
- Median home list price: $322,950 in January 2025, $296,500 in July 2025
- Median size of a listed home: 2,126 sq. ft. in January 2025, 2,228 sq. ft. in July 2025
- Median time on market for a listed home: 128 days in January 2025, 99 days in July 2025
- Total number of homes for sale: 80 in January 2025, 109 in July 2025
23. Sheboygan, WI

- Year-to-date change in median list price, 2025: -8.7% (-$32,350)
- Median home list price: $371,000 in January 2025, $338,650 in July 2025
- Median size of a listed home: 1,624 sq. ft. in January 2025, 1,660 sq. ft. in July 2025
- Median time on market for a listed home: 56 days in January 2025, 40 days in July 2025
- Total number of homes for sale: 209 in January 2025, 315 in July 2025
22. Eufaula, AL-GA

- Year-to-date change in median list price, 2025: -8.9% (-$28,725)
- Median home list price: $323,675 in January 2025, $294,950 in July 2025
- Median size of a listed home: 2,287 sq. ft. in January 2025, 2,097 sq. ft. in July 2025
- Median time on market for a listed home: 123 days in January 2025, 84 days in July 2025
- Total number of homes for sale: 103 in January 2025, 142 in July 2025
21. Ada, OK

- Year-to-date change in median list price, 2025: -9.2% (-$25,000)
- Median home list price: $272,500 in January 2025, $247,500 in July 2025
- Median size of a listed home: 1,757 sq. ft. in January 2025, 1,773 sq. ft. in July 2025
- Median time on market for a listed home: 69 days in January 2025, 70 days in July 2025
- Total number of homes for sale: 173 in January 2025, 196 in July 2025
20. Espanola, NM

- Year-to-date change in median list price, 2025: -9.3% (-$48,375)
- Median home list price: $522,375 in January 2025, $474,000 in July 2025
- Median size of a listed home: 2,272 sq. ft. in January 2025, 2,057 sq. ft. in July 2025
- Median time on market for a listed home: 111 days in January 2025, 88 days in July 2025
- Total number of homes for sale: 100 in January 2025, 132 in July 2025
19. Naples-Marco Island, FL

- Year-to-date change in median list price, 2025: -9.4% (-$74,750)
- Median home list price: $791,750 in January 2025, $717,000 in July 2025
- Median size of a listed home: 1,804 sq. ft. in January 2025, 1,783 sq. ft. in July 2025
- Median time on market for a listed home: 70 days in January 2025, 112 days in July 2025
- Total number of homes for sale: 7,802 in January 2025, 7,291 in July 2025
18. Brevard, NC

- Year-to-date change in median list price, 2025: -9.5% (-$65,750)
- Median home list price: $694,500 in January 2025, $628,750 in July 2025
- Median size of a listed home: 2,145 sq. ft. in January 2025, 1,986 sq. ft. in July 2025
- Median time on market for a listed home: 112 days in January 2025, 67 days in July 2025
- Total number of homes for sale: 196 in January 2025, 395 in July 2025
17. Elkins, WV

- Year-to-date change in median list price, 2025: -9.7% (-$26,425)
- Median home list price: $273,425 in January 2025, $247,000 in July 2025
- Median size of a listed home: 1,849 sq. ft. in January 2025, 1,736 sq. ft. in July 2025
- Median time on market for a listed home: 96 days in January 2025, 79 days in July 2025
- Total number of homes for sale: 69 in January 2025, 105 in July 2025
16. Riverton, WY

- Year-to-date change in median list price, 2025: -9.7% (-$48,000)
- Median home list price: $495,000 in January 2025, $447,000 in July 2025
- Median size of a listed home: 2,017 sq. ft. in January 2025, 1,979 sq. ft. in July 2025
- Median time on market for a listed home: 106 days in January 2025, 52 days in July 2025
- Total number of homes for sale: 119 in January 2025, 205 in July 2025
15. Blytheville, AR

- Year-to-date change in median list price, 2025: -9.7% (-$19,275)
- Median home list price: $197,925 in January 2025, $178,650 in July 2025
- Median size of a listed home: 1,661 sq. ft. in January 2025, 1,600 sq. ft. in July 2025
- Median time on market for a listed home: 72 days in January 2025, 59 days in July 2025
- Total number of homes for sale: 127 in January 2025, 149 in July 2025
14. Durant, OK

- Year-to-date change in median list price, 2025: -10.0% (-$30,648)
- Median home list price: $306,873 in January 2025, $276,225 in July 2025
- Median size of a listed home: 1,772 sq. ft. in January 2025, 1,712 sq. ft. in July 2025
- Median time on market for a listed home: 75 days in January 2025, 73 days in July 2025
- Total number of homes for sale: 195 in January 2025, 296 in July 2025
13. Urbana, OH
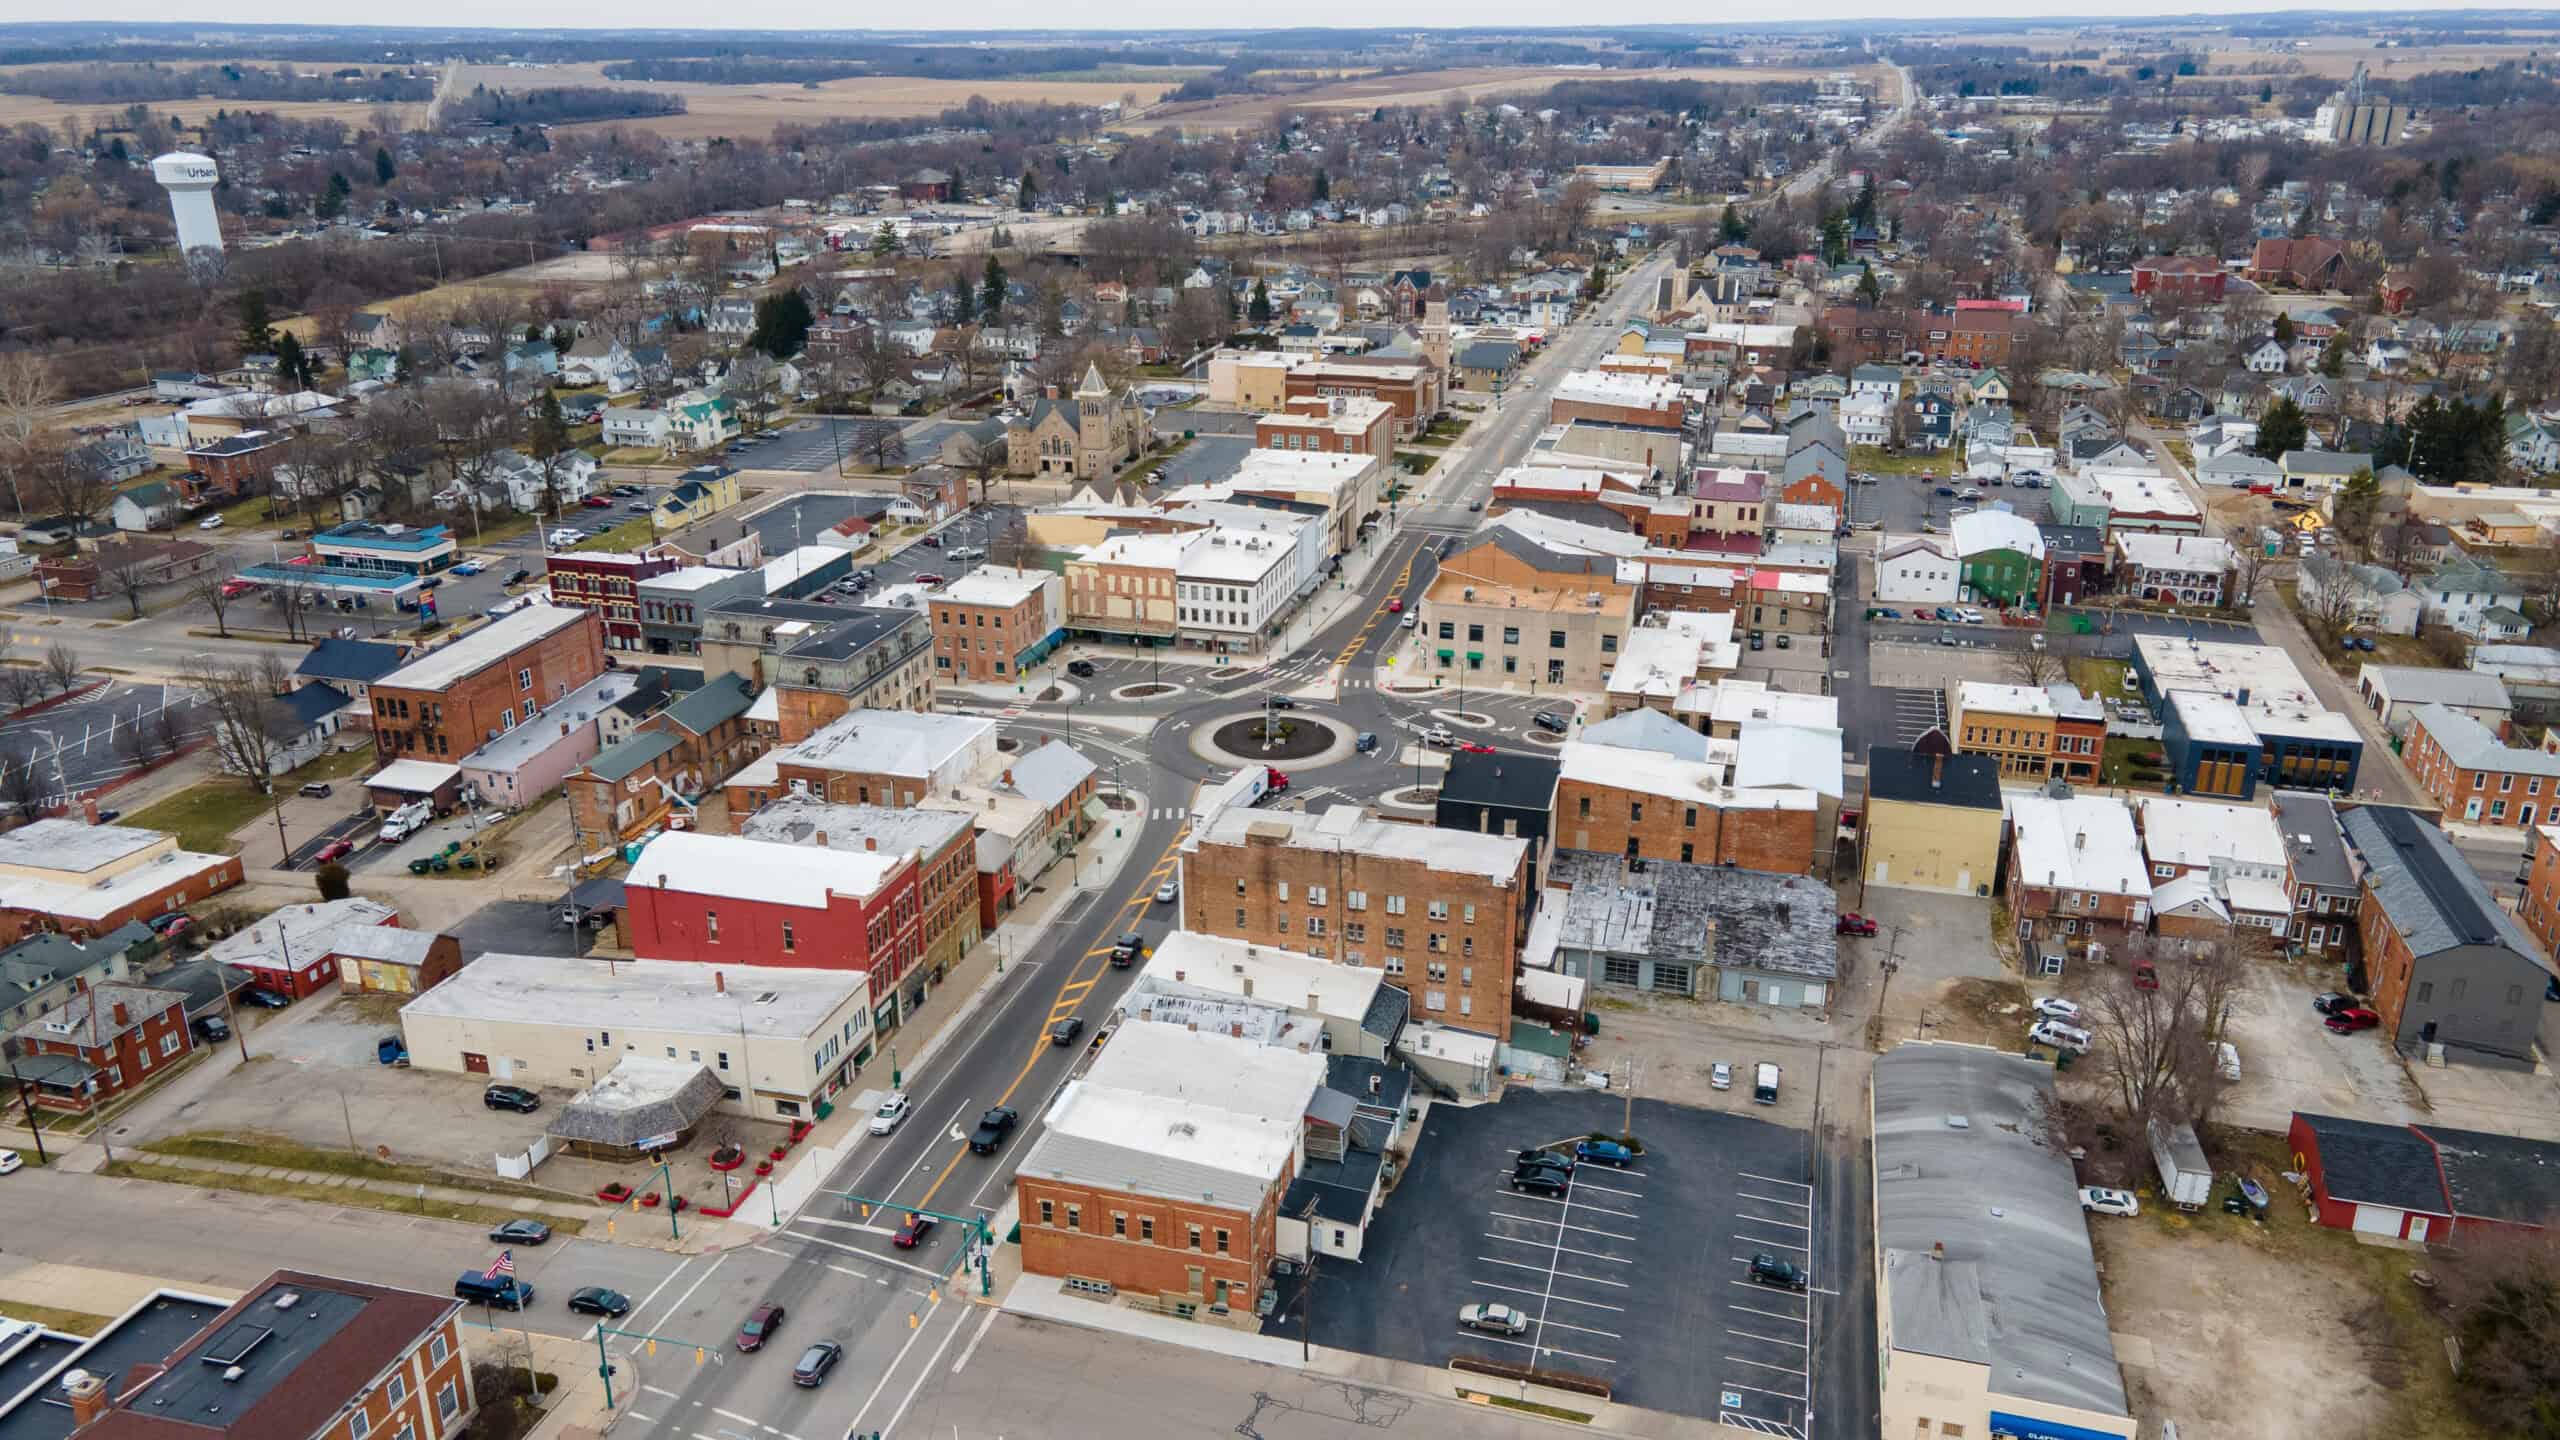
- Year-to-date change in median list price, 2025: -10.7% (-$30,013)
- Median home list price: $279,913 in January 2025, $249,900 in July 2025
- Median size of a listed home: 1,776 sq. ft. in January 2025, 1,676 sq. ft. in July 2025
- Median time on market for a listed home: 50 days in January 2025, 37 days in July 2025
- Total number of homes for sale: 72 in January 2025, 99 in July 2025
12. Cambridge, OH

- Year-to-date change in median list price, 2025: -11.0% (-$24,025)
- Median home list price: $219,000 in January 2025, $194,975 in July 2025
- Median size of a listed home: 1,673 sq. ft. in January 2025, 1,590 sq. ft. in July 2025
- Median time on market for a listed home: 115 days in January 2025, 55 days in July 2025
- Total number of homes for sale: 136 in January 2025, 150 in July 2025
11. Williston, ND

- Year-to-date change in median list price, 2025: -11.0% (-$47,950)
- Median home list price: $436,200 in January 2025, $388,250 in July 2025
- Median size of a listed home: 1,993 sq. ft. in January 2025, 1,755 sq. ft. in July 2025
- Median time on market for a listed home: 80 days in January 2025, 44 days in July 2025
- Total number of homes for sale: 88 in January 2025, 138 in July 2025
10. Deming, NM

- Year-to-date change in median list price, 2025: -11.2% (-$28,750)
- Median home list price: $257,500 in January 2025, $228,750 in July 2025
- Median size of a listed home: 1,842 sq. ft. in January 2025, 1,784 sq. ft. in July 2025
- Median time on market for a listed home: 92 days in January 2025, 70 days in July 2025
- Total number of homes for sale: 71 in January 2025, 92 in July 2025
9. Hilo-Kailua, HI

- Year-to-date change in median list price, 2025: -11.2% (-$81,025)
- Median home list price: $725,000 in January 2025, $643,975 in July 2025
- Median size of a listed home: 1,446 sq. ft. in January 2025, 1,356 sq. ft. in July 2025
- Median time on market for a listed home: 88 days in January 2025, 87 days in July 2025
- Total number of homes for sale: 1,389 in January 2025, 1,452 in July 2025
8. Elk City, OK

- Year-to-date change in median list price, 2025: -11.6% (-$26,275)
- Median home list price: $227,475 in January 2025, $201,200 in July 2025
- Median size of a listed home: 1,771 sq. ft. in January 2025, 1,731 sq. ft. in July 2025
- Median time on market for a listed home: 118 days in January 2025, 85 days in July 2025
- Total number of homes for sale: 125 in January 2025, 168 in July 2025
7. Lewisburg, PA

- Year-to-date change in median list price, 2025: -13.0% (-$61,125)
- Median home list price: $470,625 in January 2025, $409,500 in July 2025
- Median size of a listed home: 2,240 sq. ft. in January 2025, 2,157 sq. ft. in July 2025
- Median time on market for a listed home: 76 days in January 2025, 70 days in July 2025
- Total number of homes for sale: 72 in January 2025, 120 in July 2025
6. Sidney, OH

- Year-to-date change in median list price, 2025: -14.7% (-$39,937)
- Median home list price: $270,975 in January 2025, $231,038 in July 2025
- Median size of a listed home: 1,648 sq. ft. in January 2025, 1,617 sq. ft. in July 2025
- Median time on market for a listed home: 65 days in January 2025, 47 days in July 2025
- Total number of homes for sale: 98 in January 2025, 129 in July 2025
5. Rutland, VT

- Year-to-date change in median list price, 2025: -15.1% (-$75,300)
- Median home list price: $499,800 in January 2025, $424,500 in July 2025
- Median size of a listed home: 2,394 sq. ft. in January 2025, 1,828 sq. ft. in July 2025
- Median time on market for a listed home: 86 days in January 2025, 51 days in July 2025
- Total number of homes for sale: 223 in January 2025, 351 in July 2025
4. Baker City, OR

- Year-to-date change in median list price, 2025: -15.9% (-$84,825)
- Median home list price: $533,250 in January 2025, $448,425 in July 2025
- Median size of a listed home: 2,215 sq. ft. in January 2025, 1,848 sq. ft. in July 2025
- Median time on market for a listed home: 127 days in January 2025, 72 days in July 2025
- Total number of homes for sale: 106 in January 2025, 145 in July 2025
3. Paragould, AR

- Year-to-date change in median list price, 2025: -16.5% (-$39,450)
- Median home list price: $239,450 in January 2025, $200,000 in July 2025
- Median size of a listed home: 1,719 sq. ft. in January 2025, 1,593 sq. ft. in July 2025
- Median time on market for a listed home: 81 days in January 2025, 60 days in July 2025
- Total number of homes for sale: 184 in January 2025, 250 in July 2025
2. Jackson, WY-ID

- Year-to-date change in median list price, 2025: -17.8% (-$384,750)
- Median home list price: $2,157,250 in January 2025, $1,772,500 in July 2025
- Median size of a listed home: 2,363 sq. ft. in January 2025, 2,138 sq. ft. in July 2025
- Median time on market for a listed home: 129 days in January 2025, 59 days in July 2025
- Total number of homes for sale: 341 in January 2025, 547 in July 2025
1. Sterling, CO
- Year-to-date change in median list price, 2025: -20.9% (-$66,025)
- Median home list price: $316,000 in January 2025, $249,975 in July 2025
- Median size of a listed home: 1,990 sq. ft. in January 2025, 1,872 sq. ft. in July 2025
- Median time on market for a listed home: 85 days in January 2025, 67 days in July 2025
- Total number of homes for sale: 68 in January 2025, 121 in July 2025
Contact [email protected] for any questions or corrections.