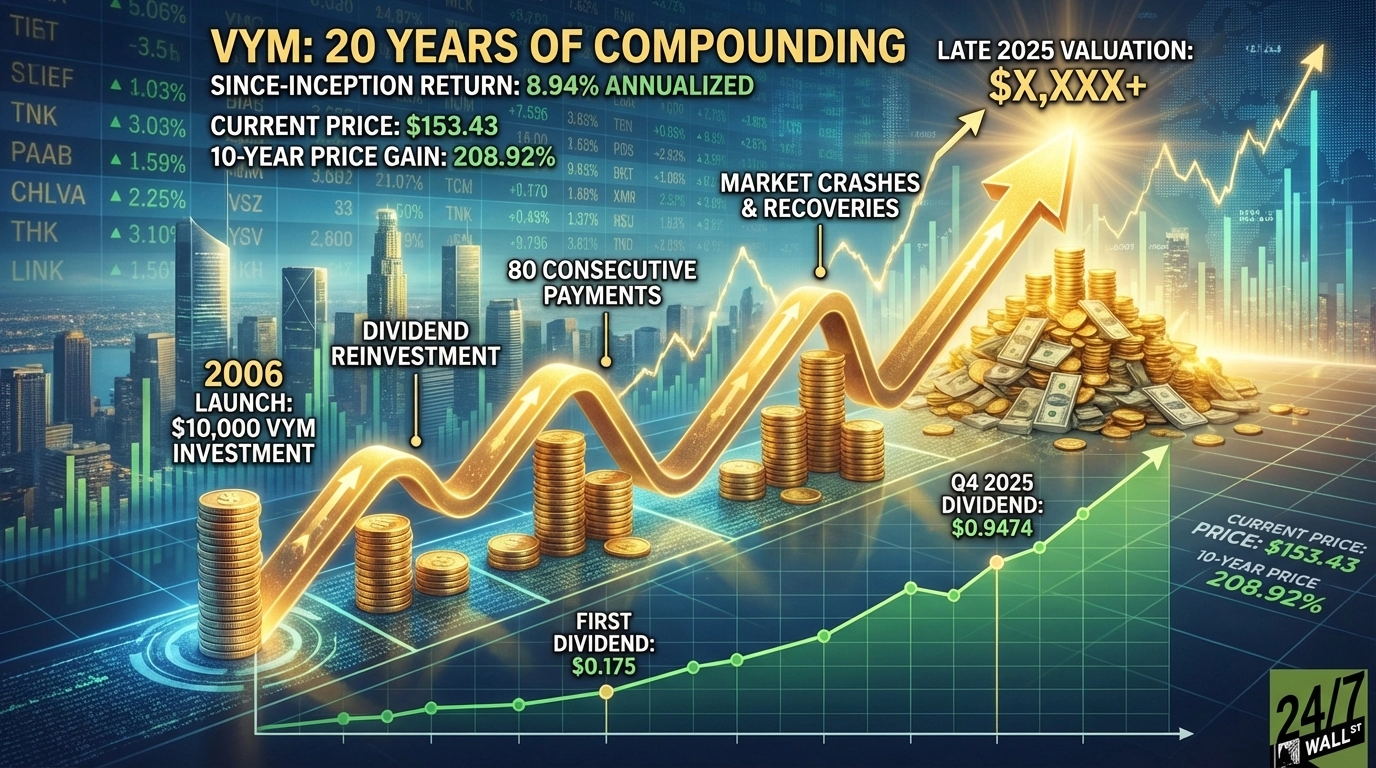
Invest $10,000 in Vanguard High Dividend Yield ETF (NYSEARCA:VYM) at its November 10, 2006 launch and, based on verified historical data, that position would be worth meaningfully more today — with dividends doing much of the heavy lifting.
VYM’s since-inception annualized return of 9.32% is the right baseline for this exercise. That figure comes directly from Vanguard’s official performance data and reflects nearly two decades of actual performance — including two major market crashes, a pandemic, and multiple rate cycles. It is not a projection. It is what the fund actually delivered.
At that rate, $10,000 invested at inception would have grown substantially over roughly 19 years. The fund’s current share price of $153.43 reflects a 208.92% gain on price alone over the past ten years from a starting price of $49.67. Add in nearly two decades of reinvested dividends — with uninterrupted quarterly distributions since launch — and the compounding effect becomes the real story.
VYM’s first dividend was a modest $0.175 per share paid in December 2006. By the fourth quarter of 2025, that quarterly payment had grown to $0.9474 per share — more than five times the original amount. An investor who reinvested every distribution compounded not just the price appreciation but an ever-growing income stream.
What Makes This Rate Defensible
VYM holds roughly 562 stocks selected for above-average dividend yield and tracks the FTSE High Dividend Yield Index. The fund has approximately $88.5 billion in assets and an expense ratio of just 0.04%. Low costs matter enormously over long horizons — every basis point saved compounds alongside every dollar earned.
The fund’s top holdings are not speculative bets. Broadcom (NASDAQ:AVGO), the largest holding at 6.95% of the fund, posted Q4 FY2025 revenue of $18.02 billion, up 28% year-over-year, and raised its quarterly dividend 10% to $0.65 per share. JPMorgan Chase (NYSE:JPM), at 3.63% of the fund, now pays $1.50 per share quarterly — up from $0.05 a decade and a half ago. ExxonMobil (NYSE:XOM), at 2.71% of the fund, has raised its dividend for 43 consecutive years, with the current quarterly payout at $1.03 per share.
These are businesses that generate durable cash flows and have demonstrated a consistent willingness to share them with shareholders. That is the engine behind VYM’s long-term return.
The Biggest Risk to the Math
The 9.32% annualized return assumes dividend reinvestment and includes periods of significant price recovery. A retirement investor who needs to draw income rather than reinvest dividends will experience a lower compounding effect. Additionally, VYM’s 10-year and 5-year annualized returns have exceeded the since-inception figure in recent periods, meaning recent tailwinds — a strong equity market and rising dividends — may not persist at the same pace. A prolonged period of dividend cuts among large-cap payers, or a sustained bear market near retirement, could significantly alter outcomes.
VYM’s nearly two-decade track record illustrates how patient, income-driven compounding has historically performed. Vanguard’s performance data shows that dividend reinvestment from inception has amplified total returns significantly over the fund’s life.