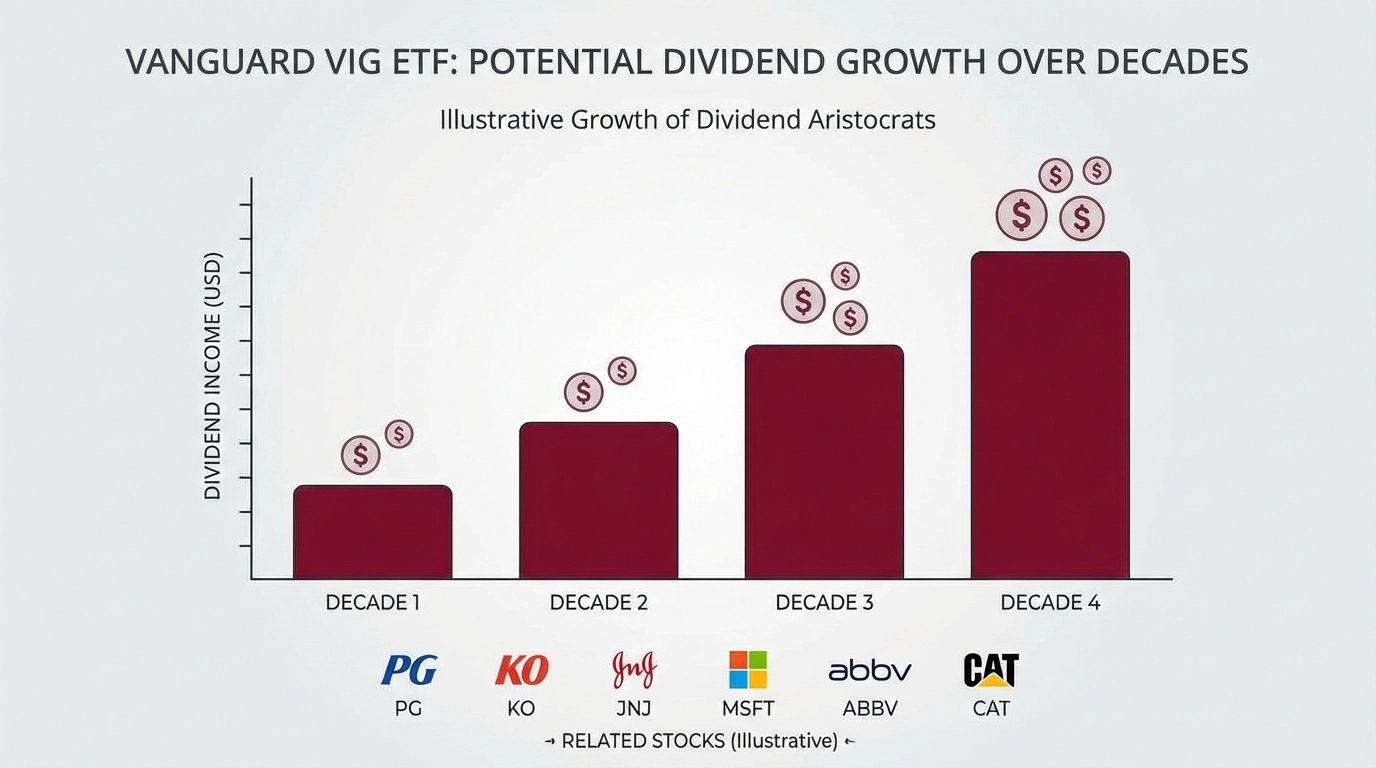
A 1.5% yield sounds unimpressive until you realize the dividend check doubles roughly every seven years. That is the premise behind the Vanguard Dividend Appreciation ETF (NYSEARCA:VIG | VIG Price Prediction): skip the high-yield traps and own companies that raise their dividends year after year, compounding income alongside capital appreciation.
What VIG Is Actually Trying to Do
VIG tracks the NASDAQ US Dividend Achievers Select Index, which requires member companies to have raised their dividends for at least 10 consecutive years. Consistent dividend growth tends to signal disciplined management, durable cash flows, and competitive moats. The fund’s current yield sits at 1.55%, well below income-focused alternatives. It is hunting for quality, not yield.
The return engine is straightforward: earnings grow, dividends grow alongside them, and share prices follow over time. No options overlays, no leverage, no credit risk. VIG carries a net expense ratio of just 4 basis points, making it one of the cheapest ways to access this strategy.
The fund holds more than 400 positions with a portfolio turnover of 11%, reflecting a genuine buy-and-hold approach. Its largest sector exposure is Information Technology at 24.1%, followed by Financials at 19.4% and Healthcare at 16.7%.
The Holdings Tell the Story
Coca-Cola (NYSE:KO) has raised its dividend for 63 consecutive years, with its quarterly payment climbing from $0.16 in 1999 to $0.53 in early 2026. Procter & Gamble (NYSE:PG) pays a quarterly dividend of $1.0568 and plans to return approximately $10 billion in dividends in fiscal 2026.
Johnson & Johnson (NYSE:JNJ) raised its quarterly payout to $1.30 in 2025, backed by $19.7 billion in free cash flow for fiscal 2025 and full-year 2025 revenue of $94.19 billion. Microsoft (NASDAQ:MSFT) raised its quarterly dividend to $0.91 in 2026 and returned $12.7 billion to shareholders in a single quarter.
AbbVie (NYSE:ABBV) and Caterpillar (NYSE:CAT) round out the dividend growth roster. Caterpillar has maintained more than 30 consecutive years of dividend increases, with its quarterly payout at $1.51 as of early 2026.
These businesses generate enough cash to raise the dividend every year regardless of the economic backdrop.
Does the Strategy Actually Deliver?
Over the past year, VIG returned 11%, and over ten years it has returned 223%. Year-to-date in 2026, VIG is down about 2%, reflecting broader market pressure rather than any structural breakdown in the strategy.
VIG has historically trailed the S&P 500 during strong growth rallies, because quality dividend growers tend to lag when speculative names lead. What VIG offers in exchange is lower volatility and a growing income stream that compounds over decades. Investors in the r/dividends and r/Bogleheads communities frequently pair VIG with higher-yield alternatives like SCHD to balance dividend growth with current income, while r/personalfinance debates often reduce to “just buy VOO” for pure total return. Both perspectives are defensible depending on what an investor needs from their portfolio.
The Tradeoffs Worth Understanding
- Low current yield: At 1.55%, VIG generates minimal income today. Retirees who need cash flow now will find it insufficient as a standalone income source. The payoff is a dividend stream that grows meaningfully over a decade or more, which matters most to investors with a long runway ahead.
- Tech concentration risk: With Information Technology as the largest sector at 24.1%, VIG is more sensitive to tech sector volatility than its dividend-focused branding might suggest. Microsoft’s year-to-date price decline of nearly 23% in 2026 illustrates how a large holding can drag the fund even when the dividend remains intact.
- Underperforms in pure growth environments: The dividend-growth filter excludes high-growth companies that reinvest all earnings. In bull markets driven by AI or speculative momentum, VIG will trail a broad market index. Investors who choose VIG accept that tradeoff in exchange for a smoother ride and a compounding income stream.
Pre-retirees and patient accumulators who want equity exposure tilted toward financially durable companies tend to find the tradeoff worthwhile: a lower yield today in exchange for a dividend stream that has historically outpaced inflation over a full market cycle.