Procter & Gamble (NYSE:PG | PG Price Prediction) and Colgate-Palmolive (NYSE:CL) reported quarterly earnings in January, placing two of consumer staples’ most decorated dividend payers in sharp contrast. Procter & Gamble carries 69 consecutive years of dividend increases, while Colgate has notched 63 straight years. Both navigate tariffs, sluggish volume, and cautious consumer spending.
Brands Doing the Work, but Differently
Procter & Gamble’s Q2 FY2026 showed a business holding ground rather than accelerating. Organic sales came in flat, with 1% pricing offset by a 1% unit volume decline. Beauty led with 5% organic growth, and Health Care matched that pace. Baby, Feminine & Family Care weakened, where organic sales fell 4%, with Family Care down double digits.

Colgate’s Q4 2025 told a livelier top-line story. Revenue rose 5.8% year-over-year to $5.23 billion, beating estimates by 2.04%. Organic sales grew 2.2%, with 3.1% foreign exchange tailwind amplifying the headline. Hill’s Pet Nutrition contributed $1.20 billion, up 4.9%, and Africa/Eurasia surged 10.3% organically.
North America slipped 1.8% organically. The quarter carried a painful footnote: a $919 million goodwill impairment on the Filorga skin health business, driven by weak China performance, pushing GAAP EPS to -$0.05.
| Business Driver | Procter & Gamble | Colgate-Palmolive |
|---|---|---|
| Revenue (Most Recent Quarter) | $22.21B | $5.23B |
| Organic Sales Growth | Flat | +2.2% |
| Dividend Streak | 69 years | 63 years |
| Quarterly Dividend | $1.0568 | $0.53 |
| Dividend Yield | 2.91% | 2.44% |
Scale vs. Agility: Two Different Strategic Bets
Procter & Gamble is restructuring at scale. The June 2025 portfolio and productivity plan targets up to 7,000 non-manufacturing overhead cuts by end of FY2027, and capital expenditures jumped 26.16% year-over-year in Q2. The company absorbs approximately $400 million in after-tax tariff costs this fiscal year. Operating income fell 6.53% year-over-year despite revenue rising 1.5%, as restructuring costs and tariff drag compress margins.

Colgate leans into a different reinvention. CEO Noel Wallace unveiled a 2030 strategy built around AI-driven analytics, science-based innovation, and omni-channel demand generation. The company holds a 41.2% global toothpaste market share and is exiting private-label pet food to sharpen Hill’s.
Its Strategic Growth and Productivity Program targets $200 to $300 million in cumulative pre-tax savings through 2028. Colgate is smaller and faster to pivot, though the Filorga impairment signals execution risk in premium skin care.
| Strategic Lens | Procter & Gamble | Colgate-Palmolive |
|---|---|---|
| Core Bet | Portfolio pruning and scale productivity | AI analytics and global brand penetration |
| Growth Engine | Beauty and Health Care segments | Hill’s Pet Nutrition and emerging markets |
| Key Vulnerability | Tariff drag and volume weakness | North America softness and Filorga overhang |
| Trailing P/E | 21x | 32x |
The Next Test: Volume Recovery Before Margin Erosion
For Procter & Gamble, the second half of FY2026 must deliver on Jejurikar’s promise. FY2026 guidance calls for organic sales flat to up 4% and core EPS of $6.83 to $7.09. Beauty and Health Care must carry more weight while Family Care stabilizes.
The stock trades down 12.29% over the past year, well below its 52-week high of $167.46 and analyst consensus target of $164.95.
Colgate’s FY2026 guidance targets net sales growth of 2% to 6% with gross margin expansion, which sounds credible given recent momentum. North America slipped 1.8% organically in Q4 and needs recovery for the 2030 strategy to gain traction.
Colgate is up 7.16% year-to-date versus PG’s 1.46% gain, a gap reflecting the market rewarding Colgate’s cleaner near-term narrative.
PG vs. CL: What Long-Haul Dividend Investors Are Watching
Both stocks are frequently held in defensive income portfolios given their long dividend histories. Colgate’s year-to-date performance and cleaner Q4 beat appeal to investors seeking near-term momentum. The 2030 strategy targets measurable savings and market share expansion, and Hill’s remains a growth contributor.
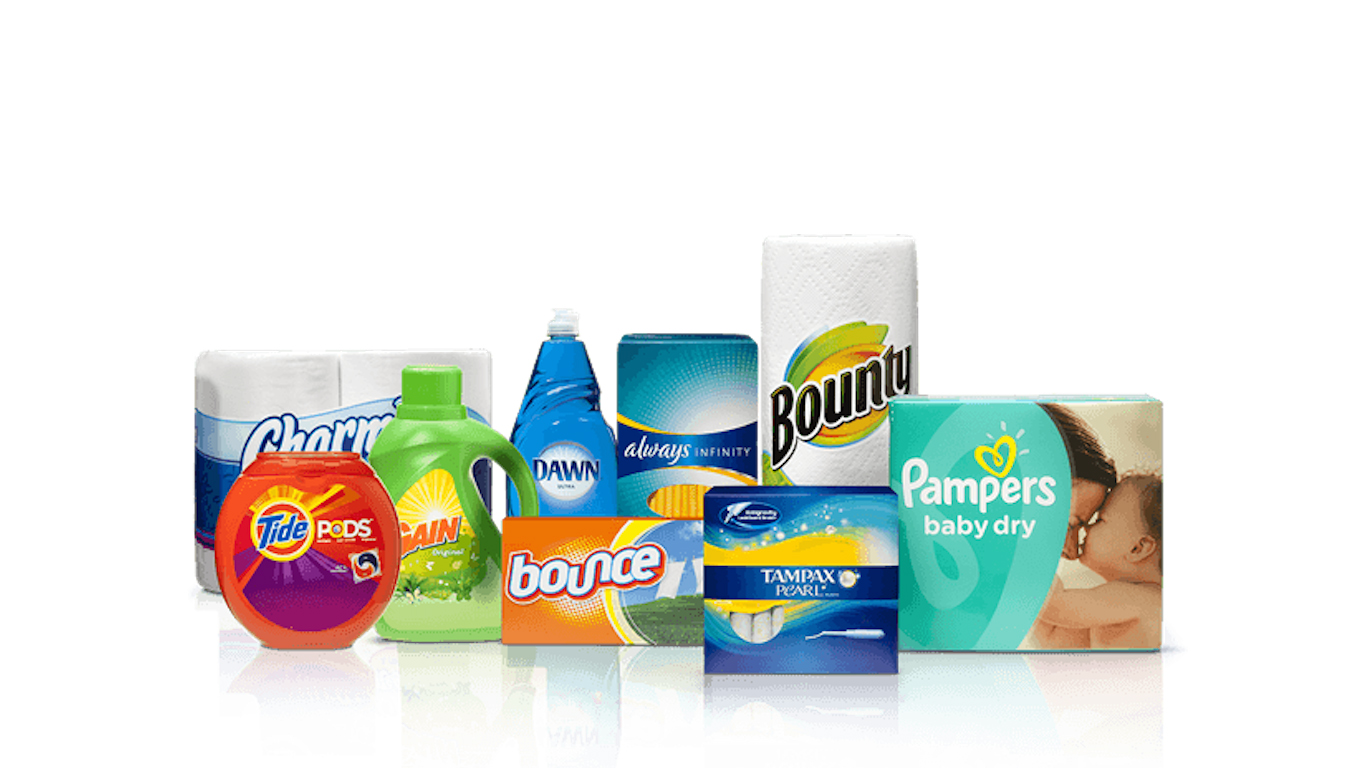
For a dividend-focused investor building a decade-long position, Procter & Gamble’s scale, brand depth across Tide, Pampers, Gillette, and Oral-B, and 135 consecutive years of dividend payments since 1890 represent durability Colgate cannot match.
The 2.91% yield beats Colgate’s 2.44%, and the valuation at 21x trailing earnings is more reasonable than Colgate’s 32x. The restructuring is a short-term drag, but execution could drive meaningful rerating. PG’s current discount to its 52-week high positions it as a lower-valuation option relative to its recent history for income-focused investors monitoring the restructuring timeline.
Contact [email protected] for any questions or corrections.