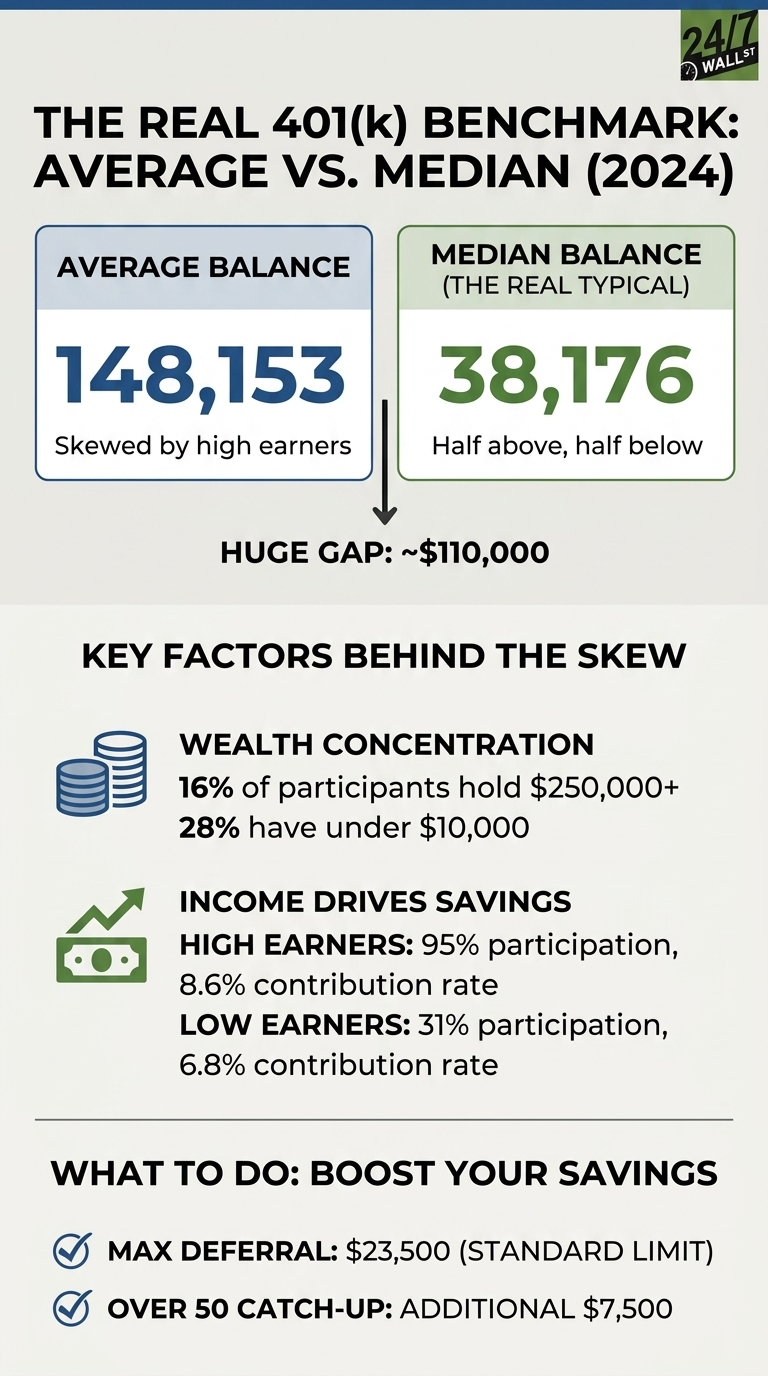
The headline number from Vanguard’s 2025 How America Saves report looks reassuring at first glance: the average 401(k) account balance reached $148,153 in 2024. That figure suggests the typical American worker is sitting on a six-figure retirement nest egg. The median tells a different story. The median balance, which actually describes the worker in the middle of the distribution, was $38,176. That roughly $110,000 gap between those two numbers reflects how unevenly retirement wealth is distributed across the American workforce.
Why the Average Distorts
A simple illustration explains the problem. If 10 people each have $5,000 saved and one person walks in with $5 million, the median balance remains $5,000. The average jumps to roughly $459,000. Nothing changed for the typical saver, yet the headline number now suggests everyone is wealthy.
The same dynamic plays out in 401(k) data. Vanguard explicitly notes that the median “represents the typical participant: Half of all participants had balances above the median, and half had balances below.” The average, by contrast, “is indicative of participants at about the 75th percentile,” meaning roughly 75% of workers have balances below that figure.
Where the Skew Comes From
The pull at the top is highly concentrated. According to Vanguard’s 2026 How America Saves report (covering year-end 2025 data), 18% of participants held $250,000 or more, yet those balances carry most of the weight on the overall average. At the same time, one in four participants had less than $10,000 saved. The distribution resembles a steeply sloped, heavy-tailed curve rather than a tidy bell curve clustered near the headline figure.
Income explains much of that tail. Participants earning $150,000 or more had a 95% participation rate in their employer plans, compared with 31% for those earning under $15,000. High earners also defer a larger share of their pay, contributing an average of 8.6% of income versus 6.8% for the lowest earners. Higher salaries, longer tenures, and a relatively small share of total accounts all combine to push the average upward.
The 6% Stress Test: Hardship on the Rise
While average balances look healthy, the underlying stability of retirement accounts is wavering. Vanguard’s 2026 report on 2025 savings activity confirms that hardship withdrawals reached a record 6% of participants, up from 5% in 2024 and triple the pre-pandemic rate. That figure marks the sixth consecutive annual increase in Vanguard’s data. Medical expenses, along with payments to avoid eviction or foreclosure, were among the leading reasons participants tapped their funds early.
The pattern suggests that for a growing segment of the workforce, the 401(k) is no longer a purely long-term vehicle. It increasingly doubles as a high-stakes emergency fund. A Vanguard survey found that 45% of participants have less than $2,000 in emergency savings outside their retirement account, which helps explain why the plan is the first place many workers turn when a crisis hits. Strong market performance kept average balances climbing, but the hardship data reveals a fragility that the headline numbers obscure. Vanguard’s 2026 report also confirmed that the overall average balance climbed to $167,970 at year-end 2025, a 13% annual increase driven by equity market gains, while the median rose to $44,115.
Reading Your Real Number (Median vs. Average by Age)
To see where you actually stand, look at age-specific data. The gap between mean and median is most pronounced in older brackets, where high-balance savers pull the average far above what most workers actually hold. The table below shows figures from both the 2025 report (year-end 2024) and the more recent 2026 report (year-end 2025).
| Age Group | Median Balance (2024) | Average Balance (2024) | Median Balance (2025) | Average Balance (2025) |
|---|---|---|---|---|
| Under 25 | $1,948 | $6,899 | $2,234 | $7,259 |
| 35-44 | $39,958 | $103,552 | N/A | N/A |
| 55-64 | $95,642 | $271,320 | $107,269 | $305,006 |
| 65+ | $95,425 | $299,442 | $103,202 | $330,186 |
New 2026 Rules for High Earners
The gap between high and low savers is also being reshaped by the SECURE 2.0 Act. Starting in the 2026 tax year, participants aged 50 and older who earned more than $150,000 in FICA wages in the prior year are required to make their catch-up contributions to Roth (after-tax) accounts. This removes the immediate tax-deferral benefit for the very group currently driving average balances higher, fundamentally altering long-term tax planning for top earners.
Key Numbers to Know
The IRS raised the 2026 annual deferral limit to $24,500, up from $23,500 for 2025. Workers aged 50 to 59 or 64 and older can add an $8,000 standard catch-up contribution, for a total of $32,500. Workers aged 60 to 63 qualify for the SECURE 2.0 “super catch-up” of $11,250, pushing their maximum annual contribution to $35,750. Those higher ceilings matter most to high earners: Vanguard’s 2026 data show that 52% of participants earning $150,000 or more used catch-up contributions in 2025, while fewer than 1% of those earning under $30,000 did the same.
Tenure, not age alone, may be the sharpest dividing line. Vanguard’s data show that participants with 10 or more years in their plan average $324,510, while those with under two years carry a median of just $6,140. Time in the plan compounds the advantage of every dollar contributed, which is why auto-enrollment has become such a consequential design feature: it captures workers early, before inertia can delay the first contribution by months or years.
Editor’s note: This article was updated to reflect figures from Vanguard’s “How America Saves 2026” report, including the year-end 2025 average balance of $167,970 and median of $44,115, updated age-group breakdowns for the under-25, 55-64, and 65-and-older cohorts, revised hardship-withdrawal context showing 6% of participants in 2025 represents the sixth consecutive annual increase and triple the pre-pandemic rate, and updated distribution data showing 18% of participants held $250,000 or more and one in four held under $10,000 as of year-end 2025.
Contact [email protected] for any questions or corrections.