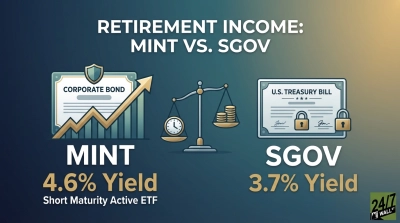
Most retirees own a passive bond index fund without thinking twice. The PIMCO Multisector Bond Active ETF (NYSEARCA:PYLD) is the alternative that has quietly pulled in $8.07 billion in net flows over the past year and now sits near $20 billion in assets, offering a yield of roughly 5.9% against a 10-year Treasury at roughly 4.6%. For income investors who have watched passive bond funds go essentially nowhere over the past five years, PYLD raises a fair question: Is this the moment when active fixed income earns its keep?
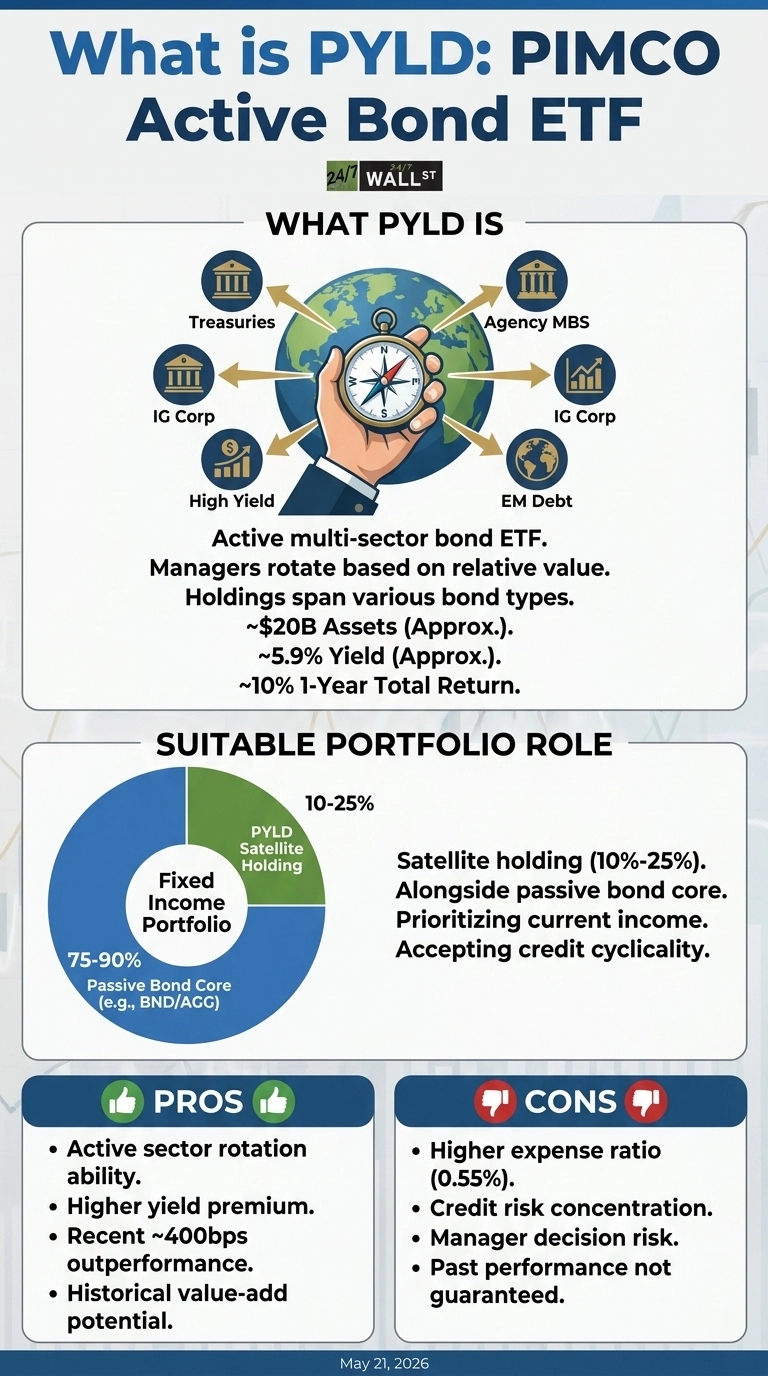
What PYLD Is Built To Do
PYLD stands as PIMCO’s premier actively managed multi-sector fixed-income ETF. The portfolio comprises 1,937 distinct securities spanning sovereign Treasuries, agency mortgage-backed securities, investment-grade credit, high-yield tranches, and emerging market debt obligations, with the top 10 exposures accounting for 55.1% of fund assets.
PIMCO’s management team can dynamically reallocate between these distinct sleeves based on fluctuating relative value, highlighting the strategy’s primary objective: passive aggregate index funds cannot selectively overweight high-yield credit when market spreads widen or compress duration when the yield curve aggressively steepens.
The overarching return engine features two core mechanics. First, baseline coupon income from the underlying corporate and sovereign credit remains structurally elevated because the Federal Funds rate is held at 3.75% and long-duration Treasuries yield roughly 5.1% at 30-year maturity. Second, tactical security selection and active sector rotation provide a secondary layer where PIMCO has historically generated meaningful alpha across credit-heavy investment mandates. Net expense ratio: 0.64%.
Does It Actually Deliver?
The trailing numbers are where the story gets honest. PYLD posted a 1-year total return of roughly 10% through early 2026. Over the same window, the Vanguard Total Bond Market ETF (NASDAQ:BND) returned 5.5%, and the iShares Core U.S. Aggregate Bond ETF (NYSEARCA:AGG) returned 5.6%. That is roughly 400 basis points of outperformance from active credit selection in a single year, well above the fund’s 55-basis-point fee.
The longer view is harsher on the passive side. BND has returned just 0.4% over five years on a total return basis, and AGG is essentially flat at 0.4%. The Bloomberg Aggregate index was built for a world where rates only fell, but the past five years have broken that assumption. Active managers who could underweight long duration and lean into shorter, higher-yielding credit had a structural edge, and PIMCO used it.
The Income Math For A Real Investor
Consider a 67-year-old retiree with $400,000 in fixed income. At PYLD’s roughly 6% yield, that allocation generates about $24,000 annually; at BND’s roughly 4% distribution yield, it generates about $16,000 annually. The $8,000 spread is what active management is selling here. The tradeoff: PYLD’s credit exposure means it will fall harder than BND in a genuine spread-widening event, and PIMCO’s calls can go wrong.
The Tradeoffs Worth Naming
- Credit risk concentration. The yield premium over the roughly 4.6% 10-year Treasury exists because PYLD owns high-yield and emerging-market debt. In a 2022-style drawdown, those sleeves bleed.
- Manager risk. Active management cuts both ways: PIMCO’s calls can go wrong. The firm’s track record in multiple sectors is strong, but past performance is not a guarantee.
- Cost. The 0.55% expense ratio is roughly 18 times AGG’s 0.03% expense ratio. The active fee only earns its keep if outperformance continues.
Where PYLD Fits
PYLD operates most efficiently as a tactical satellite allocation alongside a core passive fixed-income strategy, appropriately scaled to 10%-25% of an individual’s total bond portfolio. Income-focused retirees who prioritize elevated monthly cash distributions and have the risk tolerance to absorb corporate credit cyclicality to achieve a 6% yield premium represent the ideal target audience. Conversely, any investor using fixed-income vehicles solely as a sovereign treasury buffer to insulate against equity market corrections should remain anchored in standard index options such as BND or AGG. This active yield optimization is entirely authentic, but the strategy prices that return directly into heightened credit risk.
Contact [email protected] for any questions or corrections.