Alex Sacerdote, founder of Whale Rock Capital, dropped a line on a recent Invest Like the Best episode that stopped listeners cold: “When we were buying Nvidia in 2023, we were paying 4 times earnings. When we bought Tesla in 2019 for the car S-curve, we were paying 5 times earnings. When we were owning Apple, we were paying 4 times earnings. When we bought Amazon for AWS, we were getting it for free.”
Those figures reflect his forward, S-curve-based earnings-power framework, referring to the price he paid relative to the much larger profits he modeled the businesses would generate 2 to 4 years out.
The Exponential Mispricing Idea
Sacerdote’s core insight is that “the world doesn’t think exponentially, and they’re so focused on the next year or the next quarter.” In his view, that short-term mindset causes investors to consistently underestimate companies positioned at the base of an S-curve, where adoption appears modest before accelerating rapidly.
He believes the biggest opportunities emerge when the market fails to appreciate how quickly growth can compound once that inflection point arrives. His investment framework focuses on three elements: S-curve positioning, competitive advantage, and underappreciated earnings power.
What “4 Times Earnings” Actually Means
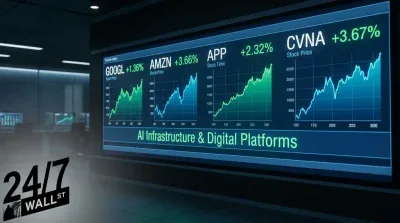
When Sacerdote says he paid four times earnings for NVIDIA (NASDAQ:NVDA | NVDA Price Prediction) in 2023, the multiple is computed against his projection of forward earnings power once the AI infrastructure S-curve inflected, not against the trailing P/E the stock traded at. NVIDIA traded as low as $14.28 at the start of 2023 and ended that year near $49.44. For full-year fiscal 2026, EPS came in at $4.77, with Q1 fiscal 2027 alone delivering $1.87 on revenue of $81.615 billion, up 85.23% year over year. Data Center revenue was $75.246 billion, growing 92%. That is the earnings base a long-term buyer in 2023 was effectively positioning for.
The same lens explains Tesla (NASDAQ:TSLA) in 2019, when shares moved from $20.67 to $27.89 across the year, and Apple (NASDAQ:AAPL) before its Services flywheel was respected by the market. Amazon’s (NASDAQ:AMZN) AWS profits were buried under retail losses for years, so investors paying for the consolidated business were, in Sacerdote’s framing, getting the cloud segment for free. AWS now runs at $37.59B in quarterly revenue at a 37.7% operating margin.
Timing the Inflection
The hardest part of S-curve investing is the long flat line before the market realizes the company’s value and the stock price climbs rapidly. Sacerdote leans on Andy Grove’s concept of strategic inflection points and accepts that “you can’t trust the data” at the turn. The numbers lag the shift, so he relies on intuition and anecdote. His example was that watching AWS pack a Gartner IT Symposium grand ballroom at 9, 10, and 11 o’clock was a real-time demand signal that arrived before AWS dominated any income statement.
It’s Okay to Miss the First 100%
Sacerdote says, “It’s okay to miss the first 100%,” because if the S-curve thesis is right, the bulk of the compounding comes later. He pairs that with mentor Peter Lynch’s advice at Fidelity to “white out the chart. It’s all about the future.” They both believe in figuring out where the company’s earnings power is going, rather than focusing on where the stock has been.
The caveat investors should hold alongside this framework is that investors following this strategy must correctly identify which S-curves actually inflect, and many never do. The forward projections that make a stock look like “4 times earnings” can be wrong, and survivorship bias makes the NVIDIA and Amazon outcomes look more obvious in hindsight than they were at the time. The S-curve framework is a powerful lens for thinking about technology investing, but it still requires work to find the best investment opportunities.
Contact [email protected] for any questions or corrections.