The Dow Just Gained 1000 Points for the 27th Day Ever. 25 of These Days Happened Under Donald Trump.
Twenty-five of the 27 biggest single-day point gains in Dow history share a surprising common thread, but the full picture behind that stat challenges almost everything the headline implies.


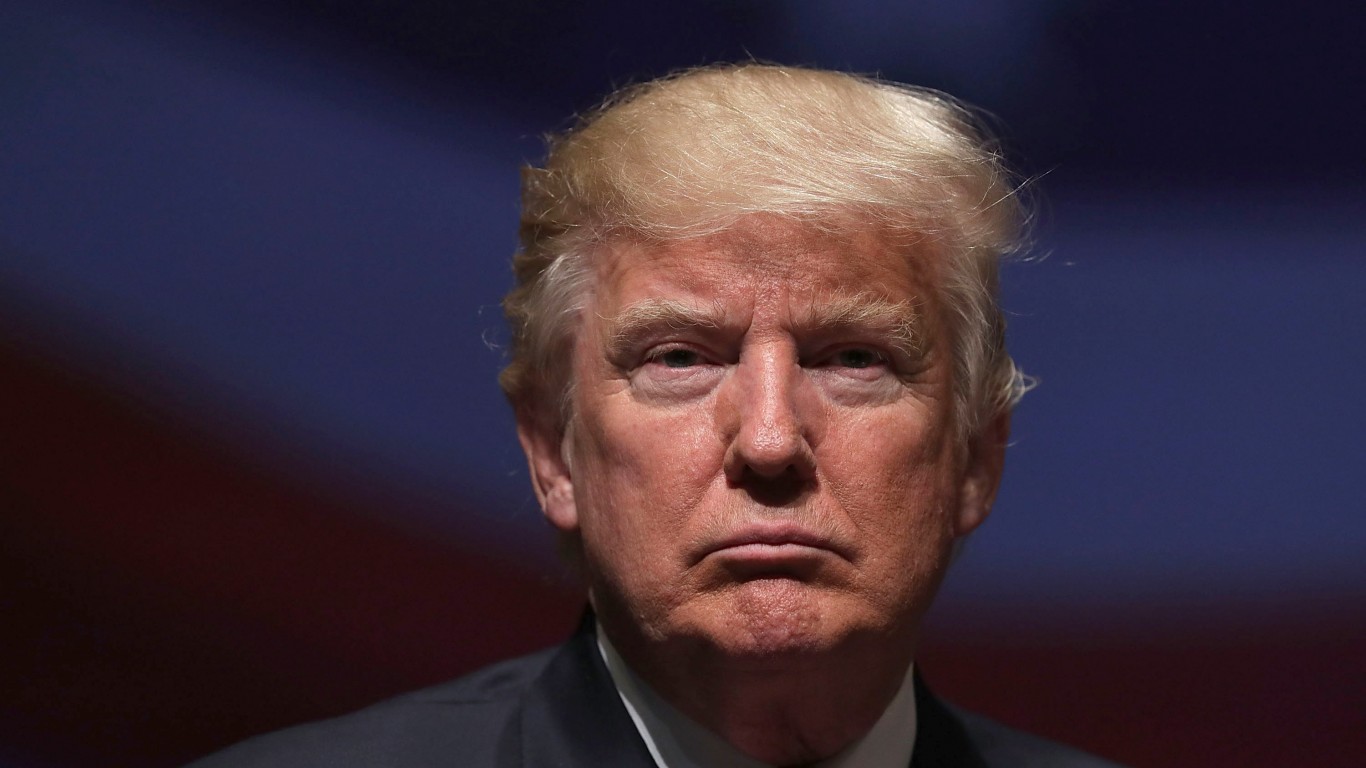
The Dow Jones Industrial Average tacked on 1,094.19 points on Tuesday, closing out the 27th time in its 130-year history the index has posted a 1,000-point single-session gain. According to Ryan Detrick, CMT of Carson Group, 25 of those 27 days have happened under President Donald Trump. The other two came during the Biden administration. The SPDR Dow Jones Industrial Average ETF (NYSE:DIA) rose 1.73% to $540.43, its best session in weeks.
It is a fun stat. It is also one that requires some significant context.
The Largest Intraday Dow Point Gains Ever: 1,000-Point Advances for the Dow, 1896–Current
| Date | Points | President |
|---|---|---|
| 12/26/2018 | 1086.72 | Trump |
| 3/2/2020 | 1296.81 | Trump |
| 3/4/2020 | 1184.93 | Trump |
| 3/10/2020 | 1169.97 | Trump |
| 3/13/2020 | 1989.14 | Trump |
| 3/17/2020 | 1190.83 | Trump |
| 3/24/2020 | 2145.77 | Trump |
| 3/25/2020 | 1315.02 | Trump |
| 3/26/2020 | 1394.51 | Trump |
| 4/6/2020 | 1730.92 | Trump |
| 5/18/2020 | 1023.12 | Trump |
| 6/5/2020 | 1056.48 | Trump |
| 11/9/2020 | 1610.43 | Trump |
| 11/10/2022 | 1213.79 | Biden |
| 11/6/2024 | 1556.90 | Biden |
| 4/8/2025 | 1461.00 | Trump |
| 4/9/2025 | 3133.11 | Trump |
| 4/22/2025 | 1101.62 | Trump |
| 4/23/2025 | 1189.13 | Trump |
| 5/12/2025 | 1168.67 | Trump |
| 2/6/2026 | 1260.93 | Trump |
| 3/23/2026 | 1134.86 | Trump |
| 3/31/2026 | 1167.26 | Trump |
| 4/8/2026 | 1432.63 | Trump |
| 4/17/2026 | 1139.26 | Trump |
| 6/11/2026 | 1050.17 | Trump |
| 8/4/2026 | 1094.19 | Trump |
Source: Carson Group, FactSet, 08/04/2026, @ryandetrick
Why the Stat Looks the Way It Does
The Dow is a price-weighted index quoted in points. A 1,000-point move at 20,000 is a 5% day. A 1,000-point move at 45,000 barely clears 2%. Because the index sits much higher than it did a decade ago, four-digit point swings are easier to produce. This is arithmetic at work.
Look at when the days cluster. Eleven of them fell in March through June 2020, the COVID crash. Five more hit in April and May 2025, during the tariff panic. Big up days travel with big down days. That is volatility clustering, and it is the market’s fingerprint during stress. Today’s session came with the VIX at 15.86, but the March 2026 peak of 31.05 is a reminder of how quickly conditions can flip.
The Actual Scoreboard
Presidential-return comparisons are messy (they exclude dividends and reflect the Fed, valuations, and global shocks far more than the Oval Office), but here is the price-only picture for the S&P 500:
- Trump, 2nd term (partial, in progress): +29.06%
- Biden: +55.66%
- Trump, 1st term: +67.00%
- Obama, 2nd term: +52.30%
- Obama, 1st term: +84.10%
Bottom line: The record-breaking up days do not translate into record-breaking terms. They coincide with the most turbulent stretches within them. That being said, the market has generally been excellent for each Presidential term across the past 20 years.
What to Watch
Readers who want the index exposure discussed here own DIA for the Dow, or the SPDR S&P 500 ETF (NYSE:SPY) and Vanguard S&P 500 ETF (NYSEARCA:VOO) for the broader market. SPY is up 13.10% year to date and VOO 13.75%, with the Fed funds upper bound anchored at 3.75% and first-quarter real GDP growth at 1.5%. Consumer sentiment sits at 49.5, a reading Michigan classifies as pessimistic.
Whether or not Trump’s second term exceeds the 55.66% return under Biden will largely depend on the progression of AI as it has anchored returns under his second term. It’s also worth noting that returns aren’t real. Stocks increased 55.6% under Biden’s term, but inflation dramatically cut into spending power.
Contact [email protected] for any questions or corrections.
Joel South covers large-cap stocks, dividend investing, and major market trends, with a focus on earnings analysis, valuation, and turning complex data into actionable insights for investors.
He brings more than 15 years of experience as an investor and financial journalist, including 12 years at The Motley Fool, where he served as an investment analyst, Bureau Chief, and later led the Fool.com investing news desk. He has also co-hosted an investing podcast and appeared across TV and radio discussing market trends.