Down but Not Out: Analysts See 40% Upside in Netflix After the Slide
Netflix has shed more than a third of its value in a year, yet analysts keep stacking up buy ratings with price targets that sit far above Wall Street consensus. The question is whether the sell-off exposed a genuine crack…

This post may contain links from our sponsors and affiliates, and Flywheel Publishing may receive compensation for actions taken through them.
Netflix (NASDAQ:NFLX | NFLX Price Prediction) has taken a beating over the past year, and the sell-off has flipped a growth darling into a value debate. But the fundamentals have not cracked, the buyback engine is running hot, and the ad-tier is scaling faster than most bulls modeled a year ago. Our 24/7 Wall St. price target reflects that disconnect between share price and cash flow generation.
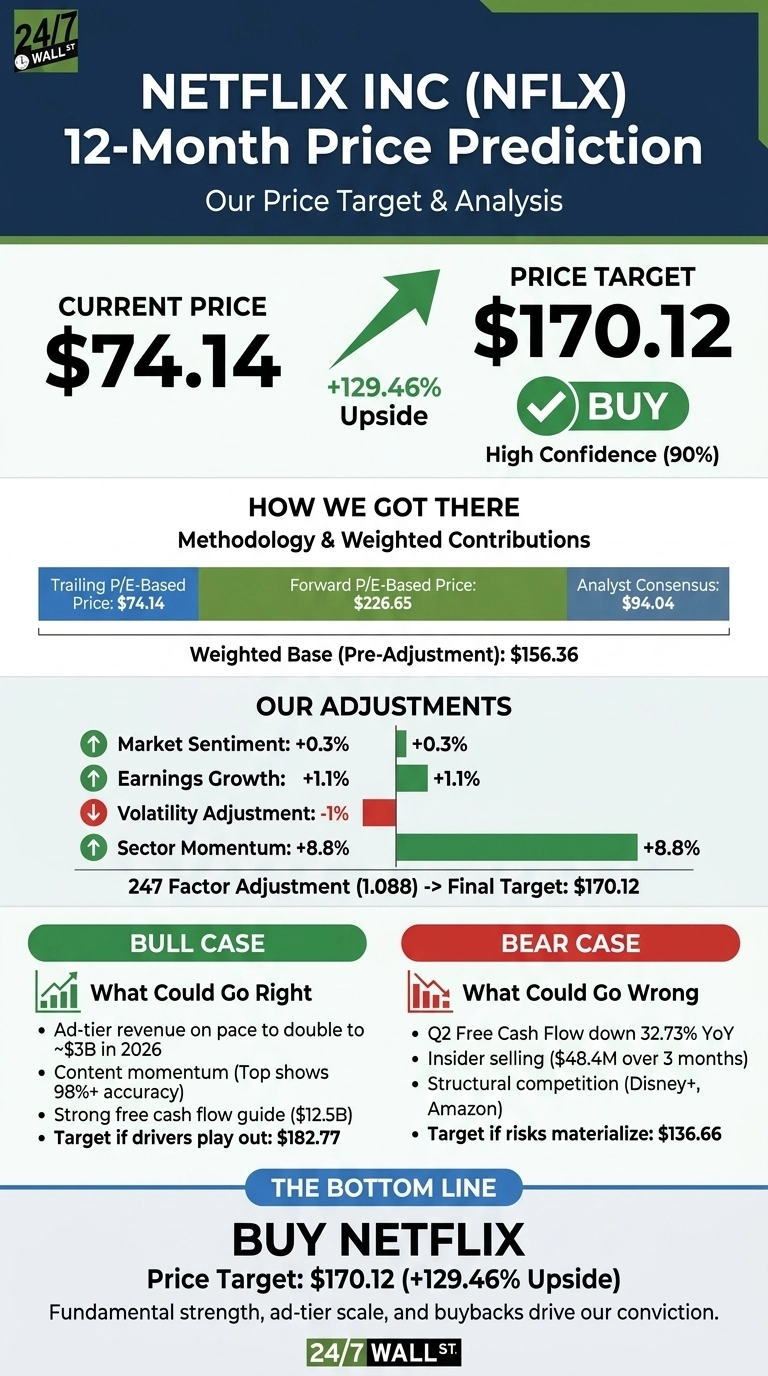
The 24/7 Wall St. Price Target for Netflix

Netflix trades at $74.14 after a 37.19% slide over the past year. Our 24/7 Wall St. price target is $170.12, well above Wall Street consensus of $94.04, which itself implies the roughly 40% upside referenced in analyst notes. Our model carries high confidence (0.9) and a buy recommendation.
| Metric | Value |
|---|---|
| Current Price | $74.14 |
| 24/7 Wall St. Price Target | $170.12 |
| Upside | 129.46% |
| Recommendation | BUY |
| Confidence Level | 90% |
How the Slide Set Up the Setup
Netflix is down 20.93% year to date and sits 26% below its 52-week high of $126.71.
Q2 FY2026 was a tale of two lines: EPS came in at $0.80 against a $0.7883 estimate, while revenue of $12.56B narrowly missed. Ad revenue is on pace to roughly double to $3B in 2026, and Netflix repurchased $4.7B in Q2, its largest quarter ever, with $27.1B still authorized.
The Case for $180 and Above
The bull case rests on ad-tier scale. Advertiser count is up 70% YoY to 4,000+, and full-year 2026 guidance calls for revenue of $51B to $51.4B with a 31.5% operating margin and $12.5B in free cash flow.
Content momentum is real: prediction markets rate top show accuracy at 98%+, and live sports plus the NFL deal expand ad inventory. Our bull-case one-year target is $182.77.
What Could Go Wrong
Free cash flow slipped to $1.53B in Q2, down 32.73% YoY, and insider selling totaled $48.4 million over three months, including a $2M sale by CEO Gregory Peters.
Bulls would counter that FCF weakness reflects front-loaded content amortization in H1 2026, and a chunk of insider sales are pre-arranged 10b5-1 plans. Competition from Disney+, Amazon Prime Video, and YouTube remains structural. Our bear case one-year target sits at $136.66.
How Netflix Compares to Disney and Spotify
Walt Disney (NYSE:DIS) is the closest direct streaming competitor with a scaled ad tier and live sports through ESPN. Disney trades at a materially lower valuation than Netflix on trailing earnings, but its streaming margins remain below Netflix’s 33.4% operating margin, which is why our target rewards Netflix’s superior profitability.
Spotify (NYSE:SPOT) is the cleanest subscription-media comp. Spotify commands a premium multiple on accelerating ad growth and margin expansion, a template Netflix’s ad business is now following. If Netflix’s ad tier hits the $3B 2026 target, the multiple gap should compress and validate our $170 target as reasonable rather than aggressive.
Netflix Price Prediction 2026-2030
The setup looks constructive if Q3 delivers on the $12.86B revenue guide and ad tier scales as planned. The case weakens if free cash flow keeps deteriorating into H2. With 36 Buy ratings versus 0 Sell ratings and a 24/7 Wall St. Price Target of $170.12, the risk/reward tilts firmly bullish.

| Year | 24/7 Wall St. Price Target |
|---|---|
| 2026 | $95 |
| 2027 | $170 |
| 2028 | $285 |
| 2029 | $450 |
| 2030 | $731 |
These projections assume Netflix continues executing on ad-tier scale and buybacks. Significant downside could result from a subscriber growth stall or a competitive re-rating of streaming multiples.
Contact [email protected] for any questions or corrections.
Vandita Jadeja is a financial publisher with over a decade of experience writing about financial topics, including investment, savings, retirement, insurance and banking. Vandita is a Chartered Accountant who loves to debunk financial concepts for readers.
Her work has appeared on sites that include The Motley Fool, InvestorPlace, and Benzinga. She covers investing and focuses on stock picks and price prediction for 24/7 Wall St.
When not looking for the next stock investment opportunity, she can be found traveling, reading, chasing sunsets and enjoying her iced latte.